. 2021 Jul 28;7(7):1166-1175.
doi: 10.1021/acscentsci.1c00173. Epub 2021 Jun 16.

Janus Emulsion Biosensors for Anti-SARS-CoV-2 Spike Antibody

Affiliations

Janus Emulsion Biosensors for Anti-SARS-CoV-2 Spike Antibody

Jie Li et al. ACS Cent Sci. .

Abstract

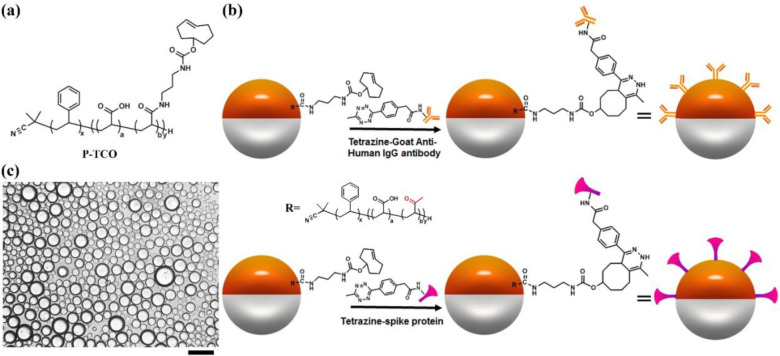
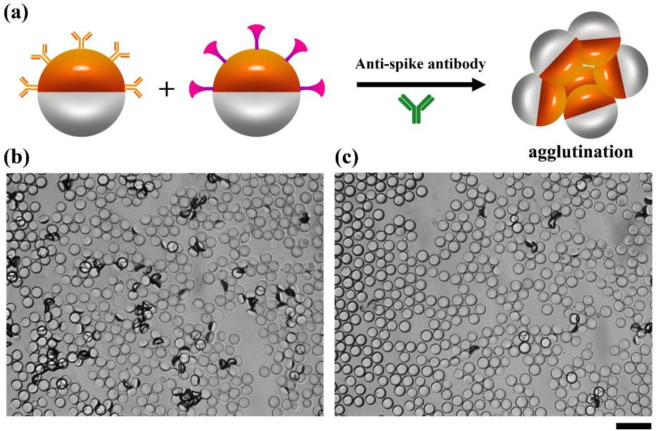
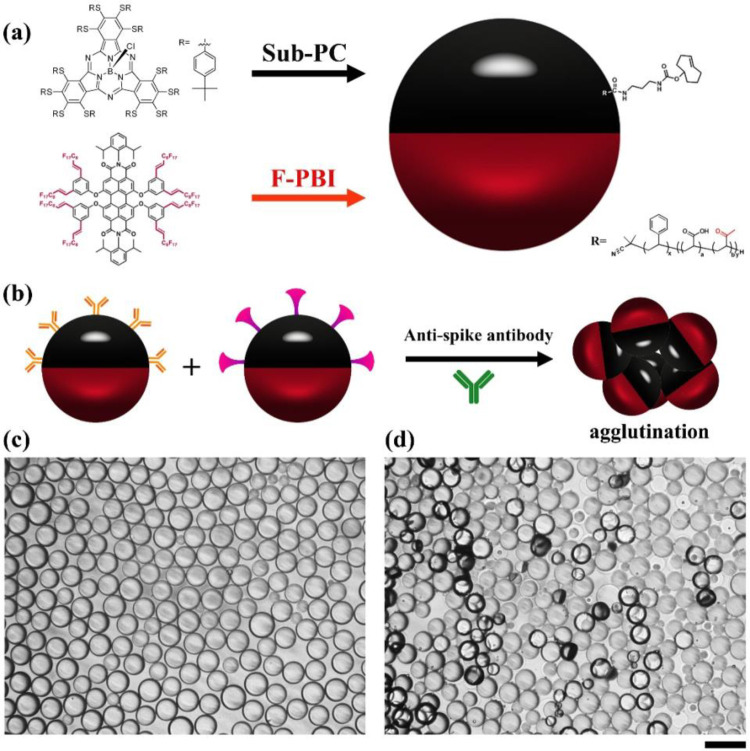
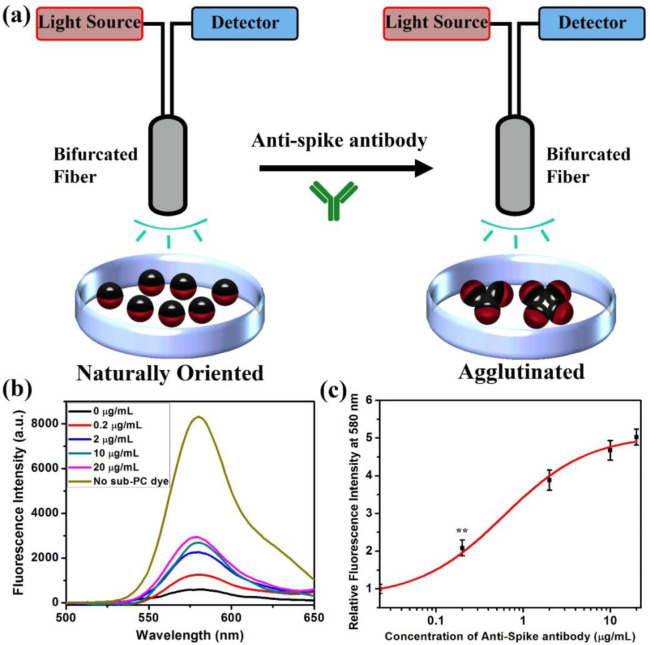
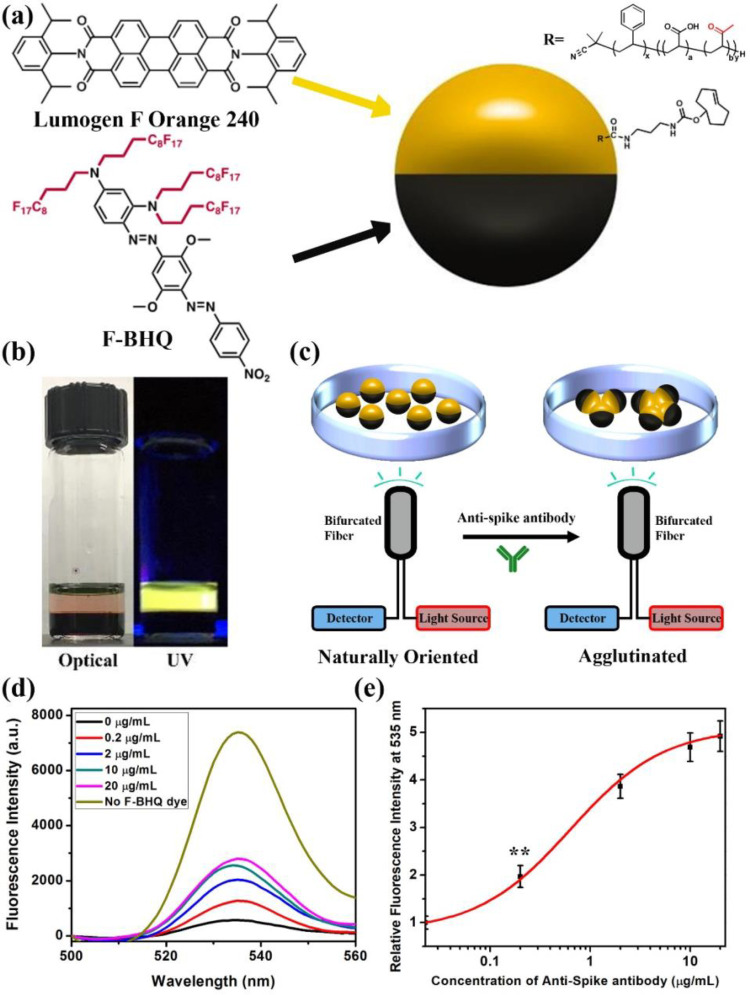
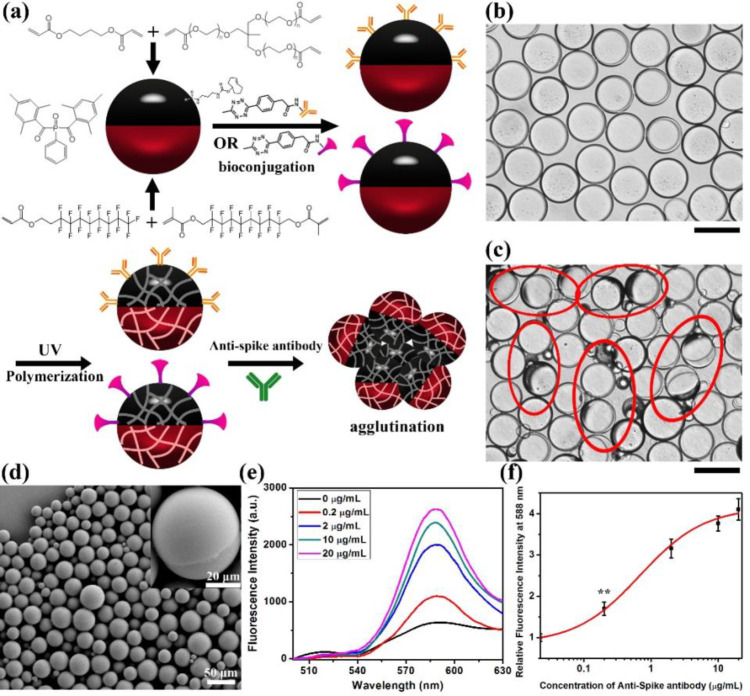
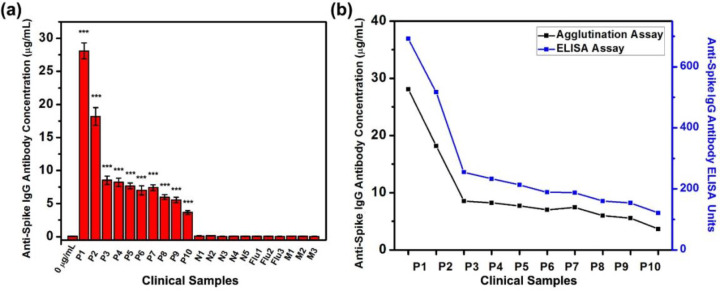
The spread of the COVID-19 pandemic around the world has revealed that it is urgently important to develop rapid and inexpensive assays for antibodies in general and anti-SARS-CoV-2 IgG antibody (anti-SARS-CoV-2 spike glycoprotein S1 antibody) in particular. Herein we report a method to detect the anti-SARS-CoV-2 spike antibody level by using Janus emulsions or Janus particles as biosensors. Janus emulsions are composed of two immiscible hydrocarbon and fluorocarbon oils. The hydrocarbon/water interfaces are functionalized with a secondary antibody of IgG protein and SARS-CoV-2 spike receptor binding domain (RBD), to produce two different Janus emulsions. Mixtures of these Janus droplets enable the detection of the anti-SARS-CoV-2 spike IgG antibody in an agglutination assay caused by the antibody's binding to both the secondary antibody of IgG antibody and SARS-CoV-2 spike protein RBD. Both qualitative optical images and quantitative fluorescence spectra are able to detect the level of anti-SARS-CoV-2 spike antibody at concentrations as low as 0.2 μg/mL in 2 h. The detection results of clinical human serum samples using this agglutination assay confirm that this method is applicable to clinical samples with good sensitivity and specificity. The reported method is generalizable and can be used to detect other analytes by attaching different biomolecular recognition elements to the surface of the Janus droplets.


Conflict of interest statement

The authors declare no competing financial interest.

Figures

Figure 1
Figure 1
General scheme for interfacial bioconjugation of the Janus droplets’ hydrocarbon phase. (a) Chemical structure of polymer P-TCO. (b) Bioconjugation scheme of Tetrazine Goat Anti-Human IgG antibody and Tetrazine-SARS-CoV-2 spike protein receptor binding domain (RBD) to P-TCO at the hydrocarbon–water interface of Janus droplets. (c) Optical image of 1:1 mixture of P-TCO polydisperse Janus droplets after bioconjugation with SARS-CoV-2 spike RBD and P-TCO Janus droplets after bioconjugation with Goat Anti-Human IgG antibody. Scale bar = 50 μm.
Figure 2
Figure 2
Agglutination assay achieved by adding anti-SARS-CoV-2 spike IgG antibody into the continuous phase of the mixture of Janus droplets. (a) Agglutination scheme with the addition of anti-SARS-CoV-2 spike antibody. (b) Bright field microscope image of a 1:1 mixture of Goat Anti-Human IgG antibody and SARS-CoV-2 spike protein RBD bioconjugated monodispersed droplets, 2 h after the addition of 60 μg/mL anti-SARS-CoV-2 spike antibody. The scatter light of the agglutinated droplets appears as dark objects. (c) The same assay as in panel b, but with 1 μg/mL anti-SARS-CoV-2 spike antibody. Scale bar = 50 μm.
Figure 3
Figure 3
Illustration of the agglutination assay with Janus droplets containing blocker dye sub-PC in the hydrocarbon phase and emissive dye F-PBI in the fluorocarbon phase. (a) Scheme of a P-TCO functionalized Janus droplet with a blocker sub-PC dye in the hydrocarbon phase and the F-PBI red emissive dye in the fluorocarbon phase. (b) Agglutination scheme with the two-dye system. (c) Optical microscope image of the fully bioconjugated monodispersed droplets (1:1 mixture) that also contain the two dyes showing their aligned state without the addition of anti-SARS-CoV-2 spike antibody. (d) Optical microscope image of the same 1:1 mixture as in part c, but with the addition of anti-SARS-CoV-2 spike antibody at a concentration of 20 μg/mL after 2 h. Scale bar = 50 μm.
Figure 4
Figure 4
Quantification of agglutination assay by measuring the fluorescence spectra. (a) Schematic of excitation and detection of fluorescence from the naturally oriented or agglutinated dye containing emulsions. Light is only able to reach the red dye when the droplets are tilted in the agglutinated structure. (b) Fluorescence spectra (λex = 361 nm) of 1:1 mixture of dye containing fully bioconjugated Janus droplets with the addition of anti-SARS-CoV-2 spike antibody at different concentrations. Note that the fluorescence intensity increases with concentration. (c) Correlation of concentration of anti-SARS-CoV-2 spike antibody and relative fluorescence intensity at 580 nm. All error bars are standard deviation calculated from three independent experiments (n = 3), and the asterisks (∗∗) represent statistical significance (**p ≤ 0.01).
Figure 5
Figure 5
Illustrations of Janus droplets containing emissive Lumogen F Orange 240 dye in the hydrocarbon phase and blocker dye F-BHQ in the fluorocarbon phase and agglutination quantification. (a) A Janus droplet having an emissive perylene dye (Lumogen F Orange 240) in the hydrocarbon phase and a nonemissive dye (F-BHQ) in the fluorocarbon phase. (b) Optical image of Lumogen F Orange 240 in DEB and F-BHQ in HFE7500 under normal or UV light. (c) Bottom excitation and detection scheme of Janus droplets containing F-BHQ and Lumogen F Orange 240. (d) Fluorescence spectra (λex = 400 nm) of a 1:1 mixture of bioconjugated Janus droplets containing of F-BHQ dye in the fluorocarbon phase, P-TCO, and Lumogen F Orange 240 dye in the hydrocarbon phase, after the addition of anti-SARS-CoV-2 spike antibody at different concentrations. (e) Correlation of concentration of anti-SARS-CoV-2 spike antibody and relative fluorescence intensity at 535 nm. All error bars are standard deviations calculated from three independent experiments (n = 3), and the asterisks (∗∗) represent statistical significance (**p ≤ 0.01).
Figure 6
Figure 6
Polymerization of Janus droplets to form Janus particles. (a) Schematic illustration of the polymerization of Janus droplets and their agglutination. (b) Optical image of Janus particles before the addition of anti-SARS-CoV-2 spike antibody. Scale bar = 50 μm. (c) Optical image of 1:1 mixture of Janus particles 2 h after the addition of 20 μg/mL of anti-SARS-CoV-2 spike antibody. The red circles on the image signify the agglutinations of Janus particles. Note that some minor agglutinations are not circled to minimize clutter in the image. Scale bar = 50 μm. (d) SEM image of Janus particles after polymerization. (e) Fluorescence spectra (λex = 361 nm) of particles containing of F-PBI dye in the fluorocarbon phase, P-TCO, and sub-PC dye in the hydrocarbon phase, after addition of anti-SARS-CoV-2 spike antibody at different concentrations. (f) Correlation of concentration of anti-SARS-CoV-2 spike antibody and relative fluorescence intensity at 588 nm. All error bars are standard deviation calculated from three independent experiments (n = 3), the asterisks (∗∗) represent statistical significance (**p ≤ 0.01).
Figure 7
Figure 7
Detection of anti-SARS-CoV-2 spike IgG antibody concentrations by top-read agglutination assay in clinical human serum samples from COVID-19 and normal patients. (a) Summary of concentrations of anti-SARS-CoV-2 spike IgG antibody detected in human sera from COVID-19 patients (P1 to P10), patients who are negative for SARS-CoV-2 (N1 to N5), patients who are negative for SARS-CoV-2 but have anti-influenza IgG antibody (Flu1 to Flu 3), and patients who are negative for SARS-CoV-2 but have anti-MERS-CoV spike IgG antibody (M1 to M3), by adding sera into the continuous phase of 1:1 mixture of Janus droplets containing of F-PBI dye in the fluorocarbon phase, and P-TCO and sub-PC dye in the hydrocarbon phase. Sample 0 μg/mL is the control with no addition of anti-SARS-CoV-2 spike IgG antibody or serum into the continuous phase of Janus droplets. All error bars are standard deviation calculated from three independent experiments (n = 3), and the asterisks (∗∗∗) represent statistical significance (***p ≤ 0.001). (b) Comparation of agglutination assay (black) and ELISA (blue) on the quantification of anti-SARS-CoV-2 spike IgG antibody in human sera from COVID-19 patients.

References

    1. Fauci A. S.; Lane H. C.; Redfield R. R. Covid-19 - Navigating the Uncharted. N. Engl. J. Med. 2020, 382 (13), 1268–1269. 10.1056/NEJMe2002387. - DOI - PMC - PubMed
    1. He F.; Deng Y.; Li W. Coronavirus Disease 2019: What We Know?. J. Med. Virol. 2020, 92 (7), 719–725. 10.1002/jmv.25766. - DOI - PMC - PubMed
    1. Duan K.; Liu B.; Li C.; Zhang H.; Yu T.; Qu J.; Zhou M.; Chen L.; Meng S.; Hu Y.; et al. Effectiveness of Convalescent Plasma Therapy in Severe COVID-19 Patients. Proc. Natl. Acad. Sci. U. S. A. 2020, 117 (17), 9490–9496. 10.1073/pnas.2004168117. - DOI - PMC - PubMed
    1. Baden L. R.; Rubin E. J. Covid-19 - The Search for Effective Therapy. N. Engl. J. Med. 2020, 382 (19), 1851–1852. 10.1056/NEJMe2005477. - DOI - PMC - PubMed
    1. Golchin A.; Seyedjafari E.; Ardeshirylajimi A. Mesenchymal Stem Cell Therapy for COVID-19: Present or Future. Stem Cell Rev. Rep. 2020, 16 (3), 427–433. 10.1007/s12015-020-09973-w. - DOI - PMC - PubMed