This is a preprint.
Children with SARS-CoV-2 in the National COVID Cohort Collaborative (N3C)
- PMID: 34341796
- PMCID: PMC8328064
- DOI: 10.1101/2021.07.19.21260767
Children with SARS-CoV-2 in the National COVID Cohort Collaborative (N3C)
Update in
-
Characteristics, Outcomes, and Severity Risk Factors Associated With SARS-CoV-2 Infection Among Children in the US National COVID Cohort Collaborative.JAMA Netw Open. 2022 Feb 1;5(2):e2143151. doi: 10.1001/jamanetworkopen.2021.43151. JAMA Netw Open. 2022. PMID: 35133437 Free PMC article.
Abstract
Importance: SARS-CoV-2.
Objective: To determine the characteristics, changes over time, outcomes, and severity risk factors of SARS-CoV-2 affected children within the National COVID Cohort Collaborative (N3C).
Design: Prospective cohort study of patient encounters with end dates before May 27th, 2021.
Setting: 45 N3C institutions.
Participants: Children <19-years-old at initial SARS-CoV-2 testing.
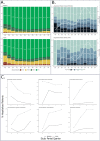
Main outcomes and measures: Case incidence and severity over time, demographic and comorbidity severity risk factors, vital sign and laboratory trajectories, clinical outcomes, and acute COVID-19 vs MIS-C contrasts for children infected with SARS-CoV-2.
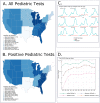
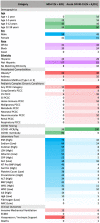
Results: 728,047 children in the N3C were tested for SARS-CoV-2; of these, 91,865 (12.6%) were positive. Among the 5,213 (6%) hospitalized children, 685 (13%) met criteria for severe disease: mechanical ventilation (7%), vasopressor/inotropic support (7%), ECMO (0.6%), or death/discharge to hospice (1.1%). Male gender, African American race, older age, and several pediatric complex chronic condition (PCCC) subcategories were associated with higher clinical severity (p ≤ 0.05). Vital signs (all p≤0.002) and many laboratory tests from the first day of hospitalization were predictive of peak disease severity. Children with severe (vs moderate) disease were more likely to receive antimicrobials (71% vs 32%, p<0.001) and immunomodulatory medications (53% vs 16%, p<0.001). Compared to those with acute COVID-19, children with MIS-C were more likely to be male, Black/African American, 1-to-12-years-old, and less likely to have asthma, diabetes, or a PCCC (p < 0.04). MIS-C cases demonstrated a more inflammatory laboratory profile and more severe clinical phenotype with higher rates of invasive ventilation (12% vs 6%) and need for vasoactive-inotropic support (31% vs 6%) compared to acute COVID-19 cases, respectively (p<0.03).
Conclusions: In the largest U.S. SARS-CoV-2-positive pediatric cohort to date, we observed differences in demographics, pre-existing comorbidities, and initial vital sign and laboratory test values between severity subgroups. Taken together, these results suggest that early identification of children likely to progress to severe disease could be achieved using readily available data elements from the day of admission. Further work is needed to translate this knowledge into improved outcomes.
Figures


References
-
- Center for Systems Science and Engineering (CSSE) at Johns Hopkins University (JHU). COVID-19 Dashboard. Johns Hopkins University & Medicine. https://coronavirus.jhu.edu/map.html. Published 2021. Accessed June 18, 2021.
Publication types
LinkOut - more resources
Full Text Sources
Miscellaneous
