[Preprint]. 2022 Jan 26:2021.07.12.21260227.
doi: 10.1101/2021.07.12.21260227.

SARS-CoV-2 antigen exposure history shapes phenotypes and specificity of memory CD8 T cells

Affiliations

SARS-CoV-2 antigen exposure history shapes phenotypes and specificity of memory CD8 T cells

Anastasia A Minervina et al. medRxiv. .

Update in

  • SARS-CoV-2 antigen exposure history shapes phenotypes and specificity of memory CD8+ T cells.
    Minervina AA, Pogorelyy MV, Kirk AM, Crawford JC, Allen EK, Chou CH, Mettelman RC, Allison KJ, Lin CY, Brice DC, Zhu X, Vegesana K, Wu G, Trivedi S, Kottapalli P, Darnell D, McNeely S, Olsen SR, Schultz-Cherry S, Estepp JH; SJTRC Study Team; McGargill MA, Wolf J, Thomas PG. Minervina AA, et al. Nat Immunol. 2022 May;23(5):781-790. doi: 10.1038/s41590-022-01184-4. Epub 2022 Apr 5. Nat Immunol. 2022. PMID: 35383307 Free PMC article.

Abstract

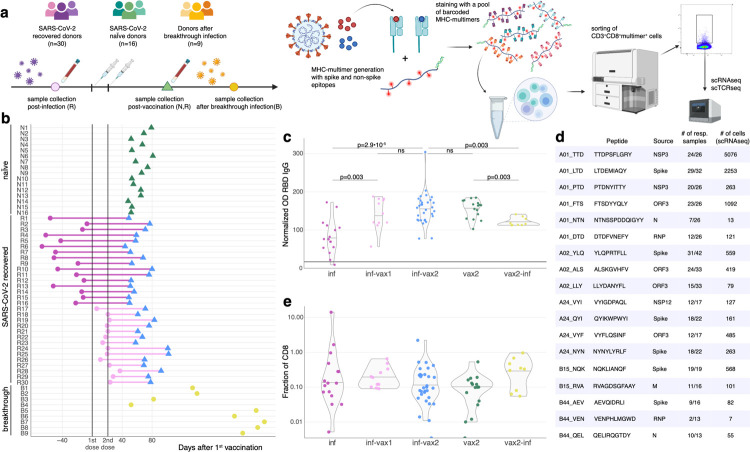
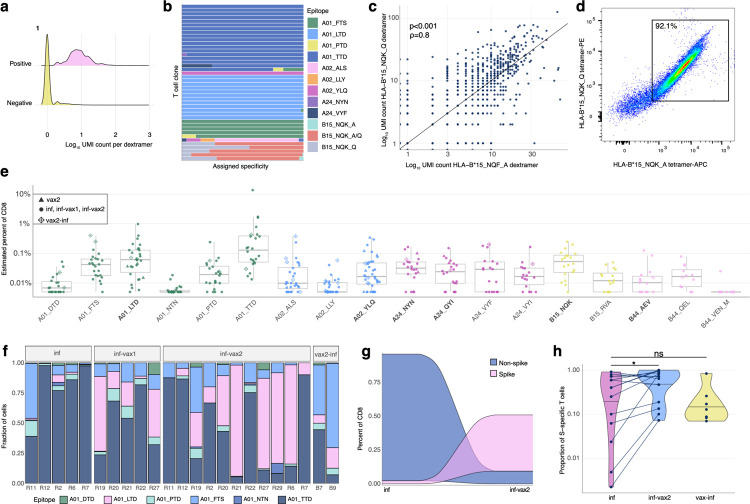
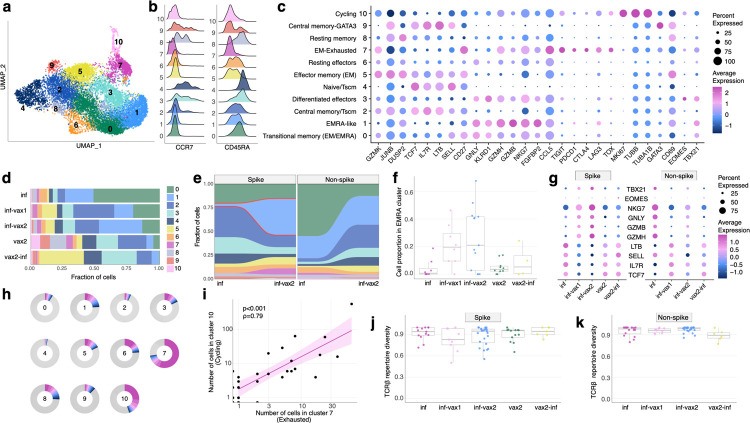
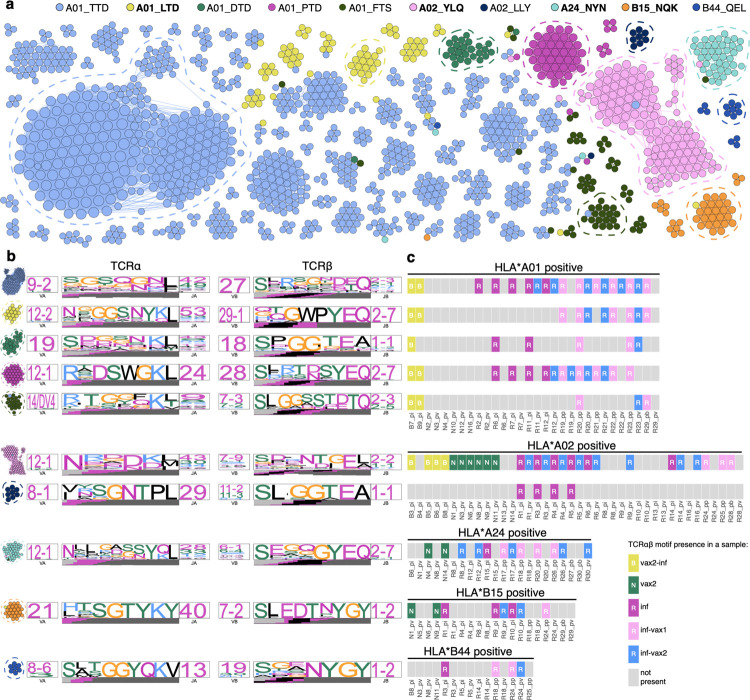
Although mRNA vaccine efficacy against severe COVID-19 remains high, variant emergence and breakthrough infections have changed vaccine policy to include booster immunizations. However, the effect of diverse and repeated antigen exposures on SARS-CoV-2 memory T cells is poorly understood. Here, we utilize DNA-barcoded MHC-multimers combined with scRNAseq and scTCRseq to capture the ex vivo profile of SARS-CoV-2-responsive T cells within a cohort of individuals with one, two, or three antigen exposures, including vaccination, primary infection, and breakthrough infection. We found that the order of exposure determined the relative distribution between spike- and non-spike-specific responses, with vaccination after infection leading to further expansion of spike-specific T cells and differentiation to a CCR7-CD45RA+ effector phenotype. In contrast, individuals experiencing a breakthrough infection mount vigorous non-spike-specific responses. In-depth analysis of over 4,000 epitope-specific T cell receptor sequences demonstrates that all types of exposures elicit diverse repertoires characterized by shared, dominant TCR motifs, with no evidence for repertoire narrowing from repeated exposure. Our findings suggest that breakthrough infections diversify the T cell memory repertoire and that current vaccination protocols continue to expand and differentiate spike-specific memory responses.


Conflict of interest statement

Competing interests

P.G.T has consulted or received honorarium and travel support from Illumina and 10X. P.G.T. serves on the Scientific Advisory Board of Immunoscape and Cytoagents.

Figures

Figure 1.
Figure 1.. Measuring CD8+ T cell epitope-specific responses after diverse SARS-CoV-2 exposures.
a. Study design. Selected spike and non-spike SARS-CoV-2 T cell epitopes were loaded on recombinant biotinylated MHC-monomers. Resulting peptide-MHC complexes were polymerized using fluorescently labeled and DNA-barcoded dextran backbones. Next, we stained PBMC samples with pools of MHC-multimers, isolated bound cells using FACS, and performed scRNAseq, scTCRseq, and CITEseq using the 10X Genomics platform. b. Time of blood sampling for each donor is shown relative to the first dose of mRNA vaccine. c. Anti-RBD IgG antibody levels in previously infected individuals increase after BNT162b2 vaccination. Anti-RBD IgG levels in the plasma were determined by ELISA. The normalized OD is the percent ratio of the sample OD to the OD of the positive control for each plate. Plasma was collected from previously infected donors prior (purple, inf), after 1 vaccine dose (inf-vax1, pink), and after 2 vaccine doses (inf-vax2, blue); SARS-CoV-2 naive donors after the full vaccination (vax2, green), and donors that were infected after vaccination (breakthrough, vax2-inf, yellow). All comparisons were done with Mann-Whitney U test, p-values are reported after Benjamini-Hochberg correction. Central line on violin plots depicts the median. d. List of SARS-CoV-2 epitopes used in this study and summary statistics for resulting epitope-specific response. e. Total frequency of MHC-dextramer-positive cells is similar in all studied groups (p>0.05 for all pairwise comparisons, Mann-Whitney U test after multiple test correction). Percentage of MHC-multimer-positive cells from all CD8+ T cells measured by flow cytometry is shown on a log10-scale. Central line on violin plots shows the median.
Figure 2.
Figure 2.. Magnitude, dynamics, and cross-reactivity of CD8+ epitope-specific responses after diverse SARS-CoV-2 exposures.
a. Antigen specificity of each T cell inferred from dextramer-barcode UMI counts. Representative distribution of the number of UMIs in cells called dextramer-positive (pink) and dextramer-negative (yellow). b. T cells within a clone have largely consistent specificity assignments, except T cells that cross-react with common cold coronavirus epitopes (B15_NQK_A/B15_NQK_Q pair). Each bar shows a fraction of cells of a given clonotype attributed to different dextramers. The 43 most abundant clones (more than 20 cells) are shown. c. The correlation between the number of UMIs for B15_NQK_Q (SARS-CoV-2) and B15_NQK_A (OC43 and HKU1) dextramers (Spearman ρ=0.8, p<0.001). d. Cross-reactivity between HLA-B*15:01-NQK epitope variants confirmed in vitro. Jurkat cell line expressing αβTCR identified from scTCRseq data binds pMHC multimers loaded with both SARS-CoV-2 and CCCoV variants of the epitope. e. The magnitude of epitope-specific CD8+ T cell responses. Each point depicts an estimated frequency of epitope-specific T cells in a sample. Estimated frequency was calculated as a fraction of dextramer-specific T cells in scRNAseq results multiplied by bulk frequency of dextramer-stained CD8+ cells of all CD8+ cells measured by flow cytometry. Central line on boxplot shows the median. Epitopes from spike protein are in bold font. f. Composition of HLA-A*01-restricted T cell response in HLA-A*01 positive donors. Increasing proportion of spike-targeting T cells (pink) is observed after vaccination of infected individuals. g. Boosting of spike-specific epitope fraction after vaccination (donor R6). h. Previously infected individuals have a higher proportion of spike-specific T cells after vaccination than before vaccination (p=0.025, one-sided Wilcoxon signed-rank test). Spike T cell proportion (shown on a log10-scale) was calculated as a fraction of spike-specific T cells out of all CD8+ epitope-specific T cells of a donor in scRNAseq data. Central line on the violin shows the median.
Figure 3.
Figure 3.. Phenotypic diversity of epitope-specific CD8+ T cells after diverse SARS-CoV-2 exposures.
a. UMAP (Uniform manifold approximation and projection) of all SARS-CoV-2 epitope-specific CD8 T cells based on gene expression (GEX). Color shows results of graph-based unsupervised clustering performed with the Seurat package. b. Density plot of CCR7 and CD45RA surface expression (measured by CITE-seq) in GEX clusters. c. Bubble plot of representative differentially expressed genes for each cluster. Size of the circle shows percentage of cells in a cluster expressing a certain gene, color scale shows gene expression level. d. Distribution of epitope-specific T cells in gene expression clusters between study groups. e. Proportion of spike-specific T cells is significantly increased in cluster 1 after vaccination of previously infected individuals, compared to the pre-vaccination timepoint (p<0.0001, Fisher exact test). f. Proportion of spike-specific cells in EMRA (cluster 1) across study groups for samples with more than ten spike-specific cells (Kruskal-Wallis H test p=0.028). Central line on boxplot shows the median. g. Expression of classical cytotoxic and memory markers across study groups and T cell specificities. Size of the circle shows percentage of cells in a cluster expressing a certain gene, color scale shows gene expression level. h. Clone size distribution within GEX clusters. Fractions of cells from 10 most abundant clonotypes in each cluster are shown with colors, all other clonotypes are shown in grey. i. Number of cells in cluster 7 (Exhausted) and cluster 10 (Cycling) in samples are strongly correlated (Spearman ρ=0.79, p<0.001). Shaded area shows 95% confidence interval for linear fit. j-k. T cell repertoire diversity of spike (j) and non-spike specific repertoires across study groups (p=0.63 for spike, p=0.17 for non-spike, Kruskal-Wallis H test). Normalized Shannon entropy of TCRβ is plotted for samples with more than 3 unique TCRβ clonotypes. Central line on boxplot shows the median.
Figure 4.
Figure 4.. Diverse polyclonal repertoires of epitope-specific T cells after diverse SARS-CoV-2 exposures
a. SARS-CoV-2 epitope-specific αβTCR amino acid clonotypes feature clusters of highly similar sequences with the same epitope specificity. Each node on a similarity network is a unique paired αβTCR amino acid sequence, and an edge connects αβTCRs with TCRdist less than 110. Each color represents a certain epitope specificity. Only clusters with more than two members are shown. Spike-derived epitopes are in bold font. b. TCR amino acid sequence motifs of α and β chains (TCRdist logos) for the largest clusters of highly similar TCRs for each epitope (circled with dashed line on a). c. TCRs with the same sequence motifs are found across all study groups in a matching HLA-background. Occurrence of TCR motifs on the left is shown for all HLA matching samples (rectangles on the plot). Grey rectangles represent samples lacking the TCR motif. The color of the rectangle that has a TCR motif corresponds to the sample group.

References

    1. Flemming A. Omicron, the great escape artist. Nat Rev Immunol (2022) doi: 10.1038/s41577-022-00676-6. - DOI - PMC - PubMed
    1. Mallajosyula V. et al. CD8+ T cells specific for conserved coronavirus epitopes correlate with milder disease in patients with COVID-19. Sci. Immunol. 6, (2021). - PMC - PubMed
    1. Rydyznski Moderbacher C. et al. Antigen-Specific Adaptive Immunity to SARS-CoV-2 in Acute COVID-19 and Associations with Age and Disease Severity. Cell 183, 996–1012.e19 (2020). - PMC - PubMed
    1. Kundu R. et al. Cross-reactive memory T cells associate with protection against SARS-CoV-2 infection in COVID-19 contacts. Nat Commun 13, 80 (2022). - PMC - PubMed
    1. Peng Y. et al. An immunodominant NP105–113-B*07:02 cytotoxic T cell response controls viral replication and is associated with less severe COVID-19 disease. Nat Immunol 23, 50–61 (2022). - PMC - PubMed

Publication types