[Preprint]. 2021 Sep 14:2021.07.23.21261013.
doi: 10.1101/2021.07.23.21261013.

Herd immunity induced by COVID-19 vaccination programs and suppression of epidemics caused by the SARS-CoV-2 Delta variant in China

Affiliations

Herd immunity induced by COVID-19 vaccination programs and suppression of epidemics caused by the SARS-CoV-2 Delta variant in China

Hengcong Liu et al. medRxiv. .

Update in

Abstract

Background: To allow a return to a pre-COVID-19 lifestyle, virtually every country has initiated a vaccination program to mitigate severe disease burden and control transmission. However, it remains to be seen whether herd immunity will be within reach of these programs.

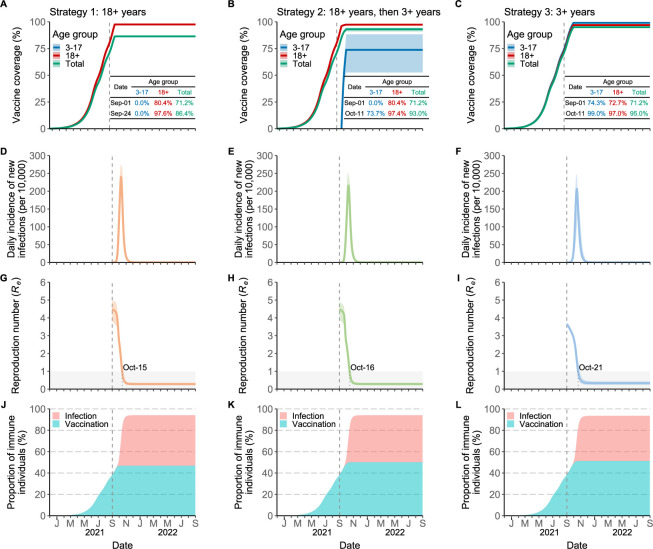
Methods: We developed a data-driven model of SARS-CoV-2 transmission for China, a population with low prior immunity from natural infection. The model is calibrated considering COVID-19 natural history and the estimated transmissibility of the Delta variant. Three vaccination programs are tested, including the one currently enacted in China and model-based estimates of the herd immunity level are provided.

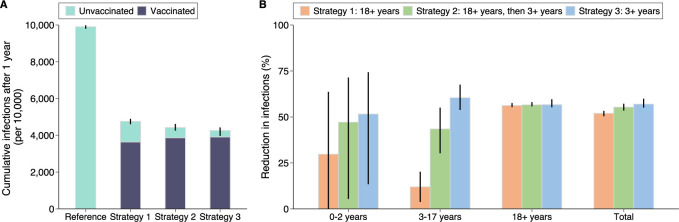
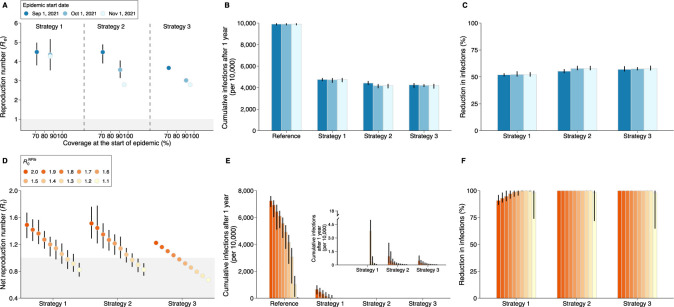
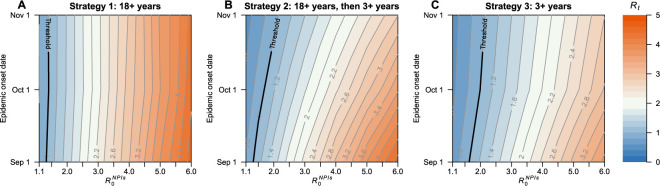
Results: We found that it is unlike to reach herd immunity for the Delta variant given the relatively low efficacy of the vaccines used in China throughout 2021, the exclusion of underage individuals from the targeted population, and the lack of prior natural immunity. We estimate that, assuming a vaccine efficacy of 90% against the infection, vaccine-induced herd immunity would require a coverage of 93% or higher of the Chinese population. However, even when vaccine-induced herd immunity is not reached, we estimated that vaccination programs can reduce SARS-CoV-2 infections by 53-58% in case of an epidemic starts to unfold in the fall of 2021.

Conclusions: Efforts should be taken to increase population's confidence and willingness to be vaccinated and to guarantee highly efficacious vaccines for a wider age range.

Keywords: Covid-19; Delta variant; SIR model; herd immunity; vaccination program.


Figures

Figure 1.
Figure 1.. Time series of vaccine coverage, daily incidence of new SARS-CoV-2 Delta variant infections, effective reproductive number, Re, and fraction of immune population.
A Age-specific vaccine coverage over time for strategy 1. Vaccination program is assumed to be initiated on November 30, 2020 (i.e., the time that the vaccine doses administrated was first officially reported in China). The dotted lines correspond the start of epidemic. The inserted table shows the age-specific coverage for the two key time points (the start of epidemic (i.e., September 1, 2021), and the time that the coverage keeps constant (i.e., September 24), respectively). The line corresponds to the mean value, while the shaded area represents 95% quantile intervals (CI). B As A, but for strategy 2. C As A, but for strategy 3. D Daily incidence of new SARS-CoV-2 infections per 10,000 individuals for strategy 1 (mean and 95% CI). E As D, but for strategy 2. F As D, but for strategy 3. G Effective reproduction number Re over time (mean and 95% CI), as estimated using the Next-Generation matrix method from the time series of susceptible individuals for strategy 1. The shaded area in gray indicates the epidemic threshold Re =1. The numbers around the shaded area indicate when Re cross this threshold (i.e., October 15) for strategy 1. H As G, but for strategy 2. I As G, but for strategy 3. J Proportion of immune population due to either natural infection or vaccination over time for strategy 1. K As J, but for strategy 2. L As J, but for strategy 3.
Figure 2.
Figure 2.. Burden of COVID-19 in the baseline scenario.
A Cumulative number of infections per 10,000 individuals after 1 simulated year for reference scenario and three vaccination strategies (mean and 95% CI). Reference scenario indicates no vaccination and no NPIs with R0=6.0 at the beginning of transmission. Infections consist of unvaccinated and vaccinated individuals. The bar corresponds to the mean value, while the vertical line represents 95% quantile intervals. B Reduction in infections (mean and 95% CI) with respect to the reference scenario in different age groups and the total population. The reduction is defined as the estimated number of infections after 1 year since the introduction of the initial infected individuals under reference scenario minus the one under the vaccination strategy, relative to the estimated number under reference scenario. The 95% CI of the reduction may cross 0 as the burden between reference scenario and vaccination scenario is approximately the same in some simulations. We thus trimmed the lower limit of 95% CI at 0 through the manuscript.
Figure 3.
Figure 3.. Impact of delaying the start of the epidemic and adopting NPIs.
A Estimated effective reproduction number (Re, mean and 95% CI) as a function of vaccine coverage at the time the infection is seeded (i.e., September 1, October 1 and November 1). Colors refer to the scenario of delaying the start of the epidemic to different date. The shaded area in gray indicates Re ≤1. B Cumulative number of infections per 10,000 individuals after 1 simulated year for reference scenario and three vaccination strategies (mean and 95% CI). Reference scenario indicates no vaccination and no NPIs with R0=6.0 at the beginning of transmission. C Reduction in infections (mean and 95% CI) with respect to the reference scenario. D As A, but for estimated net reproduction number (Rt, mean and 95% CI) adopting different intensity of NPIs, R0NPIs. E As B, but for the scenario of adopting different intensity of NPIs. F As C, but for the scenario of adopting different intensity of NPIs.
Figure 4.
Figure 4.. Impact of delaying the start of the epidemic start and adopting NPIs on estimated net reproduction number Rt.
A Estimated net reproduction number (Rt) as a function of R0NPIs and epidemic start date for strategy 1. The bold line in black indicates the herd immunity threshold Rt =1. B As A, but for strategy 2. C As A, but for strategy 3.
Figure 5.
Figure 5.. The impact of vaccine efficacy and vaccine coverage on estimated effective reproduction number Re.
The bold line in black indicates the herd immunity threshold Re =1. Re is estimated in the scenario that all individuals are eligible to vaccination and vaccinated 2 doses before the epidemic starts.

References

    1. Chinese Center for Disease Control and Prevention. Update on COVID-19 as of 24:00 on August 9, 2021. 2021. http://2019ncov.chinacdc.cn/2019-nCoV/ (accessed August 10 2021).
    1. World Health Organization. COVID-19 Weekly Epidemiological Update, 2021.
    1. Outbreak.info. B.1.617.2 Lineage Report. 2021. https://outbreak.info/situationhttps://outbreak.info/situation-reports?p... (accessed Aug 10 2021).
    1. Zhang M, Xiao J, Deng A, et al. Transmission Dynamics of an Outbreak of the COVID-19 Delta Variant B.1.617.2 – Guangdong Province, China, May – June 2021. China CDC Weekly 2021; 3: 584–6. - PMC - PubMed
    1. National Health Commision of the People’s Republic of China. Update on the doses of COVID-19 vaccine administration. 2021. http://www.nhc.gov.cn/xcs/yqjzqk/list_gzbd.shtml.

Publication types