. 2022 Apr;54(2):611-631.
doi: 10.3758/s13428-021-01606-5. Epub 2021 Aug 2.

DieTryin: An R package for data collection, automated data entry, and post-processing of network-structured economic games, social networks, and other roster-based dyadic data

Affiliations

DieTryin: An R package for data collection, automated data entry, and post-processing of network-structured economic games, social networks, and other roster-based dyadic data

Cody T Ross et al. Behav Res Methods. 2022 Apr.

Abstract

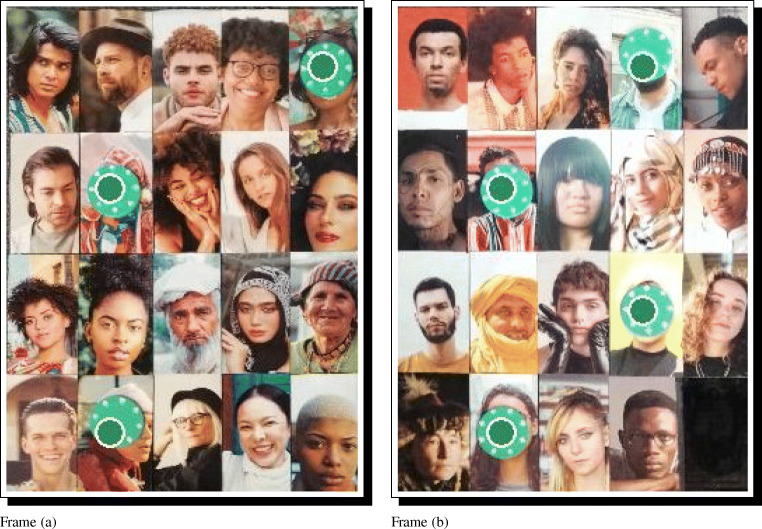
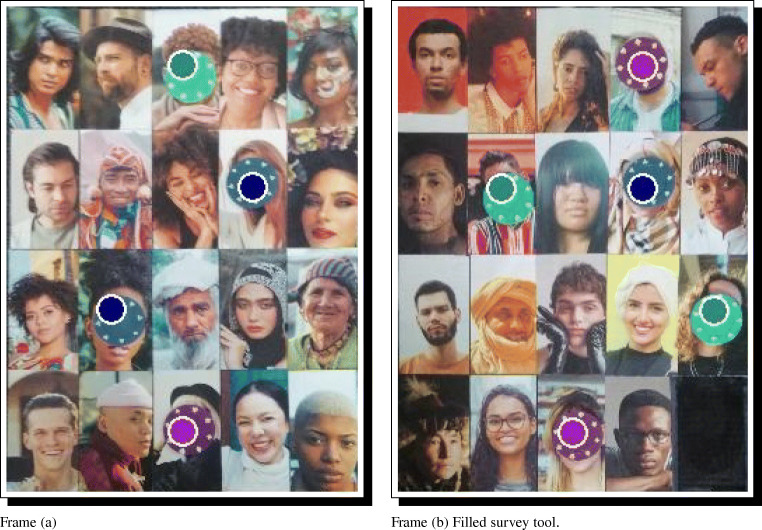
Researchers studying social networks and inter-personal sentiments in bounded or small-scale communities face a trade-off between the use of roster-based and free-recall/name-generator-based survey tools. Roster-based methods scale poorly with sample size, and can more easily lead to respondent fatigue; however, they generally yield higher quality data that are less susceptible to recall bias and that require less post-processing. Name-generator-based methods, in contrast, scale well with sample size and are less likely to lead to respondent fatigue. However, they may be more sensitive to recall bias, and they entail a large amount of highly error-prone post-processing after data collection in order to link elicited names to unique identifiers. Here, we introduce an R package, DieTryin, that allows for roster-based dyadic data to be collected and entered as rapidly as name-generator-based data; DieTryin can be used to run network-structured economic games, as well as collect and process standard social network data and round-robin Likert-scale peer ratings. DieTryin automates photograph standardization, survey tool compilation, and data entry. We present a complete methodological workflow using DieTryin to teach end-users its full functionality.

Keywords: Automated data entry; Behavioral economics; Economic games; Peer report data; Social networks; Social relations.


Figures

Fig. 1
Fig. 1
Here we outline methods for data collection using a photograph roster. a In the RICH allocation/giving game, each player is given a stack of coins and presented with a blank game-board; the player can give coins to anyone in the community by placing any number of coins on that person’s photograph. Coins not allocated to others are kept for the self by placing them on the focal’s own photograph. b In the RICH exploitation/taking game, each player is presented with a game-board in which all alters have a pre-existing allocation; the player can exploit others by taking the coin(s) off of their photographs and transferring them to the focal’s own photograph. c In the RICH costly reduction/punishment game, each player is presented with an empty game-board and a stack of coins; the player can keep these coins by placing them on their own photograph, or use these coins to purchase tokens that can be used to reduce the payout of any alter on the game board. d To define dyadic ties, a focal player is given a large stack of colored tokens and asked to place a token on each individual with whom they have a specific kind of social tie (e.g., their close friends). e To measure dyadic peer ratings, a focal player is first given several large stacks of colored tokens. The respondent is then told, for example, to place a blue token on very trustworthy people, a green token on very untrustworthy people, a purple token on people of average trustworthiness, and no tokens on individuals whom they do not know well enough to rate
Fig. 2
Fig. 2
Example raw photographs—corresponding to fictive respondents from a fictive field-site—prior to processing with DieTryin. Photographs vary in terms of size, aspect ratio, orientation, zoom, and centering. In large field-sites, manual adjustment of these variables for each respondent photograph using standard tools can be time consuming. DieTryin uses an R script to automate image standardization. With a single line of code, a database of images can be rapidly processed. Pexels (Bruno et al. 2020) has made these sample images available for free and open use. Sources and credits for each photo are included in the supplementary materials
Fig. 3
Fig. 3
Image standardization using a fictive resident from our fictive field-site. a Photograph rotation is accomplished by clicking in one of four quadrants. b Standardization of facial area is done by dragging and dropping a rectangular bounding box. c Result is a standardized photograph. The R script loops through all raw photographs in the database and saves all standardized photographs in a dedicated folder
Fig. 4
Fig. 4
Example standardized photographs—corresponding to fictive respondents from a fictive study site—after processing with DieTryin. Photographs are now of a fixed size, aspect ratio, orientation, zoom, and centering
Fig. 5
Fig. 5
This PDF can be used to record RICH game outcomes and other dyadic measures. Personal identifiers are automatically entered into the tables by DieTryin using the ID codes of the standardized photographs. Frame (a) illustrates the exported survey tool. Frame (b) illustrates how data on directed coin allocations may be recorded
Fig. 6
Fig. 6
Two physical game boards, filled with standardized and randomized recipient photographs. The order of panels can be randomized and recorded between repondents, and the order of photographs on the boards can be randomized as needed, by repeating the survey building code using different seed values
Fig. 7
Fig. 7
The manual data entry workflow. Frame a illustrates the required header data. Frames b and c illustrate coin allocation data correspoding to what is recorded in Fig. 5b. Personal identifiers are automatically entered into the tables, and are converted to zeros if not over-written by coin allocation data. In frame (a), HHID is household ID, RID is researcher ID, and ID is the personal ID of the focal respodent. Only ID and Game are required feilds, others can be left blank if desired
Fig. 8
Fig. 8
Photographs of the game boards after token allocations have be made to indicate dyadic ties. Note how the photographs may be rotated relative to center and affected by shearing. Although the amount of rotation and shearing depited here exceeds that which would be present in typical game board photographs taken by a careful researcher, even a small amount of rotation or shearing can make automatic classification difficult. To ensure accurate classification, DieTryin uses a two step process in R to first straighten and square the input photographs (Fig. 9), and then detect and classify token allocations (Fig. 10)
Fig. 9
Fig. 9
Simulated photographs of the game boards from Fig. 8 after applying an inverse transformation matrix to the skewed images. Note how the photographs are now cropped, unrotated relative to center, and no longer affected by shearing. At this point, individual recipient photographs are programmatically extracted from the array and analyzed using the automatic classification methods described in Fig. 10. DieTryin takes simple user input—point-and-click data on the corners of the game boards—and returns an edge-list of social ties (e.g., as in Table 1). Skew correction and token classification algorithms function under-the-hood, requiring no user input beyond identification of game board corners using a simple graphical user interface
Fig. 10
Fig. 10
The photograph processing workflow implemented by DieTryin. In step A, recipient photographs are extracted from the main array. In step B, a border width is excised to minimize the influence of clothing and background color. In step C, a Gaussian blur is applied to smooth out high-contrast regions. In step D, the standard RGB-image is converted into an HSL-image and threshold filters are applied based on saturation and luminosity layers; the resultant hue layer is then extracted. Finally, in step E, the density distribution (shown here in dark red) of hue values is calculated for each image and integrated between lower and upper hue thresholds (shown here in vertical light red and light blue bars). If the difference in area under the curve (and between hue thresholds) in the pre- and post-allocation images exceeds a threshold parameter, then a directed tie is coded as present. This process is repeated for each token color and for each respondent photograph; the resultant color-labeled edge-list is then returned to the user
Fig. 11
Fig. 11
Predicted dyadic ties corresponding to the data in Table 1 overlaid on the relevant game-board photographs. Green points indicate where the model has predicted that green tokens have been placed. In this case, we see that the model has correctly classified all true ties, and has not erroneously classified any non-ties. The model parameters must generally be tuned by the user before perfect classification is achieved. Automatic classifications should always be visually checked before the data are used to make scientific inferences
Fig. 12
Fig. 12
Predicted dyadic ties corresponding to the data in Table 2 overlaid on the relevant game-board photographs. Colored points indicate where the model has predicted that tokens of the same color have been placed. The model performs well for blue, green, and purple tokens, but tokens of red or orange hue can be hard to classify, as these hues are more likely to conflict with skin hue. As stated before, automatic classifications should always be visually checked to ensure that there are no errors introduced by the classification algorithm

Similar articles

Cited by

References

    1. Altmann J. Observational study of behavior: Sampling methods. Behaviour. 1974;49(3–4):227–266. doi: 10.1163/156853974X00534. - DOI - PubMed
    1. Amato KR, Van Belle S, Wilkinson B. A comparison of scan and focal sampling for the description of wild primate activity, diet and intragroup spatial relationships. Folia Primatologica. 2013;84(2):87–101. doi: 10.1159/000348305. - DOI - PubMed
    1. Bahrick HP, Bahrick PO, Wittlinger RP. Fifty years of memory for names and faces: A cross-sectional approach. Journal of Experimental Psychology. 1975;104(1):54. doi: 10.1037/0096-3445.104.1.54. - DOI
    1. Barrett BJ, McElreath RL, Perry SE. Pay-off-biased social learning underlies the diffusion of novel extractive foraging traditions in a wild primate. Proceedings of the Royal Society B. 2017;284(1856):20170358. doi: 10.1098/rspb.2017.0358. - DOI - PMC - PubMed
    1. Barthelme, S (2019). imager: Image Processing Library Based on ‘CImg’. https://CRAN.R-project.org/package=imager. R package version 0.41.2.

Publication types

LinkOut - more resources