

Effects of the Colorectal Cancer Control Program
- PMID: 34342362
- PMCID: PMC8497428
- DOI: 10.1002/hec.4397
Effects of the Colorectal Cancer Control Program
Abstract
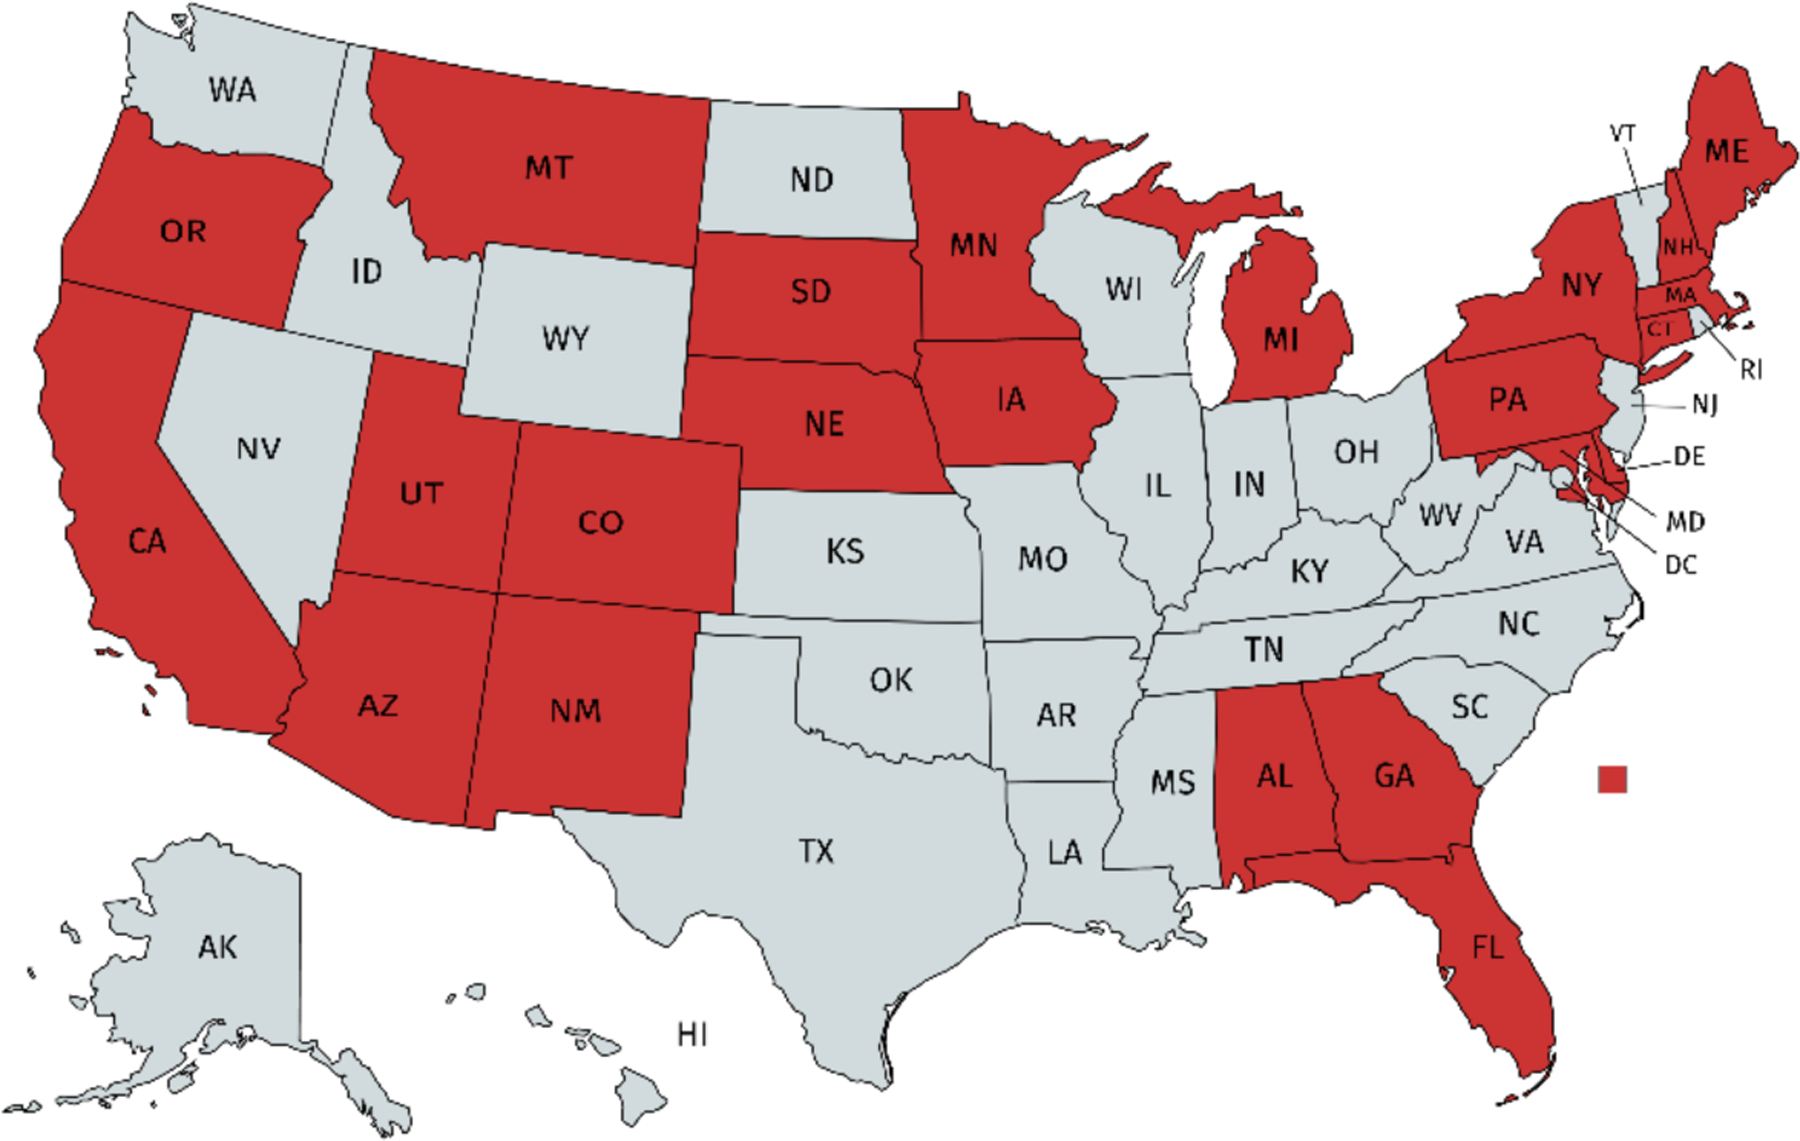
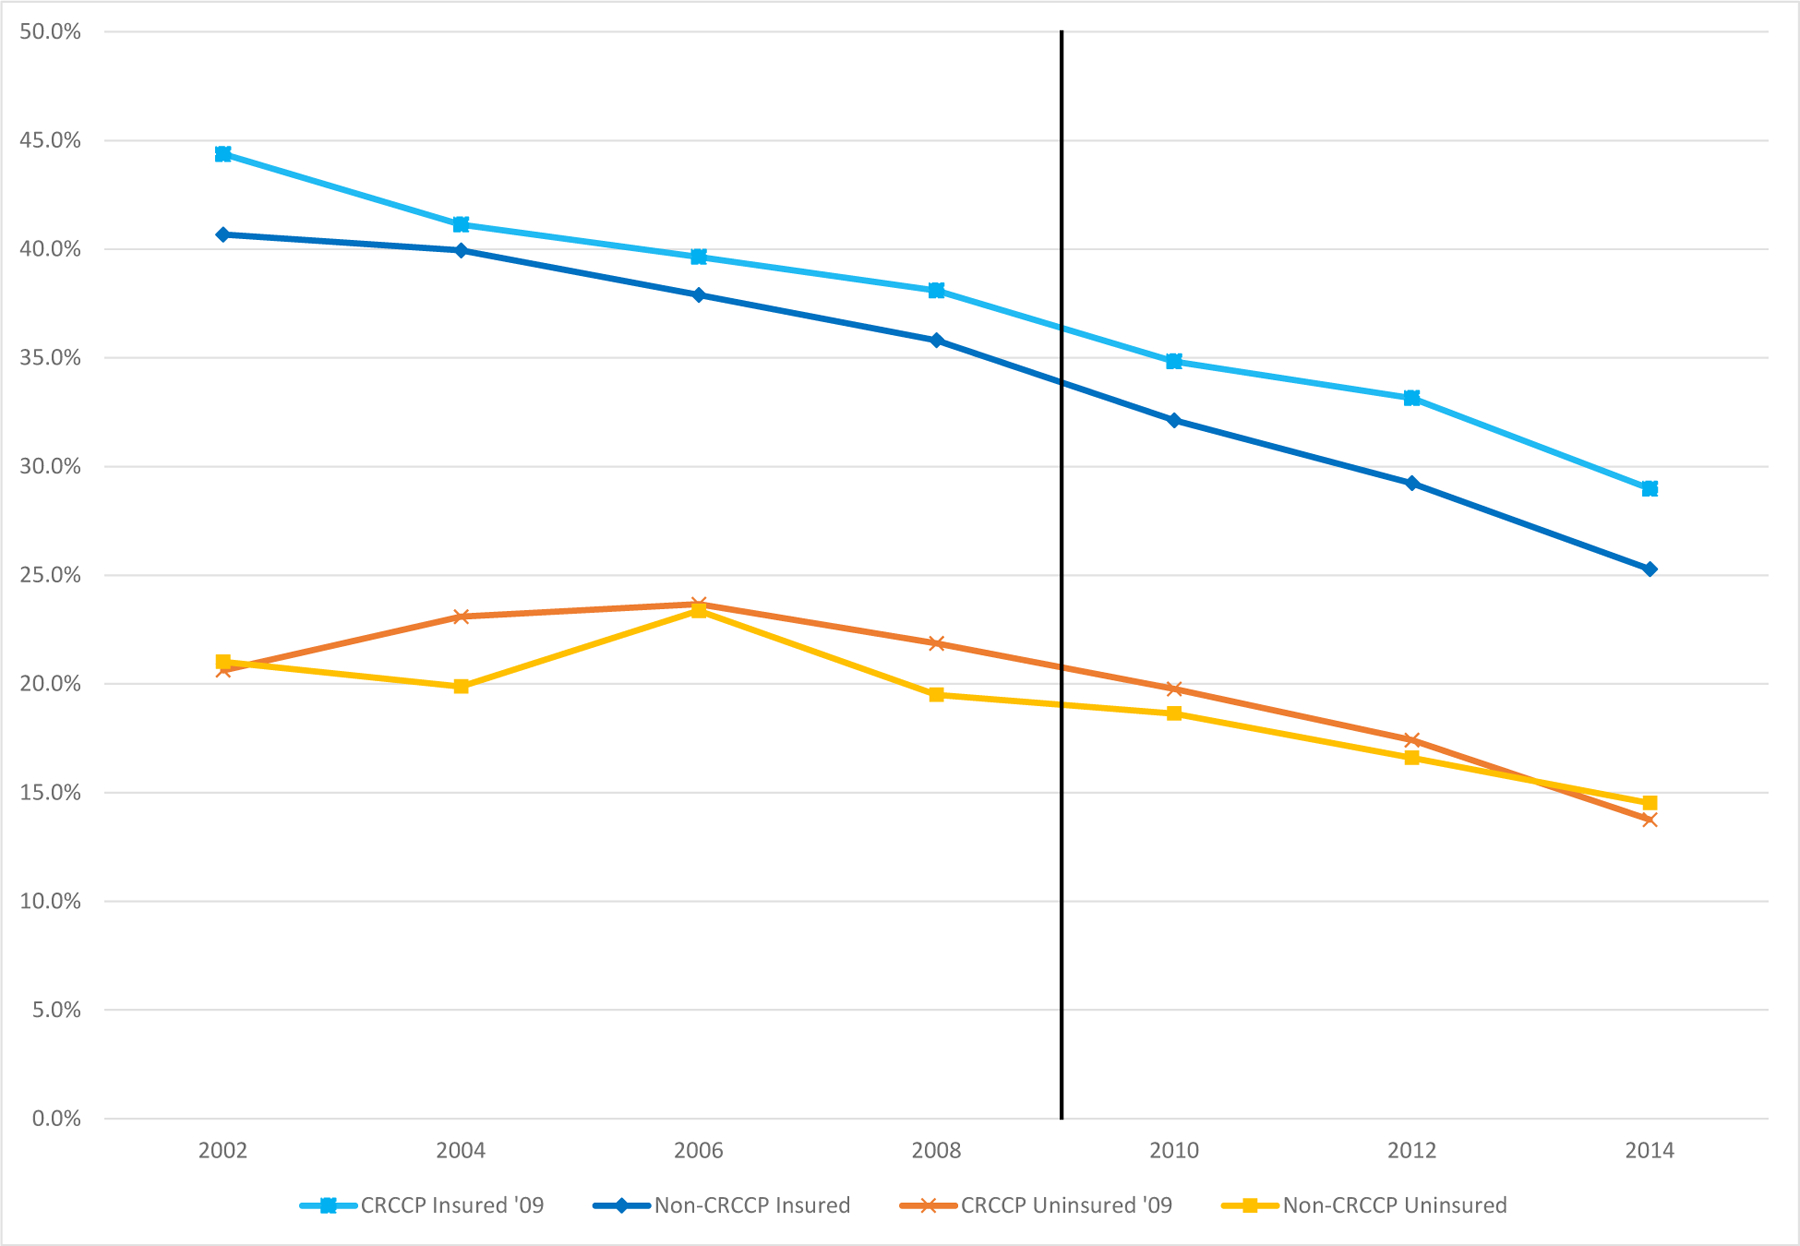
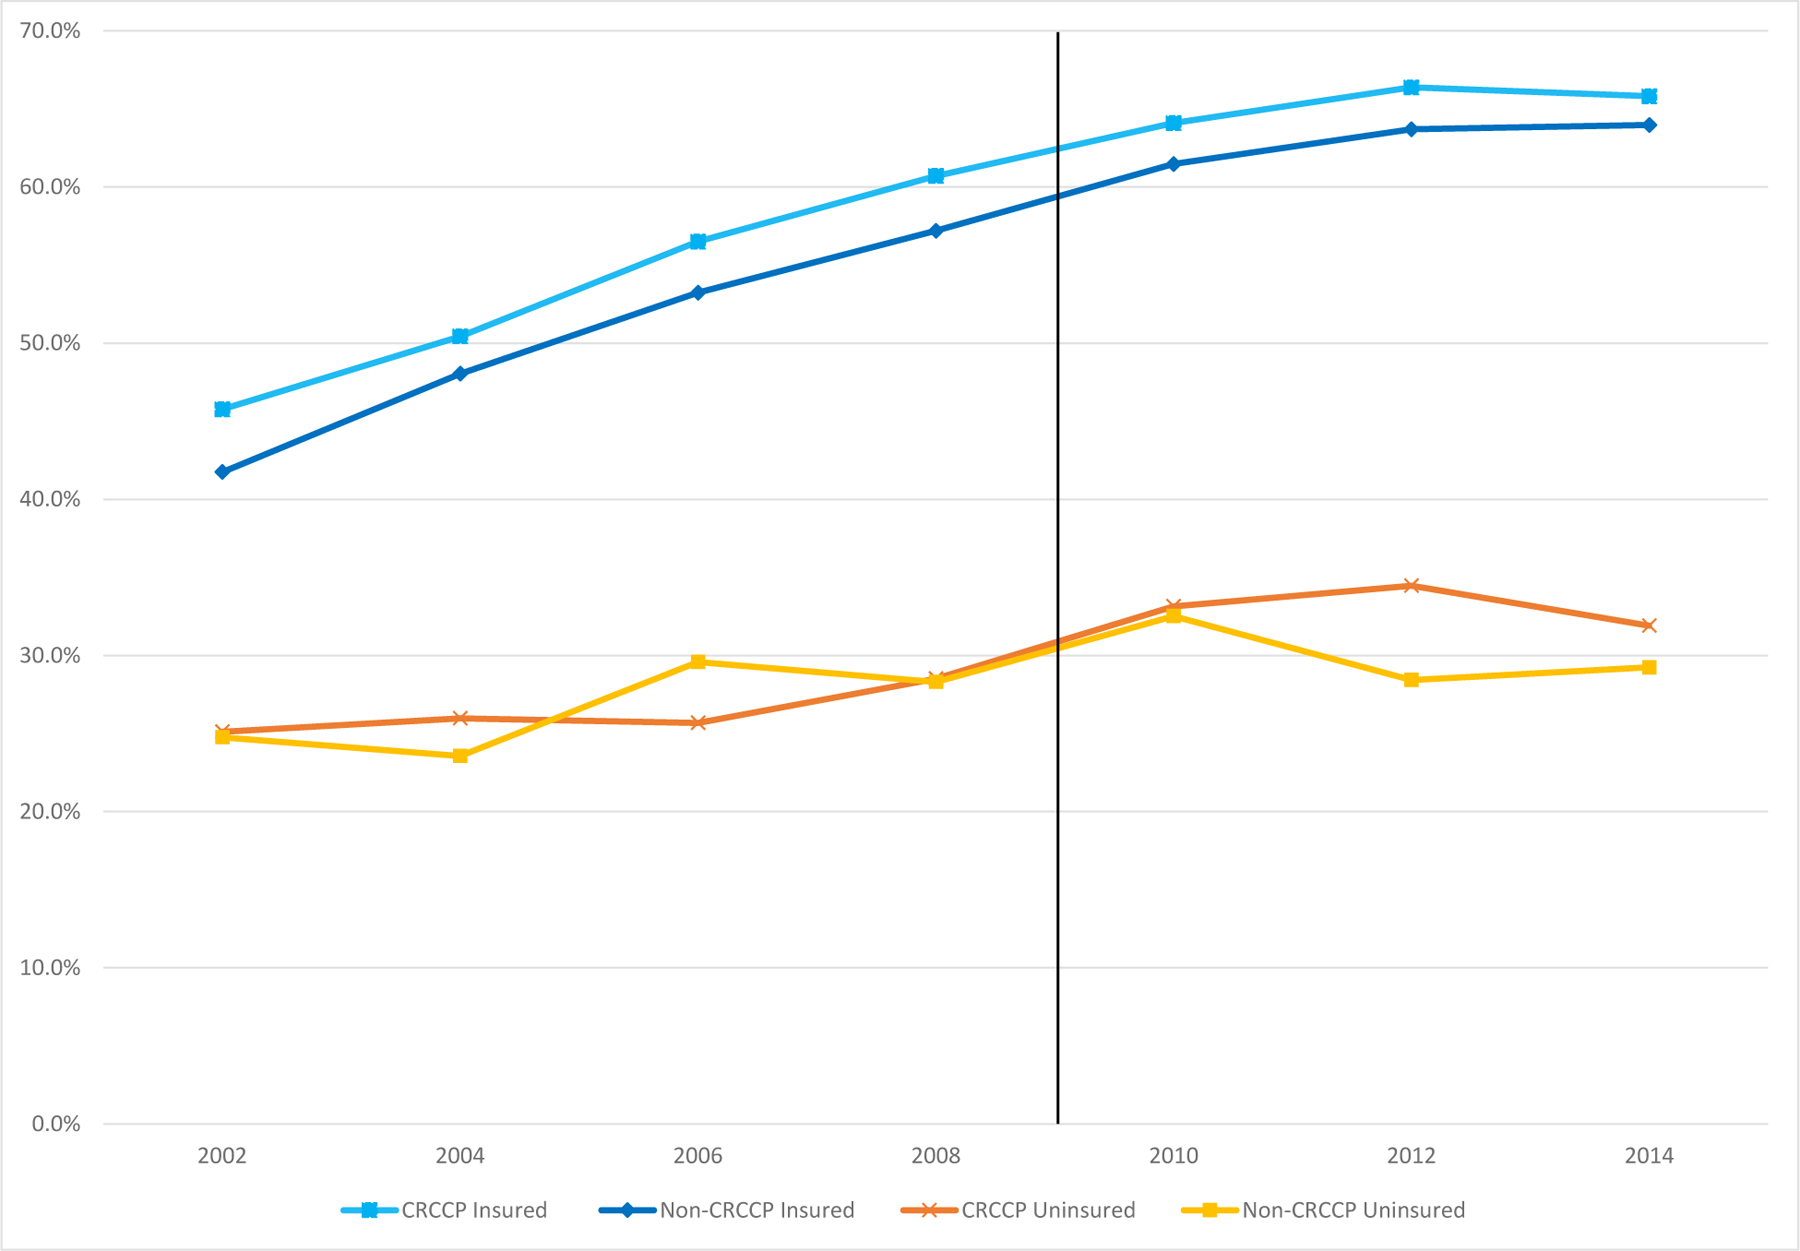
Although colorectal cancer (CRC) screening is highly effective, screening rates lag far below recommended levels, particularly for low-income people. The Colorectal Cancer Control Program (CRCCP) funded $100 million in competitively awarded grants to 25 states from 2009-2015 to increase CRC screening rates among low-income, uninsured populations, in part by directly providing and paying for screening services. Using data from the 2001-2015 Behavioral Risk Factor Surveillance System (BRFSS) and a difference-in-differences strategy, we find no effects of CRCCP on the use of relatively cheap fecal occult blood tests (FOBT). We do, however, find that the CRCCP significantly increased the likelihood that uninsured 50-64-year-olds report ever having a relatively expensive endoscopic CRC screening (sigmoidoscopy or colonoscopy) by 2.9 percentage points, or 10.7%. These effects are larger for women, minorities, and individuals who did not undertake other types of preventive care. We do not find that the CRCCP led to significant changes in CRC cancer detection. Our results indicate that the CRCCP was effective at increasing CRC screening rates among the most vulnerable.
Keywords: CRCCP; colorectal cancer screenings.
© 2021 John Wiley & Sons Ltd.
Conflict of interest statement
We have no conflicts of interest to disclose.
Figures
Similar articles
-
Promotion and provision of colorectal cancer screening: a comparison of colorectal cancer control program grantees and nongrantees, 2011-2012.Prev Chronic Dis. 2014 Oct 2;11:E170. doi: 10.5888/pcd11.140183. Prev Chronic Dis. 2014. PMID: 25275807 Free PMC article.
-
Comparison of Program Resources Required for Colonoscopy and Fecal Screening: Findings From 5 Years of the Colorectal Cancer Control Program.Prev Chronic Dis. 2019 Apr 25;16:E50. doi: 10.5888/pcd16.180338. Prev Chronic Dis. 2019. PMID: 31022371 Free PMC article.
-
Adherence to colorectal cancer screening: a randomized clinical trial of competing strategies.Arch Intern Med. 2012 Apr 9;172(7):575-82. doi: 10.1001/archinternmed.2012.332. Arch Intern Med. 2012. PMID: 22493463 Free PMC article. Clinical Trial.
-
Colorectal cancer screening.J Intern Med. 2011 Aug;270(2):87-98. doi: 10.1111/j.1365-2796.2011.02399.x. Epub 2011 Jun 9. J Intern Med. 2011. PMID: 21575082 Review.
-
Evidence for colorectal cancer screening.Best Pract Res Clin Gastroenterol. 2010 Aug;24(4):417-25. doi: 10.1016/j.bpg.2010.06.005. Best Pract Res Clin Gastroenterol. 2010. PMID: 20833346 Review.
Cited by
-
Estimating the long-term health impact and program cost-effectiveness of providing direct screening services to low-income, medically underserved patients through the Colorectal Cancer Control Program (CRCCP).Cancer Causes Control. 2025 May 29:10.1007/s10552-025-01994-5. doi: 10.1007/s10552-025-01994-5. Online ahead of print. Cancer Causes Control. 2025. PMID: 40439982 Free PMC article.
-
The 2020 US cancer screening deficit and the timing of adults' most recent screen: a population-based cross-sectional study.Fam Med Community Health. 2023 Sep;11(3):e001893. doi: 10.1136/fmch-2022-001893. Fam Med Community Health. 2023. PMID: 37730268 Free PMC article.
-
Value of faecal exfoliated cells in colorectal tumour screening using SDC2 methylation test.Ann Med. 2023;55(2):2261111. doi: 10.1080/07853890.2023.2261111. Epub 2023 Oct 2. Ann Med. 2023. PMID: 37783044 Free PMC article.
-
Individual and geospatial factors associated with receipt of colorectal cancer screening: a state-wide mixed-level analysis.Fam Med Community Health. 2024 Jul 18;12(Suppl 2):e002983. doi: 10.1136/fmch-2024-002983. Fam Med Community Health. 2024. PMID: 39029926 Free PMC article.
References
-
- American Cancer Society (2017). “Colorectal Cancer Fact & Figures 2017–2019,” Atlanta: American Cancer Society.
-
- Bertrand Marianne, Duflo Esther, and Mullainathan Sendhil (2004). “How Much Should We Trust Difference-In-Differences Estimates?” Quarterly Journal of Economics, 119(1): 249–275.
-
- Bibbins-Domingo Kirsten, Grossman David C., Curry Susan J., Davidson Karina W., Epling John W. Jr., Garcia Francisco A. R., Gillman Matthew W., Harper Diane M., Kemper Alex R., Krist Alex H., Kurth Ann E., Landefeld C. Seth, Mangione Carol M., Owens Douglas K., Phillips William R., Phipps Maureen G., Pignone Michael P., and Siu Albert L. (2016). “Screening for Colorectal Cancer: US Preventive Services Task Force Recommendation Statement,” JAMA, 315(23): 2564–2575. - PubMed
-
- Bitler Marianne P. and Carpenter Christopher S. (2019). “Effects of Direct Care Provision to the Uninsured: Evidence from Federal Breast and Cervical Cancer Programs,” NBER Working Paper #26140.
-
- Burnett-Hartman Andrea N., Mehta Shivan J., Zheng Yinge, Ghai Nirupa R., McLerran Dale, Chubak Jessica, Quinn Virginia P., Skinner Celette Sugg, Corley Douglas A., Inadomi John, and Doubeni Chyke A., on behalf of the PROSP Consortium (2016). “Racial/Ethnic Disparities in Colorectal Cancer Screening Across Healthcare Systems,” American Journal of Preventive Medicine, 51(4): e107–e115. - PMC - PubMed
