. 2021 Aug 3:10:e68917.
doi: 10.7554/eLife.68917.

Within-host evolutionary dynamics of seasonal and pandemic human influenza A viruses in young children

Affiliations

Within-host evolutionary dynamics of seasonal and pandemic human influenza A viruses in young children

Alvin X Han et al. Elife. .

Abstract

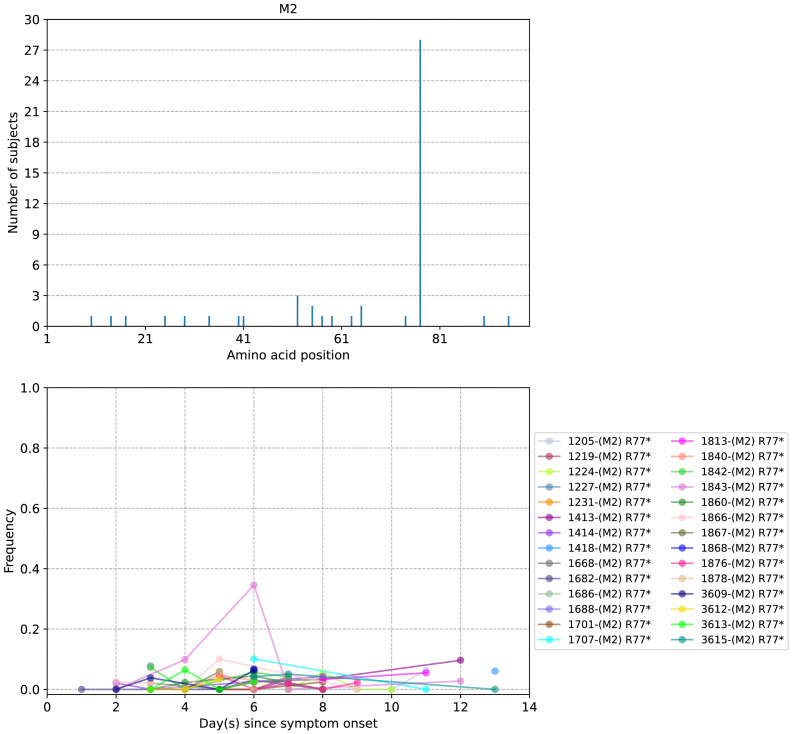
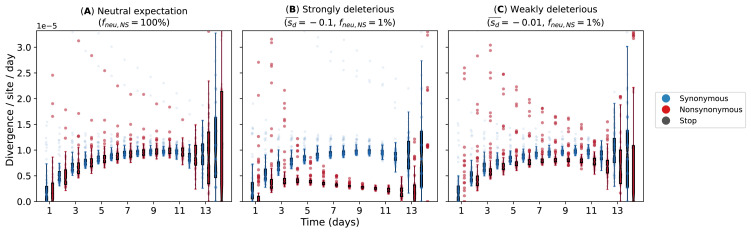
The evolution of influenza viruses is fundamentally shaped by within-host processes. However, the within-host evolutionary dynamics of influenza viruses remain incompletely understood, in part because most studies have focused on infections in healthy adults based on single timepoint data. Here, we analyzed the within-host evolution of 82 longitudinally sampled individuals, mostly young children, infected with A/H1N1pdm09 or A/H3N2 viruses between 2007 and 2009. For A/H1N1pdm09 infections during the 2009 pandemic, nonsynonymous minority variants were more prevalent than synonymous ones. For A/H3N2 viruses in young children, early infection was dominated by purifying selection. As these infections progressed, nonsynonymous variants typically increased in frequency even when within-host virus titers decreased. Unlike the short-lived infections of adults where de novo within-host variants are rare, longer infections in young children allow for the maintenance of virus diversity via mutation-selection balance creating potentially important opportunities for within-host virus evolution.

Keywords: evolutionary biology; evolutionary dynamics; human; infectious disease; influenza virus; microbiology; mutation-selection balance; virus.


Conflict of interest statement

AH, ZF, MW, RV, NT, TL, TP, DD, TT, MH, TN, QL, TL, TH, KC, PP, VN, MN, VN, TD, TT, HW, PH, AF, Hv, DE, Md, CR No competing interests declared

Figures

Figure 1.
Figure 1.. Genetic diversity of within-host influenza A virus populations.
Box plots summarizing the number of intra-host single-nucleotide variants (iSNVs; median, interquartile range [IQR], and whiskers extending within median ±1.5 × IQR) identified in samples with adequate breadth of coverage across the whole influenza virus genome in (A) seasonal A/H3N2 and (B) pandemic A/H1N1pdm09 virus samples, stratified by day(s) since symptom onset or qPCR cycle threshold (Ct) values. (C, D) Ct values as a function of day(s) since symptom onset for A/H3N2 viruses (C) and A/H1N1pdm09 viruses (D).
Figure 1—figure supplement 1.
Figure 1—figure supplement 1.. Sequence coverage across all influenza gene segments and samples.
Black line plots the mean coverage for a sliding window of 50 base pairs (stepsize = 25 base pairs). The interquartile range is shaded in dark pink while the full range is denoted in light pink. (A) H3N2; (B) H1N1pdm09.
Figure 1—figure supplement 2.
Figure 1—figure supplement 2.. Frequencies of nucleotide variants found in A/H3N2 viral reads sequenced from overlapping amplicons.
Each circle represents a nucleotide variant site (with frequency estimated between 0.02 and 0.98) found in reads attributed to at least two different amplicons (at least 100× coverage for each amplicon) and is colored by the cycle threshold (CT) value of the sample from which the variant was found. Scatter plot on the left panel compares the variant frequencies between any two amplicons while the plot on the right panel compares the variant frequencies of each amplicon to that when combining across all overlapping amplicons (i.e., the frequencies used for main analyses). The dashed line is the one-to-one expected value.
Figure 1—figure supplement 3.
Figure 1—figure supplement 3.. Maximum-likelihood phylogeny of putative majority (consensus) and minority whole-genome sequences (by concatenating all eight gene segments) of A/H3N2 virus samples.
Tip names are given in the format: ‘Patient ID_Days since symptom onset_putative consensus or minority sequence.’ The tree is rooted to the A/Brisbane/10/2007 virus (H3N2_Bris07; EPI_ISL_103644). Subject 1673 (green tips) and the D8 sample of subject 1878 (pink tips) might have arose from mixed infections or were contaminated by other strains.
Figure 1—figure supplement 4.
Figure 1—figure supplement 4.. Maximum-likelihood phylogeny of putative majority (consensus) and minority whole-genome sequences (by concatenating all eight gene segments) of H1N1pdm09 virus samples.
Tip names are given in the format: ‘Patient ID_Days since symptom onset_putative consensus or minority sequence.’ The tree is rooted to the A/California/04/2009 virus (H1N1pdm09_Cali09; EPI_ISL_376192). Encircled tips denote the consensus majority sequence of the sample.
Figure 1—figure supplement 5.
Figure 1—figure supplement 5.. Pearson’s correlation between the first day of oseltamivir treatment administered to patients and the last day on which viral samples with cycle threshold (CT) values ≤35 were collected.
Time is measured by number of days since symptom onset. Each point represents a patient included in this study who was treated with oseltamivir (Supplementary file 4).
Figure 2.
Figure 2.. Box plots (median, interquartile range [IQR], and whiskers extending within median ±1.5 × IQR) summarizing the empirical within-host evolutionary rates of (A) seasonal A/H3N2 viruses and (B) pandemic A/H1N1pdm09 viruses.
Top panel shows the evolutionary rate of individual gene segments over all timepoints (rg) while the bottom panel depicts the genome-wide evolutionary rate (rt) for each day since symptom onset. All rates are stratified by substitution type (synonymous – blue; nonsynonymous – red; gray – stop codon). Wilcoxon signed-rank tests were performed to assess if the paired synonymous and nonsynonymous evolutionary rates are significantly distinct per individual gene segment or timepoint (annotated with * if p<0.05). This was done for all sets of nonsynonymous and synonymous rate pairs except for those computed per day since symptom onset for A/H1N1pdm09 viruses due to the low number of data points available (median number of A/H1N1pdm09 virus samples collected per day since symptom onset = 2). Note that the scales of the y axes differ between (A) and (B) to better show rate trends.
Figure 2—figure supplement 1.
Figure 2—figure supplement 1.. Box plots (median, interquartile range [IQR], and whiskers extending within median ±1.5 × IQR) summarizing the empirical within-host evolutionary rates (rg,t) of different H3N2 viral gene segments.
All rates are stratified by substitution type (synonymous – blue; nonsynonymous – red; stop codon – gray). Wilcoxon signed-rank tests were performed to assess if the paired synonymous and nonsynonymous evolutionary rates are significantly distinct per timepoint (annotated with * if p<0.05).
Figure 2—figure supplement 2.
Figure 2—figure supplement 2.. Box plots (median, interquartile range [IQR], and whiskers extending within median ±1.5 × IQR) summarizing the empirical within-host evolutionary rates (rg,t) of different H1N1pdm09 viral gene segments.
All rates are stratified by substitution type (synonymous – blue; nonsynonymous – red; stop codon – gray). Wilcoxon signed-rank test was not performed here due to the low number of samples collected (i.e., median number of samples per day post-illness onset = 2).
Figure 2—figure supplement 3.
Figure 2—figure supplement 3.. Linear regression of within-host synonymous and nonsynonymous evolutionary rates of within-host A/H3N2 virus samples.
Each plotted line is the linearly regressed line to the evolutionary rates computed for each A/H3N2-infected individual. Based on our findings, we expect that synonymous rates correlate negatively with time while nonsynonymous rates have a positive temporal correlation. Colored lines represent those that fall within this expectation while dashed black lines represent those that did not.
Figure 2—figure supplement 4.
Figure 2—figure supplement 4.. Box plots (median, interquartile range [IQR], and whiskers extending within median ±1.5 × IQR) summarizing the empirical daily within-host evolutionary rates of seasonal A/H3N2 viruses.
Variants that could potentially be PCR artifacts were removed (i.e., those found under the 75th percentile [6.3%] of frequency range of variants located in overlapping amplicons but were only detected in one amplicon, see Figure 1—figure supplement 2). All rates are stratified by substitution type (synonymous – blue; nonsynonymous – red; gray – stop codon). Wilcoxon signed-rank tests were performed to assess if the paired synonymous and nonsynonymous evolutionary rates are significantly distinct per individual gene segment or timepoint (annotated with * if p<0.05). This was done for all sets of nonsynonymous and synonymous rate pairs computed between days 3 and 9 since symptom onset.
Figure 3.
Figure 3.. Histogram of the mean number of minority intra-host single-nucleotide variants (iSNVs) identified per sample across all.
(A) A/H3N2 and (B) A/H1N1pdm09 virus specimens, sorted by frequency bins of 5% and substitution type (synonymous – blue; nonsynonymous – red; stop-codon – gray).
Figure 3—figure supplement 1.
Figure 3—figure supplement 1.. Histogram of the mean number of minority intra-host single-nucleotide variants (iSNVs) identified per sample across all H3N2 viral gene segments across all samples sorted by frequency bins of 5% and substitution type (synonymous – blue; nonsynonymous – red; gray – stop codon).
Figure 3—figure supplement 2.
Figure 3—figure supplement 2.. Histogram of the mean number of minority intra-host single-nucleotide variants (iSNVs) identified across all H1N1pdm09 viral gene segments across all samples sorted by frequency bins of 5% and substitution type (synonymous – blue; nonsynonymous – red; stop-codon – gray).
Figure 4.
Figure 4.. Intra-host single-nucleotide variants in within-host IAV populations.
(A) Breakdown of intra-host single-nucleotide variants (iSNVs) identified in seasonal A/H3N2 virus samples. The top panels plot the nucleotide positions where iSNVs were found in at least two subjects. The bottom panels show the frequencies at which iSNVs were identified. For sites with iSNVs that were found in two or more subjects, the interquartile ranges of variant frequencies are plotted as vertical lines and the median frequencies are marked with a dash. If the iSNV was only found in one subject, its corresponding frequency is plotted as a circle. All iSNVs are stratified to either synonymous (blue), nonsynonymous (red), or stop codon (gray) variants. Only the nonsynonymous variants are plotted if both types of variants are found in a site. Positions of antigenic sites of the hemagglutinin (HA)_ gene segment (Igarashi et al., 2010) are marked in green on the top panels. (B) Box plots of the frequencies of synonymous and nonsynonymous variants between antigenic and non-antigenic sites of seasonal A/H3N2 HA gene segment. (C) Similar plots to (A) for iSNVs found in pandemic A/H1N1pdm09 virus samples. (D) Similar plots to (B) for HA iSNVs identified in the pandemic A/H1N1pdm09 virus samples.
Figure 4—figure supplement 1.
Figure 4—figure supplement 1.. Plots of intra-host hemagglutinin (HA) amino acid variants in A/H3N2-infected individuals.
Top panel shows the number of subjects where nonsynonymous variants were found in the respective protein site. Different canonical antigenic sites of the HA protein are colored (HA numbering based on H3 numbering without signal peptide). Bottom panel plots selected as well as parallel amino acid mutations found in multiple patients against days since illness onset. Filled circles represent days on which samples were collected and sequenced. The variant frequencies of all putative antigenic sites are also plotted.
Figure 4—figure supplement 2.
Figure 4—figure supplement 2.. Plots of intra-host neuraminidase (NA) amino acid variants in A/H3N2-infected individuals.
Top panel shows the number of subjects where nonsynonymous variants were found in the respective protein site. Bottom panel plots selected as well as parallel amino acid mutations found in multiple patients against days since illness onset. Filled circles represent days on which samples were collected and sequenced. The first day of oseltamivir treatment for individuals with resistance mutations is annotated below the x-axis.
Figure 4—figure supplement 3.
Figure 4—figure supplement 3.. Plots of intra-host nucleoprotein (NP) amino acid variants in A/H3N2-infected individuals.
Top panel shows the number of subjects where nonsynonymous variants were found in the respective protein site. Bottom panel plots selected as well as parallel amino acid mutations found in multiple patients against days since illness onset. Filled circles represent days on which samples were collected and sequenced.
Figure 4—figure supplement 4.
Figure 4—figure supplement 4.. Plots of M2 protein intra-host amino acid variants in A/H3N2-infected individuals.
Top panel shows the number of subjects where nonsynonymous variants were found in the respective protein site. Bottom panel plots selected as well as parallel amino acid mutations found in multiple patients against days since illness onset. Filled circles represent days on which samples were collected and sequenced.
Figure 4—figure supplement 5.
Figure 4—figure supplement 5.. Plots of hemagglutinin (HA) intra-host amino acid variants in A/H1N1pdm09-infected individuals.
Top panel shows the number of subjects where nonsynonymous variants were found in the respective protein site. Different canonical antigenic sites of the HA protein are colored (HA numbering based on H3 numbering without signal peptide). Bottom panel plots selected as well as parallel amino acid mutations found in multiple patients against days since illness onset. Filled circles represent days on which samples were collected and sequenced. The variant frequencies of all putative antigenic sites are also plotted. The frequencies of the five putative HA antigenic variants of A/H1N1pdm09 viruses are marked by arrows for better clarity.
Figure 4—figure supplement 6.
Figure 4—figure supplement 6.. Plots of neuraminidase (NA) intra-host amino acid variants in A/H1N1pdm09-infected individuals.
Top panel shows the number of subjects where nonsynonymous variants were found in the respective protein site. Bottom panel plots selected as well as parallel amino acid mutations found in multiple patients against days since illness onset. Filled circles represent days on which samples were collected and sequenced. The first day of oseltamivir treatment for individuals with resistance mutations is annotated below the x-axis.
Figure 4—figure supplement 7.
Figure 4—figure supplement 7.. Plots of M2 protein intra-host amino acid variants in A/H1N1pdm09-infected individuals.
Top panel shows the number of subjects where nonsynonymous variants were found in the respective protein site. Bottom panel plots selected as well as parallel amino acid mutations found in multiple patients against days since illness onset. Filled circles represent days on which samples were collected and sequenced.
Figure 4—figure supplement 8.
Figure 4—figure supplement 8.. Frequency distributions of intra-host single-nucleotide variants (iSNVs) below the 2% variant calling threshold found in nucleotide positions NP-1150 and M-917 that encode for amino acid sites NP-384 and M2-77, respectively.
All A/H3N2 virus samples collected from all patients with site coverage above the 100× are included. The distributions were compared to that of neighboring sites, ±10 nucleotide positions adjacent to NP1150 and M-917.
Figure 4—figure supplement 9.
Figure 4—figure supplement 9.. Plots of within-host recurring A/H3N2 amino acid variants NP-G384R and M2-R77* based on variant calls and frequencies after remapping sample reads to their respective sample consensus sequence.
Figure 5.
Figure 5.. The trimeric and monomeric crystal structures of nucleoprotein (PDB: 3ZDP) (Chenavas et al., 2013) of influenza A viruses.
Amino acid sites with potentially linked epistatic amino acid variants as tabulated in Table 1 are separately colored, with their corresponding positions annotated on the monomeric structure.
Figure 6.
Figure 6.. Evolutionary rates computed from forward-time Monte Carlo within-host simulations for different mean deleterious effects (sd-) of nonsynonymous mutations.
We assumed that synonymous mutations are neutral for all simulations. (A) Neutral expectation where all nonsynonymous mutations are neutral (fneu,NS=100%). We tested our hypotheses where the majority of nonsynonymous mutations are non-neutral (fneu,NS=1%) and they are either (B) strongly (sd-=-0.1) or (C) weakly (sd-=-0.01) deleterious.
Figure 6—figure supplement 1.
Figure 6—figure supplement 1.. Number of virions (N) against replicative generation (t) based on a target cell-limited within-host model.
Blue line with markers denotes the population size computed from the model. When N>107 virions, we assumed that N remained constant at 107 (pink dashed line) to reduce computational costs of forward-time simulations.
Appendix 1—figure 1.
Appendix 1—figure 1.. Genetic diversity of within-host influenza A virus populations as estimated by nucleotide diversity π statistic.
Box plots summarizing the π statistic (intra-host single-nucleotide variants [iSNVs]; median, interquartile range [IQR], and whiskers extending within median ±1.5 × IQR) computed for samples with adequate breadth of coverage across the whole influenza genome. (A) Seasonal A/H3N2 and (B) pandemic A/H1N1pdm09 viruses. All box plots are either stratified by day(s) since symptom onset or qPCR cycle threshold (Ct) values.
Appendix 1—figure 2.
Appendix 1—figure 2.. A/H1N1pdm09 virus household transmission pairs.
(A) Schematic of A/H1N1pdm09 virus household transmission pairs identified by epidemiological linkage and plotted based on timing of sample collection (left panel) Intra-host single-nucleotide variant (iSNV) frequencies found in the donors and recipients of the five transmission pairs (right panel). (B) Violin plots of L1-norm pairwise genetic distance per site between different A/H1N1pdm09 virus sample pairs (each circle = 1 pair of virus samples). Transmission pairs are those represented in Figure 5A. Longitudinal pairs are made up of sample pairs collected from the same individual on the first and any other later timepoints on which the patient was sampled. These pairs are stratified by whether they were collected from households located in the same community (i.e., household) or combined with the rest of the analyzed A/H1N1pdm09 virus samples collected from hospitals (i.e., all). For the same aforementioned categories, we also plotted the distribution of L1-norm distances for pairs of viruses collected from different individuals. All circles are colored by the difference in days between which the sample pairs were collected (ΔT). All p-values reported are based on Mann–Whitney U tests, which were used to determine if the L1-norm genetic distance distributions of the two categories marked by the ends of the horizontal line above are statistically distinct.

References

    1. Andino R, Domingo E. Viral quasispecies. Virology. 2015;479-480:46–51. doi: 10.1016/j.virol.2015.03.022. - DOI - PMC - PubMed
    1. Ashenberg O, Gong LI, Bloom JD. Mutational effects on stability are largely conserved during protein evolution. PNAS. 2013;110:21071–21076. doi: 10.1073/pnas.1314781111. - DOI - PMC - PubMed
    1. Berkhoff EG, Boon AC, Nieuwkoop NJ, Fouchier RA, Sintnicolaas K, Osterhaus AD, Rimmelzwaan GF. A mutation in the HLA-B*2705-restricted NP383-391 epitope affects the human influenza A virus-specific cytotoxic T-lymphocyte response in vitro. Journal of Virology. 2004;78:5216–5222. doi: 10.1128/jvi.78.10.5216-5222.2004. - DOI - PMC - PubMed
    1. Berkhoff EG, de Wit E, Geelhoed-Mieras MM, Boon AC, Symons J, Fouchier RA, Osterhaus AD, Rimmelzwaan GF. Functional constraints of influenza A virus epitopes limit escape from cytotoxic T lymphocytes. Journal of Virology. 2005;79:11239–11246. doi: 10.1128/JVI.79.17.11239-11246.2005. - DOI - PMC - PubMed
    1. Bolger AM, Lohse M, Usadel B. Trimmomatic: a flexible trimmer for illumina sequence data. Bioinformatics. 2014;30:2114–2120. doi: 10.1093/bioinformatics/btu170. - DOI - PMC - PubMed

Publication types