

Optical Coherence Tomography Angiography-Derived Flux As a Measure of Physiological Changes in Retinal Capillary Blood Flow
- PMID: 34342607
- PMCID: PMC8340668
- DOI: 10.1167/tvst.10.9.5
Optical Coherence Tomography Angiography-Derived Flux As a Measure of Physiological Changes in Retinal Capillary Blood Flow
Abstract
Purpose: To compare optical coherence tomography angiography (OCTA)-derived flux with conventional OCTA measures of retinal vascular density in assessment of physiological changes in retinal blood flow.
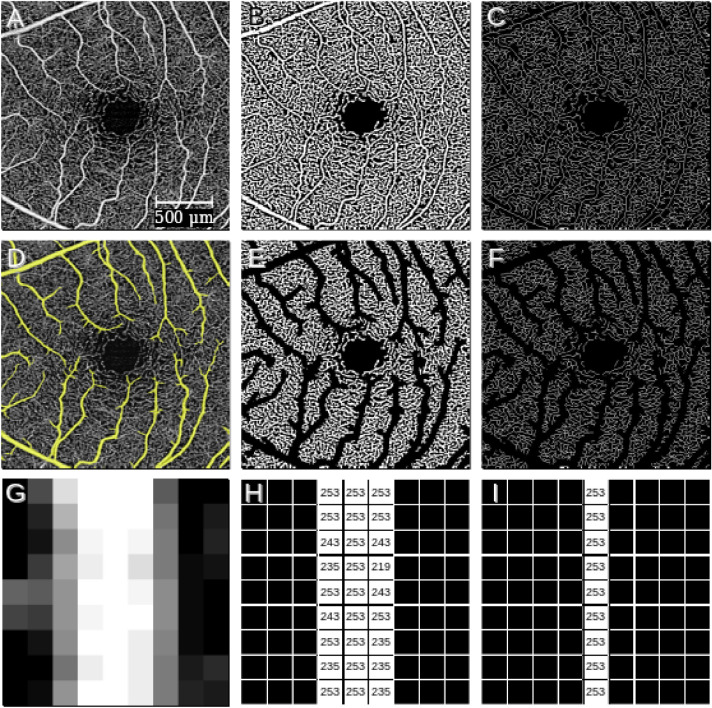
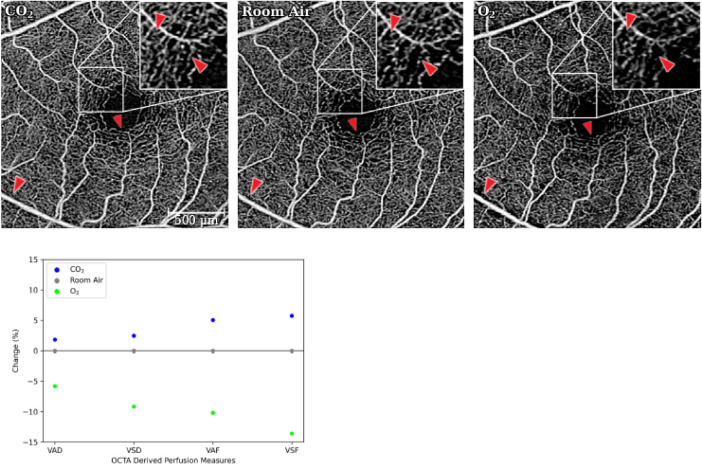
Methods: Healthy subjects were recruited, and 3 × 3-mm2 fovea-centered scans were acquired using commercially available swept-source OCTA (SS-OCTA) while participants were breathing room air, 100% O2, or 5% CO2. Retinal perfusion was quantified using vessel area density (VAD) and vessel skeleton density (VSD), as well as novel measures of retinal perfusion, vessel area flux (VAF) and vessel skeleton flux (VSF). Flux is proportional to the number of red blood cells moving through a vessel segment per unit time. The percentage change in each measure was compared between the O2 and CO2 gas conditions for images of all vessels (arterioles, venules, and capillaries) and capillary-only images. Statistical significance was determined using paired t-tests and a linear mixed-effects model.
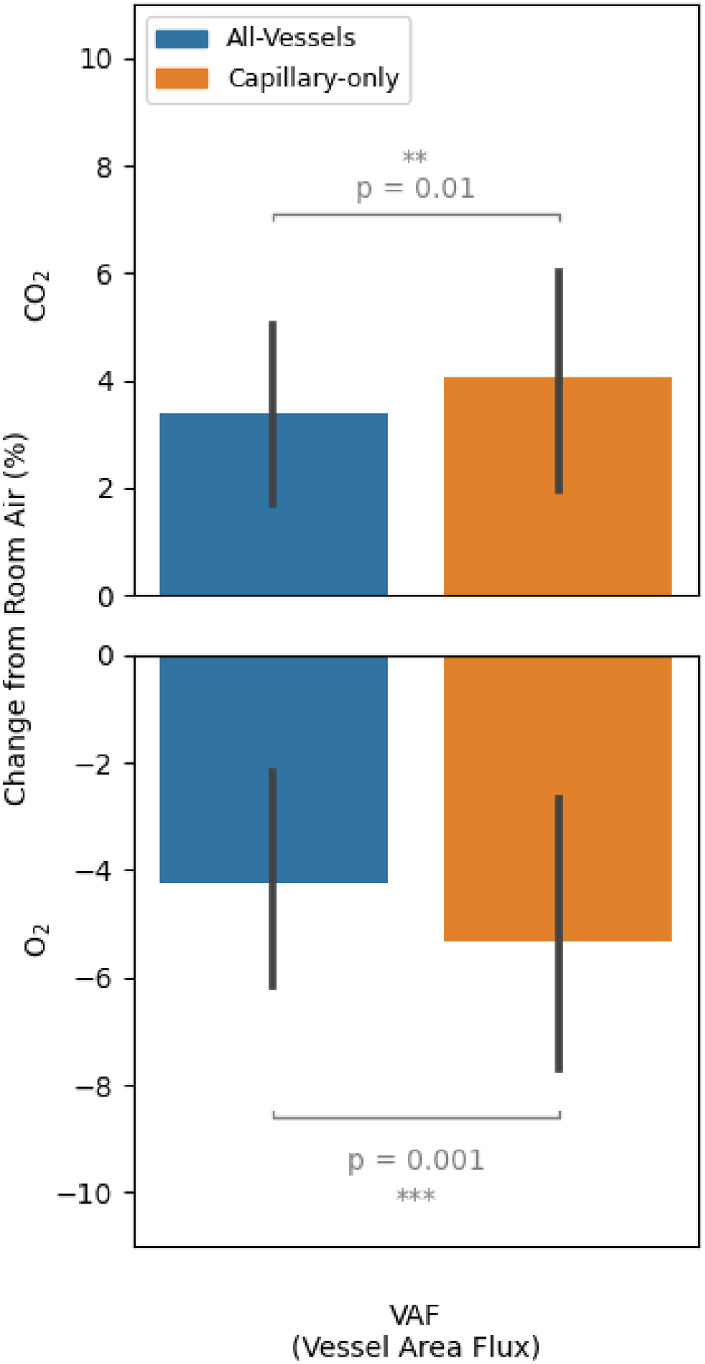
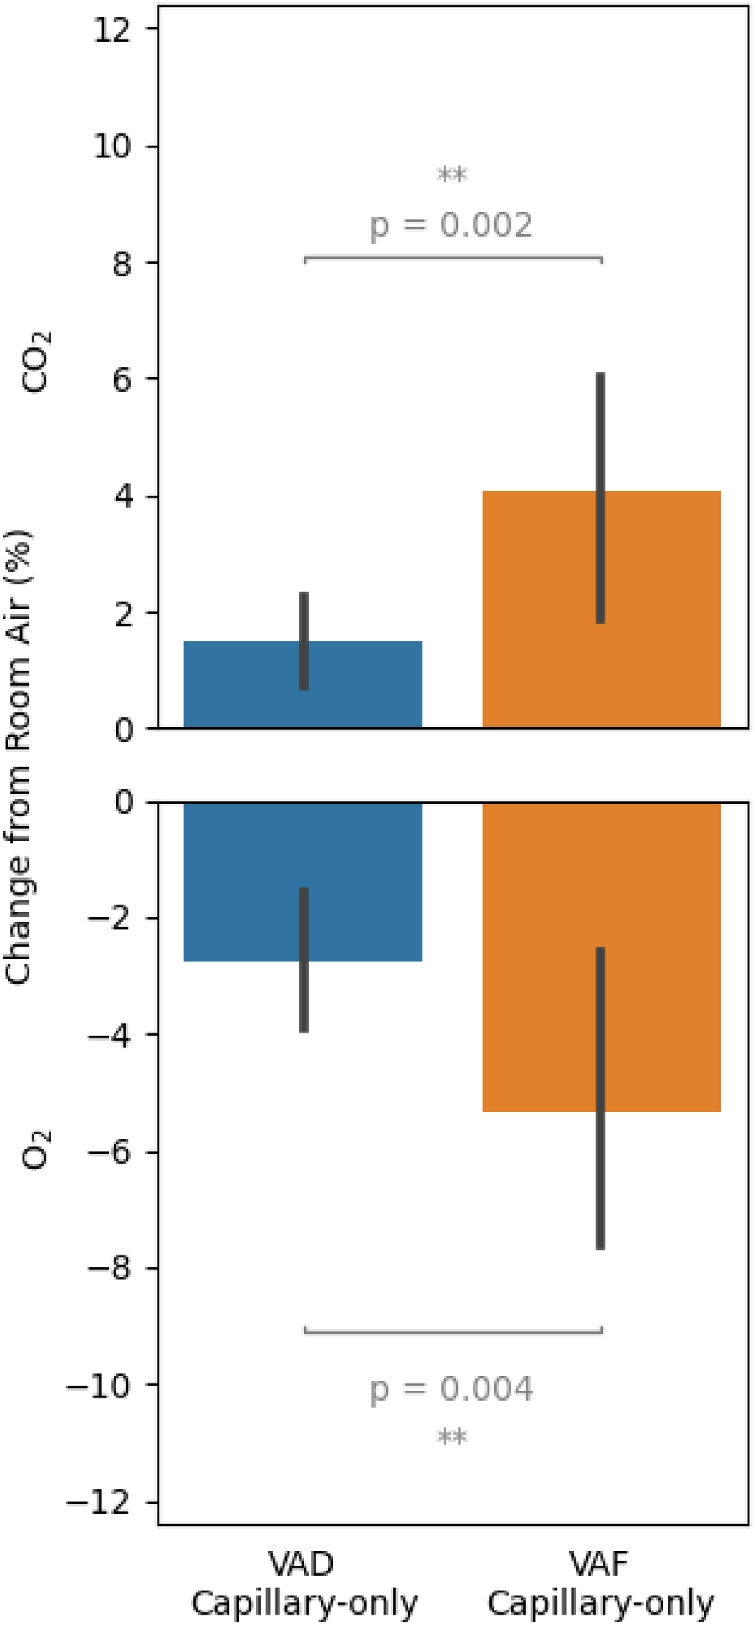
Results: Eighty-four OCTA scans from 29 subjects were included (age, 45.9 ± 19.5 years; 14 male, 48.3%). In capillary-only images, the change under the CO2 condition was 168% greater in VAF than in VAD (P = 0.002) and 124% greater in VSF than in VSD (P = 0.004). Similarly, under the O2 condition, the change was 94% greater in VAF than in VAD (P = 0.004) and 57% greater in VSF than in VSD (P = 0.01). Flux measures showed significantly greater change in capillary-only images compared with all-vessels images.
Conclusions: OCTA-derived flux measures quantify physiological changes in retinal blood flow at the capillary level with a greater effect size than conventional vessel density measures.
Translational relevance: OCTA-derived flux is a useful measure of subclinical changes in retinal capillary perfusion.
Conflict of interest statement
Disclosure:
Figures
Similar articles
-
OCTA Derived Vessel Skeleton Density Versus Flux and Their Associations With Systemic Determinants of Health.Invest Ophthalmol Vis Sci. 2022 Feb 1;63(2):19. doi: 10.1167/iovs.63.2.19. Invest Ophthalmol Vis Sci. 2022. PMID: 35142788 Free PMC article.
-
Parafoveal Retinal Vessel Density Assessment by Optical Coherence Tomography Angiography in Healthy Eyes.Ophthalmic Surg Lasers Imaging Retina. 2018 Oct 15;49(10):S5-S17. doi: 10.3928/23258160-20180814-02. Ophthalmic Surg Lasers Imaging Retina. 2018. PMID: 30339262
-
Quantitative Analysis of Three Distinct Retinal Capillary Plexuses in Healthy Eyes Using Optical Coherence Tomography Angiography.Invest Ophthalmol Vis Sci. 2017 Oct 1;58(12):5548-5555. doi: 10.1167/iovs.17-22036. Invest Ophthalmol Vis Sci. 2017. PMID: 29075766
-
[Optical coherence tomography angiography and cardiovascular diseases. An overview of the current knowledge].Ophthalmologe. 2021 Nov;118(11):1119-1127. doi: 10.1007/s00347-021-01336-1. Epub 2021 Feb 22. Ophthalmologe. 2021. PMID: 33616736 Free PMC article. Review. German.
-
Emerging Applications of Optical Coherence Tomography Angiography (OCTA) in neurological research.Eye Vis (Lond). 2018 May 12;5:11. doi: 10.1186/s40662-018-0104-3. eCollection 2018. Eye Vis (Lond). 2018. PMID: 29796403 Free PMC article. Review.
Cited by
-
Differential artery-vein analysis improves the OCTA classification of diabetic retinopathy.Biomed Opt Express. 2024 May 22;15(6):3889-3899. doi: 10.1364/BOE.521657. eCollection 2024 Jun 1. Biomed Opt Express. 2024. PMID: 38867785 Free PMC article.
-
An open-source deep learning network AVA-Net for arterial-venous area segmentation in optical coherence tomography angiography.Commun Med (Lond). 2023 Apr 17;3(1):54. doi: 10.1038/s43856-023-00287-9. Commun Med (Lond). 2023. PMID: 37069396 Free PMC article.
-
Deep learning segmentation of periarterial and perivenous capillary-free zones in optical coherence tomography angiography.J Biomed Opt. 2025 May;30(5):056005. doi: 10.1117/1.JBO.30.5.056005. Epub 2025 May 8. J Biomed Opt. 2025. PMID: 40342523 Free PMC article.
-
Optical Coherence Tomography Angiography: Considerations Regarding Diagnostic Parameters.J Ophthalmic Vis Res. 2022 Aug 15;17(3):313-316. doi: 10.18502/jovr.v17i3.11567. eCollection 2022 Jul-Sep. J Ophthalmic Vis Res. 2022. PMID: 36160088 Free PMC article. No abstract available.
-
Angioarchitectural alterations in the retina and choroid in frontotemporal dementia.PLoS One. 2024 Nov 8;19(11):e0312118. doi: 10.1371/journal.pone.0312118. eCollection 2024. PLoS One. 2024. PMID: 39514529 Free PMC article.
References
-
- Matsunaga D, Yi J, Puliafito CA, Kashani AH.. OCT angiography in healthy human subjects. Ophthalmic Surg Lasers Imaging Retina. 2014; 45(6): 510–515. - PubMed
-
- Kashani AH, Lee SY, Moshfeghi A, Durbin MK, Puliafito CA.. Optical coherence tomography angiography of retinal venous occlusion. Retina. 2015; 35(11): 2323–2331. - PubMed
Publication types
MeSH terms
Grants and funding
LinkOut - more resources
Full Text Sources
Research Materials
