. 2021 Aug 3;19(8):e3001357.
doi: 10.1371/journal.pbio.3001357. eCollection 2021 Aug.

Mitochondrial RNase H1 activity regulates R-loop homeostasis to maintain genome integrity and enable early embryogenesis in Arabidopsis

Affiliations

Mitochondrial RNase H1 activity regulates R-loop homeostasis to maintain genome integrity and enable early embryogenesis in Arabidopsis

Lingling Cheng et al. PLoS Biol. .

Abstract

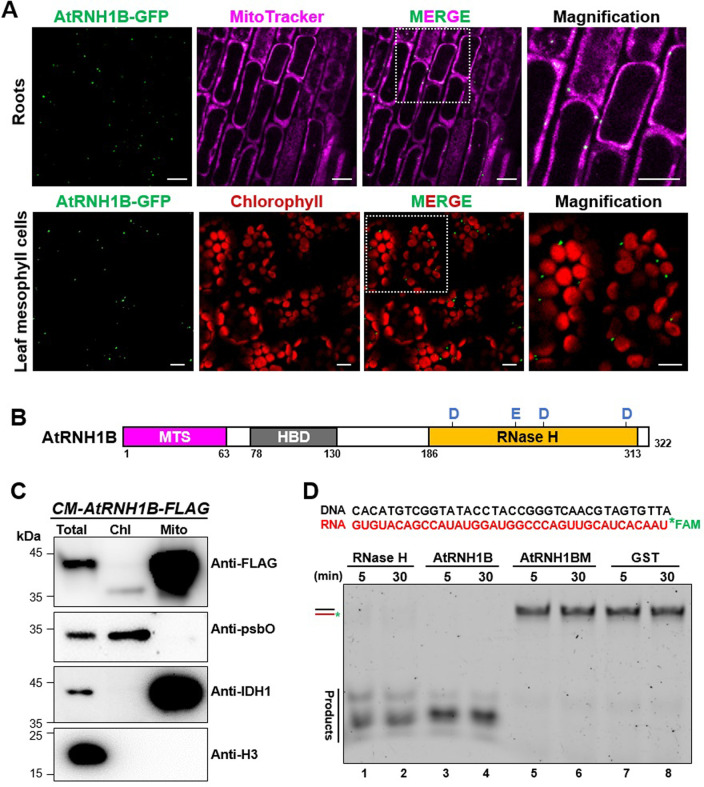
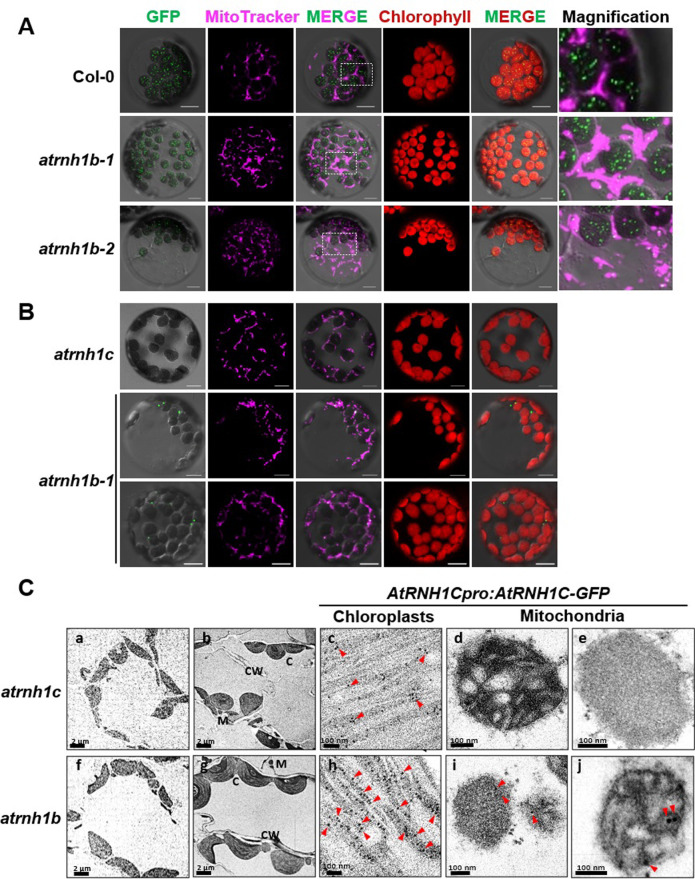
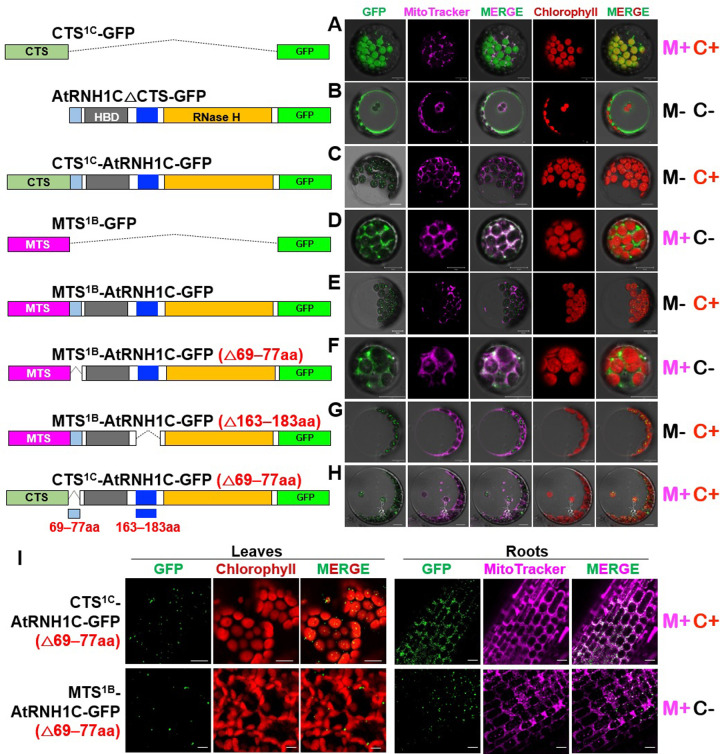
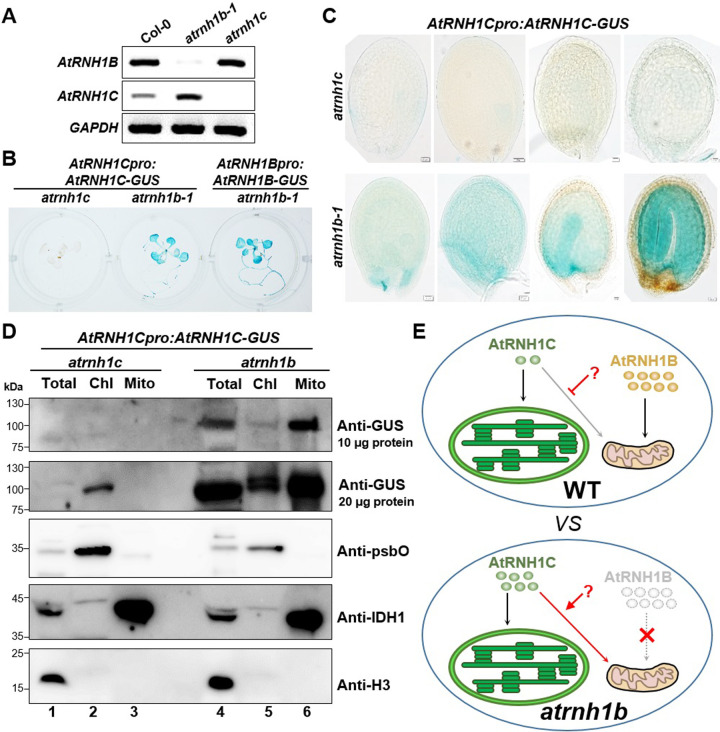
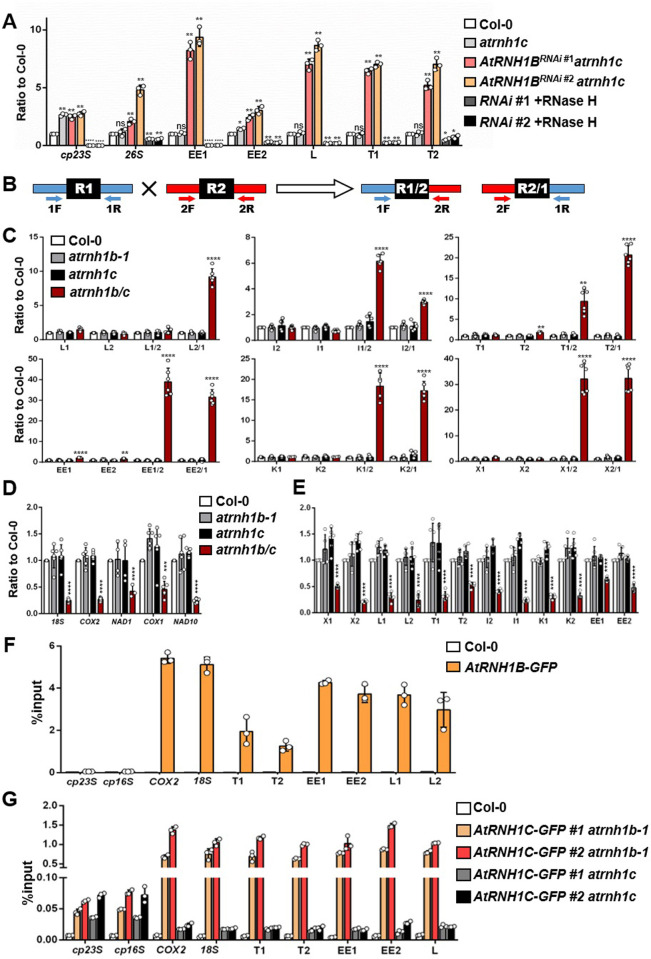
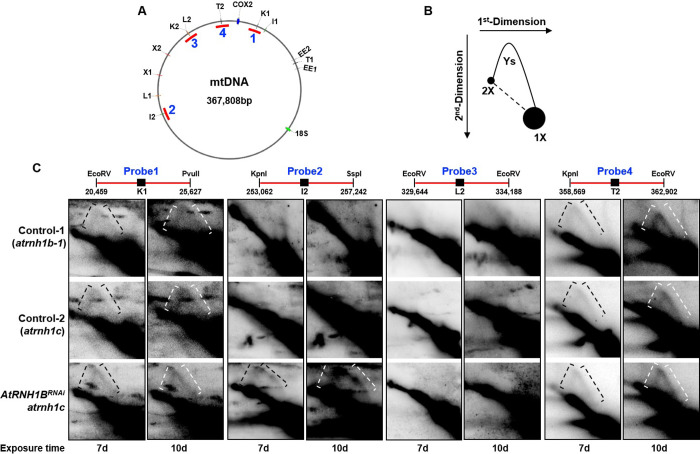
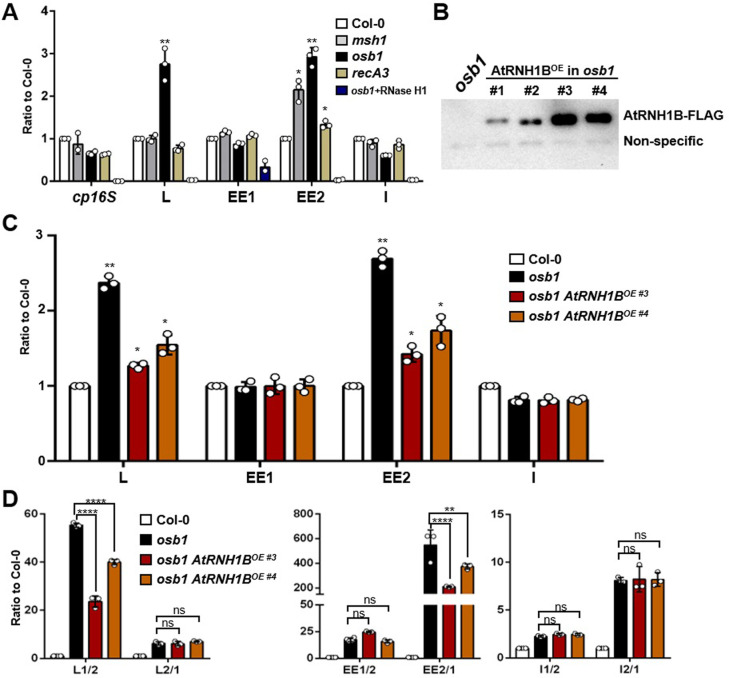
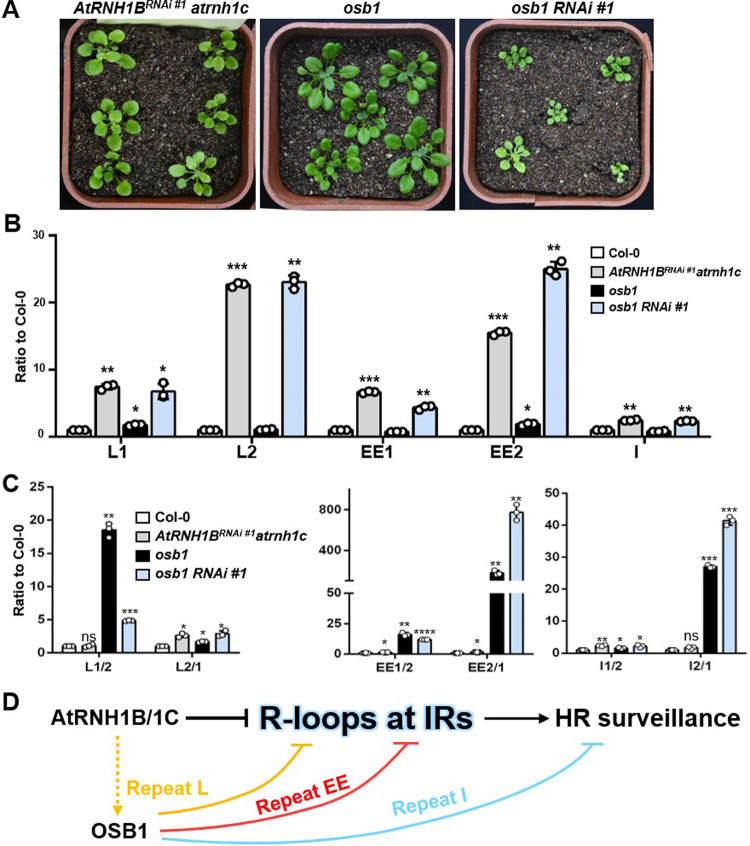
Plant mitochondrial genomes undergo frequent homologous recombination (HR). Ectopic HR activity is inhibited by the HR surveillance pathway, but the underlying regulatory mechanism is unclear. Here, we show that the mitochondrial RNase H1 AtRNH1B impairs the formation of RNA:DNA hybrids (R-loops) and participates in the HR surveillance pathway in Arabidopsis thaliana. AtRNH1B suppresses ectopic HR at intermediate-sized repeats (IRs) and thus maintains mitochondrial DNA (mtDNA) replication. The RNase H1 AtRNH1C is restricted to the chloroplast; however, when cells lack AtRNH1B, transport of chloroplast AtRNH1C into the mitochondria secures HR surveillance, thus ensuring the integrity of the mitochondrial genome and allowing embryogenesis to proceed. HR surveillance is further regulated by the single-stranded DNA-binding protein ORGANELLAR SINGLE-STRANDED DNA BINDING PROTEIN1 (OSB1), which decreases the formation of R-loops. This study uncovers a facultative dual targeting mechanism between organelles and sheds light on the roles of RNase H1 in organellar genome maintenance and embryogenesis.


Conflict of interest statement

The authors have declared that no competing interests exist.

Figures

Fig 1
Fig 1. Arabidopsis AtRNH1B is a mitochondrial RNase H1 protein.
(A) Confocal microscopy of roots (upper) and leaves (bottom) of AtRNH1Bpro:AtRNH1B-GFP atrnh1b transgenic plants. Green = GFP, magenta = MitoTracker, and red = chlorophyll. White boxes indicate the regions magnified on the right. Scale bars, 10 μm. (B) AtRNH1B protein structure. HBD, hybrid binding domain; MTS, mitochondrial targeting signal; RNase H, catalytic domain (containing 4 conserved active sites: D191, E231, D255, and D305). D, Asp; E, Glu. (C) Characterize the localization of AtRNH1B protein by immunoblot. Intact chloroplasts and mitochondria were isolated from 3-week-old CM-AtRNH1B-FLAG transgenic plants. Anti-FLAG monoclonal antibody was used to detect the AtRNH1B-FLAG, and polyclonal antibodies anti-psbO, anti-IDH1, and anti-H3 were used to indicate chloroplast, mitochondria, and total protein fractions, respectively. Chl, proteins from isolated chloroplasts; Mito, proteins from isolated mitochondria; Total, total proteins from leaves. (D) RNase H activity of AtRNH1B and AtRNH1BM. The RNA:DNA hybrid substrate with FAM-labeled RNA (100 nM) was incubated with commercial RNase H and 0.55 μg purified GST-AtRNH1B, 0.55 μg GST-AtRNH1BM, and 2.8 μg GST protein for 5 minutes and 30 minutes. The data underlying this figure can be found in S1 Raw Images. GFP, green fluorescent protein; GST, glutathione-S-transferase; H3, histone 3; IDH1, isocitrate dehydrogenase 1; psbO, photosystem II subunit O.
Fig 2
Fig 2. Expression analysis of AtRNH1B in Arabidopsis.
GUS staining shows the expression pattern of AtRNH1B in AtRNH1Bpro:AtRNH1B-GUS atrnh1b-1 transgenic plants in different tissues and developmental stages. (A) 7-, 14-, and 21-day-old seedlings. Scale bars, 200 μm. (B) Open flowers and buds (left) and pollen (right). Scale bars are indicated. (C) Seeds at different developmental stages (unfertilized ovule, fertilized ovule, globular, heart, torpedo, and mature). Scale bars, 20 μm. GUS, β-glucuronidase enzyme.
Fig 3
Fig 3. Organellar RNase H1 ensures successful early embryogenesis.
(A) Dissected siliques of wild-type Col-0 and atrnh1b 1c+/− plants and atrnh1b 1c+/− plants complemented with AtRNH1Bpro:AtRNH1B-GFP or AtRNH1Bpro:AtRNH1BΔMTS-GFP (AtRNH1B lacking the MTS). Asterisks indicate lethal seeds. Scale bars, 200 μm. (B) Statistical analysis of aborted seeds in the siliques shown in (A). compl. and Δcompl. refer to AtRNH1Bpro:AtRNH1B-GFP atrnh1b 1c+/− and AtRNH1Bpro:AtRNH1BΔMTS-GFP atrnh1b 1c+/−, respectively. Data are from 10 repeats (silique examinations) and 5 siliques were examined each time. The total aborted seeds/population sizes of the 4 genotypes are 13/513, 382/1,458, 8/482 and 408/1,628 seeds, respectively. Data are mean values ± SD; circles show the original data. Significance test was performed using 1-way ANOVA, and ns indicates no significance. (C) Seed clearing to observe normal (upper) and abnormal (lower) embryos from siliques of atrnh1b 1c+/− plants. The embryos are in the globular, heart, torpedo, and mature stages, respectively. Scale bars, 20 μm. (D) Dissected silique of atrnh1b 1c/+ in heart stage. Asterisks indicate white abnormal seeds. Scale bars, 200 μm. (E–K) Transmission electron microscopy of seeds from atrnh1b-1 plants (E–F) and abnormal seeds from atrnh1b 1c+/− plants (G–K). White arrowheads indicate internal cristae membranes. The data underlying this figure can be found in S1 Data. ANOVA, analysis of variance; MTS, mitochondrial targeting signal; SD, standard deviation.
Fig 4
Fig 4. AtRNH1C can localize to mitochondria in the absence of AtRNH1B.
(A) Col-0, atrnh1b-1, and atrnh1b-2 protoplasts were transformed with AtRNH1C-GFP driven under 35S promoter. Green = GFP, magenta = MitoTracker, and red = chlorophyll. White boxes indicate the regions magnified on the right. Scale bars, 10 μm. (B) Protoplasts from the leaves of AtRNH1Cpro:AtRNH1C-GFP transgenic plants in the atrnh1c and atrnh1b-1 backgrounds. (C) Immunogold labeling detects dual localization event of AtRNH1C in the absence of AtRNH1B. (a and f) Preimmune controls showed no gold labeling in the cells. (b–e) AtRNH1C-GFP signal appeared to be clustered in chloroplast exclusively in AtRNH1Cpro:AtRNH1C-GFP atrnh1c transgenic plants. (g–j) AtRNH1C-GFP signal can be detected in both chloroplast and mitochondria in AtRNH1Cpro:AtRNH1C-GFP atrnh1b transgenic plants. C, chloroplast; CW, cell walll; GFP, green fluorescent protein; M, mitochondrion.
Fig 5
Fig 5. The mitochondrial localization of AtRNH1C is inhibited by aa 69–77 of this protein.
Schematic drawing the protein structures for expression in (A–H) were shown in the left. (A-H) Col-0 protoplasts were transformed with different vectors expressing proteins. (I) Subcellular localization of GFP-fusion proteins of CTS1C-AtRNH1C (△69–77aa), MTS1B-AtRNH1C (△69–77aa) in Col-0 transgenic plants. Green = GFP, magenta = MitoTracker, and red = chlorophyll. Scale bars, 10 μm. The GFP and MitoTracker images were merged to show the colocalization of the GFP signal and mitochondria. The summary of the results was listed in the right. “M+” indicates mitochondrial localization; “M−” indicates no mitochondrial localization; “C+” indicates chloroplast localization; and “C−” indicates no chloroplast localization. 1C, AtRNH1C; 1B, AtRNH1B; aa, amino acid; CTS, chloroplast targeting signal; HBD, hybrid binding domain; MTS, mitochondrial targeting signal.
Fig 6
Fig 6. The expression of AtRNH1C increases in atrnh1b.
(A) A total of 28 RT-PCR cycles were used to detect the expression of AtRNH1B and AtRNH1C in Col-0, atrnh1b-1, and atrnh1c. GAPDH was used as the reference gene. (B, C) GUS staining of 2-week-old seedlings (B) and seeds at the globular, heart, torpedo, and mature embryo stages (C) from plants expressing AtRNH1Cpro:AtRNH1C-GUS in the atrnh1c and atrnh1b-1 backgrounds. (D) Characterize the localization of AtRNH1C protein by immunoblot. Intact chloroplasts and mitochondria were isolated from 3-week-old AtRNH1Cpro:AtRNH1C-GUS atrnh1c and AtRNH1Cpro:AtRNH1C-GUS atrnh1b transgenic plants. Anti-GUS polyclonal antibody was used to detect the AtRNH1C-GUS, and polyclonal antibodies anti-psbO, anti-IDH1, and anti-H3 were used to indicate chloroplast, mitochondria, and total protein fractions, respectively. Chl, proteins from isolated chloroplasts; Mito, proteins from isolated mitochondria; Total, total proteins from leaves. (E) A facultative dual targeting mechanism protects mitochondrial RNase H1. In the wild-type, AtRNH1C and AtRNH1B are predominately transported to the chloroplast and mitochondria, respectively, and the localization of AtRNH1C to the mitochondria is self-inhibited by an unknown mechanism. The level of AtRN1HB is much higher than that of AtRNH1C. When AtRNH1B is mutated (atrnh1b), AtRNH1C recovers its dual localization to both the chloroplast and mitochondria and its expression level increases, thus safeguarding mitochondrial function. The data underlying this figure can be found in S1 Raw Images. GUS, β-glucuronidase enzyme; H3, histone 3; IDH1, isocitrate dehydrogenase 1; psbO, photosystem II subunit O; RT-PCR, reverse transcription PCR; WT, wild type.
Fig 7
Fig 7. Atrnh1B/c exhibits increased R-loop formation and HR, leading to reduced mtDNA levels.
(A) DRIP-qPCR of siliques from Col-0, atrnh1c, and AtRNH1BRNAi atrnh1c lines (RNAi #1 and #2), including the chloroplast gene 23S (cp23S) and mitochondrial gene 26S and repeats EE1, EE2, L, and T. Data are normalized to Col-0 and shown as mean values ± SD; circles show the original data from 3 replicates. The cp23S locus was used as a positive control. RNAi #1/ #2 +RNase H1 were used as negative controls. One-way ANOVA compared to Col-0 for each primer. ns, no significance; *, p < 0.05; **, p < 0.01; ***, p < 0.001; ****, p < 0.0001. (B) Simplified scheme of qPCR amplification of sequence R1 and R2 comprising a repeated sequence (black R box) and the crossover products R1/2 and R2/1. Scheme adapted from [17]. (C) qPCR of the parental sequences and crossover products (as depicted in B) of repeats L, I, T, EE, K, and X in seeds at the globular stage from Col-0, atrnh1b-1, atrnh1c, and atrnh1b/c. Mitochondrial genes 18S and COX2 were used as reference genes. One-way ANOVA compared to Col-0 for each primer. **, p < 0.01; ****, p < 0.0001. (D, E) Relative quantification of copy numbers of mtDNA gene sequences (18S, COX2, NAD1, COX1, and NAD10) (D) and repeated sequences (E) in seeds at the globular stage from Col-0, atrnh1b-1, atrnh1c, and atrnh1b/c. Nuclear genes UBC and ACT2 were used as reference genes. One-way ANOVA compared to Col-0 for each primer. ***, p < 0.001; ****, p < 0.0001. (F) AtRNH1B ChIP-qPCR using AtRNH1Bpro:AtRNH1B-GFP atrnh1b/c (shown as AtRNH1B-GFP in brief) transgenic plants and Col-0. The cp23S and cp16S loci were used as negative controls. (G) AtRNH1CChIP-qPCR using AtRNH1Cpro:AtRNH1C-GFP (shown as AtRNH1C-GFP for briefness) in atrnh1b-1 and atrnh1c. Data are normalized as %input and shown as mean values ± SD; circles show the original data of 3 replicates. The cp23S and cp16S loci were used as positive controls. The data underlying this figure can be found in S1 Data. ACT2, ACTIN 2; ANOVA, analysis of variance; ChIP, chromatin immunoprecipitation; COX1, CYTOCHROME OXIDASE 1; COX2, CYTOCHROME OXIDASE 2; DRIP, DNA:RNA hybrid immunoprecipitation; HR, homologous recombination; mtDNA, mitochondrial DNA; NAD1, NADH DEHYDROGENASE 1; NAD10, NADH DEHYDROGENASE 10; qPCR, quantitative PCR; R1, repeat 1; R2, repeat 2; RNAi, RNA interference; SD, standard deviation; UBC, UBIQUITIN-CONJUGATING ENZYME.
Fig 8
Fig 8. Two-dimensional gel analysis detects replication events in the repeats.
(A) Schematic map of Arabidopsis mtDNA showing 6 repeat pairs. The fragments digested for 2D-AGE are indicated by red lines. (B) Illustration of the major 2D gel signals detected by the probe. (C) Two-dimensional gel analysis of digested mtDNA. Replication intermediates are indicated by square brackets. Probe (20,459–25,627) detects fragments containing repeat K1; Probe (253,814–256,094) detects fragments containing repeat I2; Probe (329,644–334,188) detects fragments containing repeat L2; and Probe (360,020–361,986) detects fragments containing repeat T2. The data underlying this figure can be found in S1 Raw Images. 2D-AGE, two-dimensional agarose gel electrophoresis; mtDNA, mitochondrial DNA; RNAi, RNA interference.
Fig 9
Fig 9. OSB1 restricts HR by inhibiting R-loop formation at IRs.
(A) DRIP-qPCR of Col-0, msh1, osb1, and recA3 seedlings. Data are normalized to Col-0 and shown as mean values ± SD; circles show the original data of 3 replicates. One-way ANOVA compared to Col-0 for each primer. *, p < 0.05; **, p < 0.01. (B) Immunoblot analysis of 35Spro:AtRNH1B-FLAG (AtRNH1BOE #1- #4) in osb1 using anti-FLAG antibody. osb1 was used as a negative control. The unspecific band below AtRNH1B-FLAG is the loading control. (C) DRIP-qPCR of Col-0, osb1, and osb1 AtRNH1BOE (#3 and #4) seedlings. One-way ANOVA compared to Col-0 for each primer. *, p < 0.05; **, p < 0.01. (D) qPCR of the crossover products (as depicted in A) of repeats L, EE, and I from Col-0, osb1, and osb1 AtRNH1BOE (#3 and #4). One-way ANOVA compared to osb1 for each primer. ns, no significance; **, p < 0.01; ****, p < 0.0001. The data underlying this figure can be found in S1 Data and S1 Raw Images. ANOVA, analysis of variance; DRIP, DNA:RNA hybrid immunoprecipitation; HR, homologous recombination; IR, intermediate-sized repeat; OE, overexpression; OSB1, ORGANELLAR SINGLE-STRANDED DNA BINDING PROTEIN1; qPCR, quantitative PCR; SD, standard deviation.
Fig 10
Fig 10. The relationship between AtRNH1B/C and OSB1.
(A) Four-week-old AtRNH1BRNAi #1 atrnh1c, osb1, and osb1 AtRNH1BRNAi #1 atrnh1c plants (shown as osb1RNAi #1). Scale bars, 1 cm. (B) DRIP-qPCR of siliques from Col-0, osb1, AtRNH1BRNAi #1 atrnh1c, and osb1 RNAi #1. Data are normalized to Col-0 and shown as mean values ± SD; circles show the original data of 3 replicates. One-way ANOVA compared to Col-0 for each primer. *, p < 0.05; **, p < 0.01. (C) qPCR of the crossover products (as depicted in B) of repeats L, EE, and I from Col-0, osb1, AtRNH1BRNAi #1 atrnh1c and osb1 RNAi #1. One-way ANOVA compared to Col-0 for each primer. The data underlying this figure can be found in S1 Data. (D) R-loops trigged by AtRNH1B/1C and OSB1 mutation may promote HR of IRs. AtRNH1B/1C could repress mtDNA HR of IRs by modulating R-loops at IRs regions. Another HR surveillance factor, OSB1, controls HR via 3 different mechanisms at different IRs (indicated by 3 different colors). Specifically, OSB1 represses HR of repeat I independent R-loop and HR of repeat EE and L, which is partially dependent on inhibiting R-loop formation. In addition, AtRNH1B/1C has an epistatic effect to OSB1 at repeat L but a parallel effect to OSB1 at repeat EE. ANOVA, analysis of variance; DRIP, DNA:RNA hybrid immunoprecipitation; HR, homologous recombination; IR, intermediate-sized repeat; mtDNA, mitochondrial DNA; OSB1, ORGANELLAR SINGLE-STRANDED DNA BINDING PROTEIN1; qPCR, quantitative PCR; RNAi, RNA interference; SD, standard deviation.

Similar articles

Cited by

References

    1. Costantino L, Koshland D. The Yin and Yang of R-loop biology. Curr Opin Cell Biol. 2015;34:39–45. doi: 10.1016/j.ceb.2015.04.008 ; PubMed Central PMCID: PMC4522345. - DOI - PMC - PubMed
    1. Crossley MP, Bocek M, Cimprich KA. R-Loops as Cellular Regulators and Genomic Threats. Mol Cell. 2019;73(3):398–411. doi: 10.1016/j.molcel.2019.01.024 PubMed PMID: WOS:000458015200004. - DOI - PMC - PubMed
    1. Garcia-Muse T, Aguilera A. R Loops: From Physiological to Pathological Roles. Cell. 2019;179(3):604–18. Epub 2019/10/15. doi: 10.1016/j.cell.2019.08.055 . - DOI - PubMed
    1. Silva S, Camino LP, Aguilera A. Human mitochondrial degradosome prevents harmful mitochondrial R loops and mitochondrial genome instability. Proc Natl Acad Sci U S A. 2018;115(43):11024. doi: 10.1073/pnas.1807258115 - DOI - PMC - PubMed
    1. Santos-Pereira JM, Aguilera A. R loops: new modulators of genome dynamics and function. Nat Rev Genet. 2015;16(10):583–97. doi: 10.1038/nrg3961 . - DOI - PubMed

Publication types