. 2021 Aug 3;16(8):e0254730.
doi: 10.1371/journal.pone.0254730. eCollection 2021.

Microbial assemblages and methanogenesis pathways impact methane production and foaming in manure deep-pit storages

Affiliations

Microbial assemblages and methanogenesis pathways impact methane production and foaming in manure deep-pit storages

Fan Yang et al. PLoS One. .

Abstract

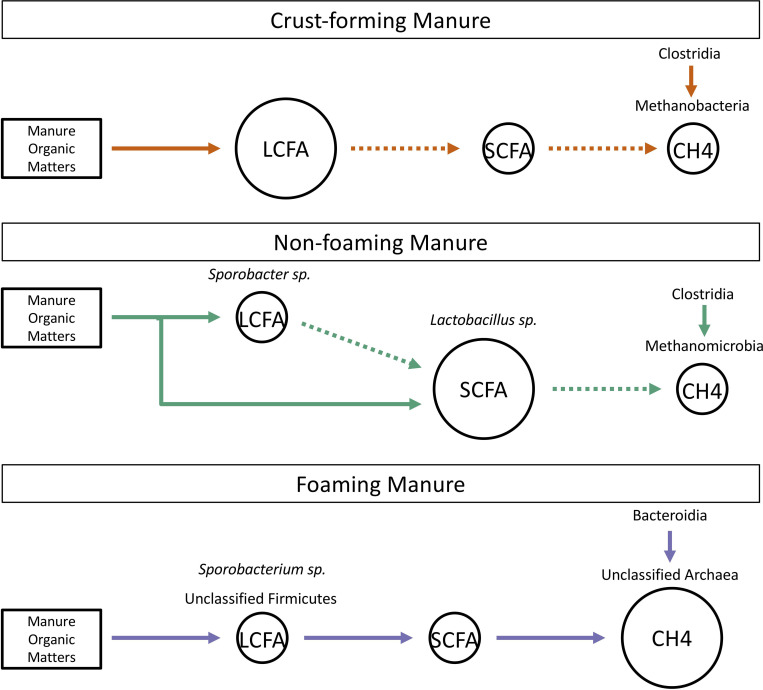
Foam accumulation in swine manure deep-pits has been linked to explosions and flash fires that pose devastating threats to humans and livestock. It is clear that methane accumulation within these pits is the fuel for the fire; it is not understood what microbial drivers cause the accumulation and stabilization of methane. Here, we conducted a 13-month field study to survey the physical, chemical, and biological changes of pit-manure across 46 farms in Iowa. Our results showed that an increased methane production rate was associated with less digestible feed ingredients, suggesting that diet influences the storage pit's microbiome. Targeted sequencing of the bacterial 16S rRNA and archaeal mcrA genes was used to identify microbial communities' role and influence. We found that microbial communities in foaming and non-foaming manure were significantly different, and that the bacterial communities of foaming manure were more stable than those of non-foaming manure. Foaming manure methanogen communities were enriched with uncharacterized methanogens whose presence strongly correlated with high methane production rates. We also observed strong correlations between feed ration, manure characteristics, and the relative abundance of specific taxa, suggesting that manure foaming is linked to microbial community assemblage driven by efficient free long-chain fatty acid degradation by hydrogenotrophic methanogenesis.


Conflict of interest statement

The authors have declared that no competing interests exist.

Figures

Fig 1
Fig 1. The proportions of manure samples with different surface textures collected over 13 months, where “no-foam” represents non-foaming manure, “crust” represents crust-forming manure, and “foam” represents foaming manure.
The lines are the fitted trend lines showing the changes in percent of different type of samples collected over the study.
Fig 2
Fig 2
The five strongest manure characteristic associations in foam (purple), crust (orange), and no-foam (green) manure samples. Bars extending towards left represent negative correlations and bars extending towards right represent positive correlations.
Fig 3
Fig 3
Non-metric multidimensional scaling (NMDS) analysis of bacterial communities (panel A) and methanogen communities (panel B) by the Bray-Curtis distances calculated using the relative abundance of microbial operational taxonomic units (OTU). The ellipses represent 95% confidence level around the centroids of manure samples with different surface textures. The microbial community variations among manure samples with different surface textures were assessed using Permutational Multivariate Analysis of Variance Using Distance Matrices (PERMANOVA). The methane production rates (MPR) were modeled to overlay the observed community differences (Contour fitting). The grey background shows the fitted MPR based on the measured MPR, with darker grey represents higher MPR.
Fig 4
Fig 4
The manure-associated community dissimilarity as a function of time (y = a•exp(b•x)), where a smaller slope (b) suggests a smaller dissimilarity over time. Distribution of slopes was estimated by bootstrapping each group of samples 999 times. The slope estimated for non-foaming samples was significantly greater than those estimated for crust-forming and foaming samples (overlap coefficient = 0.0467).
Fig 5
Fig 5
The distribution of shared and unique A) bacterial and B) methanogenic core of no-foam, crust, and foam manure samples. The numbers represent the operational taxonomic unit (OTU) counts. Panel C shows the ten most relatively abundant bacterial groups at the genus level where relative abundances were significantly different among no-foam, crust, and foam manures. Methanogen groups that differed significantly in relative abundance among different types of manure are shown in panel D. Individual bar represents the average of a microorganism relative abundance in the specified manure type, while individual error bar represents the 95% confidence interval calculated using bootstrapping method. Within panel C and D, the labels on the right side indicate the manure type in which the bacterial or methanogen groups were the most relatively abundant in.
Fig 6
Fig 6. The core significant and strong correlations between bacteria and methanogens, bacteria/methanogens and dietary inputs, and bacteria/methanogens and manure characteristics.
Individual rectangle labels represent dietary input, manure measurements, or bacterial and methanogenic groups at the class level. The solid lines represent positive correlations and the dashed lines represent negative correlations. A thicker line indicates a stronger correlation. Correlations observed in no-foam, crust, and foam manure were shown in green, orange, and purple, respectively. Looped correlations indicate that relationships were observed among members of the same microbial groups.
Fig 7
Fig 7. The predicted manure fermentation processes in crust-forming, non-foaming, and foaming manure.
The solid and dashed lines represent efficient and inefficient processes, respectively. The circles represent the fermentation by-product and the large circle indicates the accumulation of the by-product. The microorganisms that strongly and positively correlated with the by-product are listed above the circles.

Similar articles

References

    1. Smil V. Worldwide transformation of diets, burdens of meat production and opportunities for novel food proteins. Enzyme and Microbial Technology. 2002. pp. 305–311. doi: 10.1016/S0141-0229(01)00504-X - DOI
    1. Jacobson LD, Hu B, Yan M, Akdeniz N, Clanton C. The potential causes of manure pit foaming in pig finishing barns. Biol Eng Trans. 2013;7004: 4764–4773.
    1. Foaming Manure. In: Ontario Ministry of Agriculture, Food and Rural Affairs [Internet]. 2016 [cited 9 Feb 2021]. Available: http://www.omafra.gov.on.ca/english/livestock/swine/news/mayjun10a1.htm
    1. Hoff SJ. Manure foaming issues. In: Professional Pig Community; [Internet]. 2015. [cited 9 Feb 2021]. Available: https://www.pig333.com/articles/manure-foaming-issues_10067/
    1. Van Weelden MB, Andersen DS, Kerr BJ, Trabue SL, Pepple LM. Impact of fiber source and feed particle size on swine manure properties related to spontaneous foam formation during anaerobic decomposition. Bioresour Technol. 2016;202: 84–92. doi: 10.1016/j.biortech.2015.11.080 - DOI - PubMed

Publication types