. 2021 Nov 4;28(11):1907-1921.e8.
doi: 10.1016/j.stem.2021.07.002. Epub 2021 Aug 2.

Dynamic cell contacts between periportal mesenchyme and ductal epithelium act as a rheostat for liver cell proliferation

Affiliations

Dynamic cell contacts between periportal mesenchyme and ductal epithelium act as a rheostat for liver cell proliferation

Lucía Cordero-Espinoza et al. Cell Stem Cell. .

Abstract

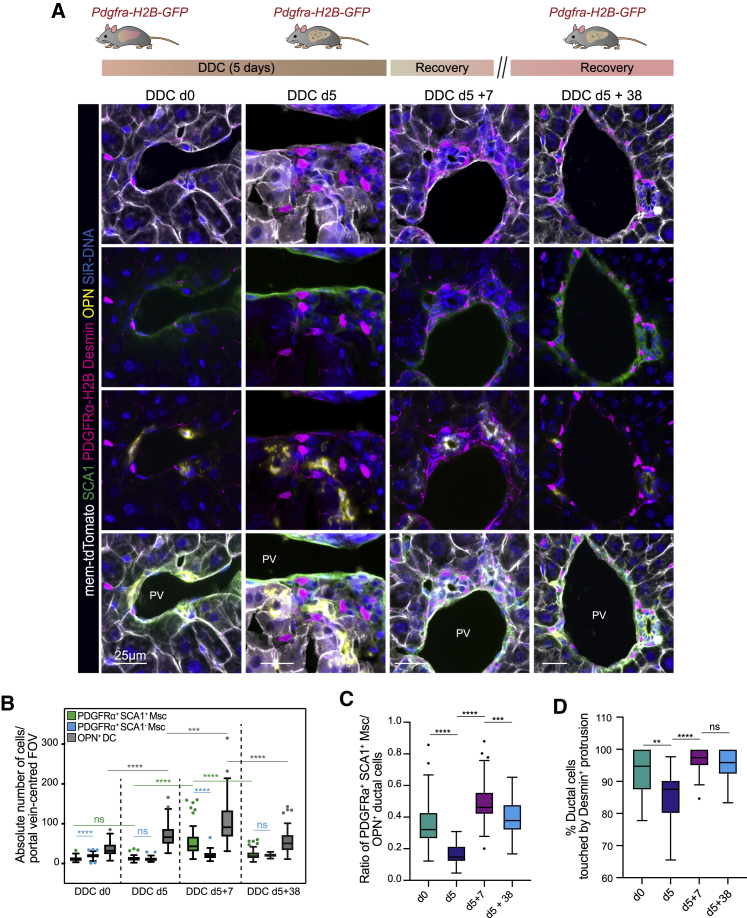
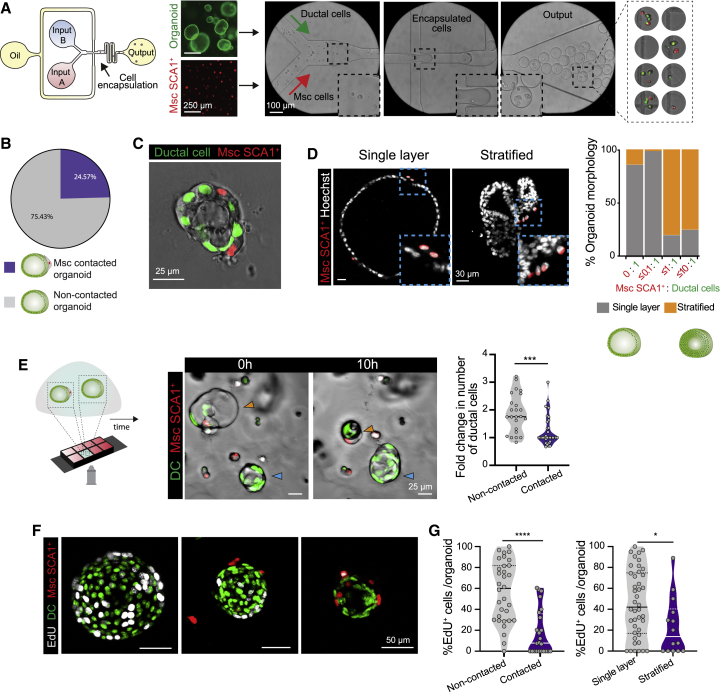
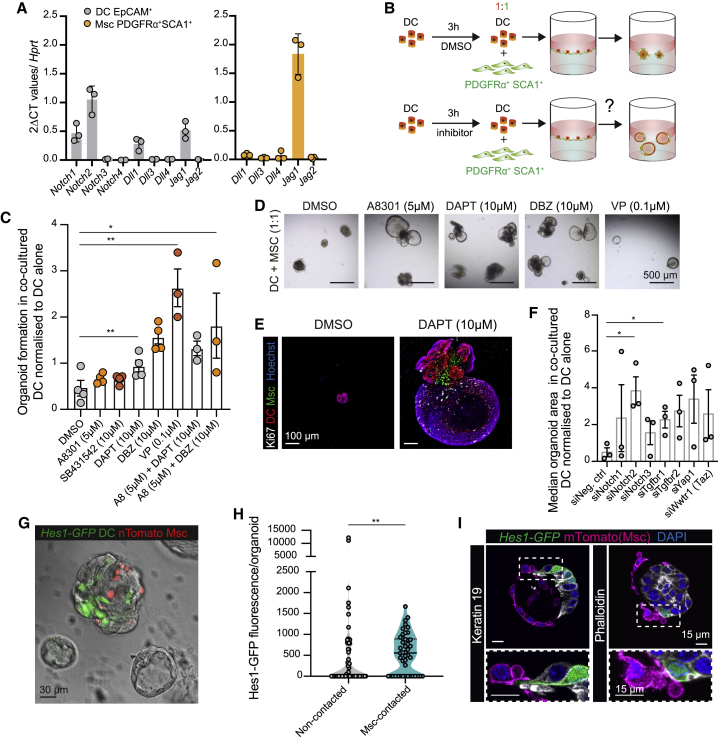
In the liver, ductal cells rarely proliferate during homeostasis but do so transiently after tissue injury. These cells can be expanded as organoids that recapitulate several of the cell-autonomous mechanisms of regeneration but lack the stromal interactions of the native tissue. Here, using organoid co-cultures that recapitulate the ductal-to-mesenchymal cell architecture of the portal tract, we demonstrate that a subpopulation of mouse periportal mesenchymal cells exerts dual control on proliferation of the epithelium. Ductal cell proliferation is either induced and sustained or, conversely, completely abolished, depending on the number of direct mesenchymal cell contacts, through a mechanism mediated, at least in part, by Notch signaling. Our findings expand the concept of the cellular niche in epithelial tissues, whereby not only soluble factors but also cell-cell contacts are the key regulatory cues involved in the control of cellular behaviors, suggesting a critical role for cell-cell contacts during regeneration.

Keywords: droplet microfluidics; flow-focussing device; liver; liver ductal cell; mesenchyme; multicellular co-culture; niche; organoid; organotypic co-culture; regeneration.


Conflict of interest statement

Declaration of interests M.H. is inventor in a patent on liver organoids and is on the advisory board of the journal Cell Stem Cell.

Figures

None
Graphical abstract
Figure 1
Figure 1
PDGFRα+SCA1+ mesenchymal cells reside near the portal tract (A) SCA1 marks exclusively the portal tract region of the liver lobule. Top: schematic of a liver lobule, spanning from the portal tract (formed by the portal vein [PV], hepatic artery [HA], and bile duct [BD]) to the central vein (CV) area. Bottom: representative composite single z stack images of liver sections, stained for SCA1 (green), Vimentin (Vim, red), the ductal marker osteopontin (OPN, white) and nuclei (Hoechst, blue). (B) Representative composite single z stack images of Pdgfra-H2B-GFP (nuclear red) mouse livers co-stained with SCA1 (green) and the ductal marker osteopontin (OPN, white). PDGFRα+SCA1+ cells (B1, close up underneath) are in close proximity to the ductal epithelium (orange arrow), while PDGFRα+SCA1 cells (B2) are spread throughout the parenchyma. (C) Representative composite single z stack images of Pdgfra-H2B-GFP (nuclear white) mouse livers co-stained with SCA1 (green), elastin (red), and β-catenin (white, membrane). Yellow arrow, PDGFRα+SCA1+. (D) Representative composite maximum intensity projection image of PDGFRα+SCA1+ cells (nuclear magenta) contacting liver ductal cells (OPN, yellow) through desmin (magenta) membrane protrusions; SCA1 staining (green), membrane marker tdTomato (white), and DNA (SiR-DNA, blue). See also Figure S1 and Video S1.
Figure 2
Figure 2
Periportal SCA1+Msc cells express a pro-regenerative growth factor signature (A and B) Isolation of EpCAM+ ductal cells (DCs; gate 1), PDGFRα+SCA1 (gate 2a), and PDGFRα+SCA1+ (gate 2b) Msc and PDGFRαSCA1+ (gate 2c) stromal cells from Pdgfra-H2B-GFP mouse livers. (A) Experimental design. (B) Representative FACS plots. (C) RNA sequencing (RNA-seq) analysis of the populations in (B). Heatmap represents the TPM (transcripts per million) values from the RNA-seq for the indicated genes (n = 3 biological replicates). H/E, hematopoietic/endothelial cell markers. (D) RT-qPCR expression analysis of selected genes from freshly sorted DCs and specified niche cells in (B). Graph represents mean ± SEM of n > 8 biological replicates (mice) from n = 3 independent experiments. Unpaired t test with Welsch correction (∗∗p < 0.01; ns, p > 0.01). (E and F) scRNA-seq analysis of mouse hepatic Msc populations reported in Dobie et al. (2019). tSNE [t-distributed stochastic neighbor embedding] (left) and violin plots (right) indicating the mRNA expression levels for SCA1 (Ly6a; E) or the indicated growth factors (F). PF, portal fibroblast; HSC, hepatic stellate cell; VSMC, vascular smooth muscle cell. (G) Gene expression analysis of selected secreted growth factor genes in the indicated sorted populations. Graph represents mean ± SD of n = 3 biological replicates (mice). See also Figure S2.
Figure 3
Figure 3
Relative abundance and cell contacts between DCs and PDGFRα+SCA1+Msc cells change dynamically during the damage-regenerative response (A–D) The number, distribution, and cell contacts between DCs, SCA1+Msc cells, and SCA1 Msc cells were quantified before and after inducing liver injury and at days 7 and 38 of recovery. (A) Top: scheme of experimental approach. Bottom: representative maximum intensity projection composite images of livers from Pdgfra-H2B-GFP/mTmG mice stained for desmin (magenta), SCA1 (green), and OPN (yellow), Pdgfra-H2B-GFP (nuclear; magenta), membrane tdTomato (white), and nuclei (SiR-DNA, blue). (B) Box-and-whisker Tukey plot (median, whiskers are 1.5 interquartile range) of the absolute number of mesenchymal (PDGFRα+SCA1+ and PDGFRα+SCA1) and ductal (OPN+) cells per field of view (FOV) of PV-centered composite confocal images from DDC-damaged livers at day 0 (n = 3), day 5 (n = 3), day 5 plus 7 days recovery (n = 3), and day 5 plus 38 days recovery (n = 2). Dots represent outliers. Mann-Whitney tests; ∗∗∗∗p < 0.0001; ∗∗∗p < 0.001; ns, p > 0.05. (C) Box-and-whisker Tukey plot (median, whiskers are 1.5 interquartile range) of the ratio of the number of PDGFRα+SCA1+Msc cells relative to DCs. Dots, outliers. Mann-Whitney t tests; ∗∗∗∗p < 0.0001; ∗∗∗p < 0.001. (D) Box-and-whisker Tukey plot (median, whiskers are 1.5 interquartile range) represents the percentage of DCs contacted by a desmin protrusion in DDC-damaged livers (n ≥ 3 mice). Dots, outliers. Mann-Whitney test; ∗∗p < 0.001; ∗∗∗∗p < 0.0001. See also Figure S3.
Figure 4
Figure 4
PDGFRα+SCA1+ mesenchymal cells support organoid formation via secreted growth factors (A) Organoid-formation efficiency of EpCAM+ DCs and PDGFRα+SCA1+Msc cells cultured either alone (monoculture) or together (co-culture, 3,600 DCs and 18,000 Msc) in mesenchymal medium (MM) or DCs cultured alone in complete expansion medium (EM). Left: experimental design. Middle: representative brightfield images. Right: graph representing mean ± SEM of the percentage of organoid formation at day 10 obtained from at least n = 3 independent biological replicates. Student’s t test; ∗∗∗p < 0.001; ns, p > 0.1. (B) Organoid-formation efficiency of freshly sorted EpCAM+ DCs seeded on a transwell insert alone in EM or MM or co-cultured for 10 days with freshly sorted PDGFRα+SCA1+ cells in MM. Left: schematic of a transwell co-culture. Middle: representative brightfield images of a transwell co-culture at day 10. Organoids, upper chamber. Msc, bottom chamber. Graph represents mean ± SEM of the percentage of organoid formation obtained from n = 3 independent biological replicates. Student’s t test; p < 0.1; ns, p > 0.1. (C–E) RNA-seq analysis of DCs and SCA1+Msc sorted cells collected at day 0 (prior to culture), cultured alone or co-cultured in a transwell (day 15). (C) Experimental design. (D) Unsupervised clustering analysis of global mRNA expression in DCs and SCA1+Msc cells. (E) Heatmap representing the mean log2(TPM+1) value of the indicated genes from n = 2 independent biological replicates. (F) PDGFRα+SCA1+ conditioned medium (CM) or unconditioned MM was added to freshly sorted EpCAM+ cells, and organoid formation was assessed at day 10. Top: experimental design. Bottom: representative brightfield images. Graph represents the percent organoid formation efficiency at day 10. Results are shown as mean ± SEM of n = 3 independent experiments, each with two biological replicates. Unpaired t test with Welsch correction; ∗∗p < 0.01. (G) Immunofluorescence analysis of organoids derived from sorted EpCAM+ DCs cultured for 10 days in complete medium (EM) or Msc CM. Single composite z stack images of organoids stained for E-cadherin (magenta), KRT19 (green), proliferation (Ki67, yellow), and nuclei (blue). Representative images of n = 3 independent experiments. See also Figure S4.
Figure 5
Figure 5
Mesenchymal-ductal organoids recapitulate the in vivo duct/Msc architecture of the portal tract (A) Microfluidic setup for cell encapsulation of DCs and Msc, with a flow-focusing device (FFD) containing two separate inlets for cell loading (input A and input B, in aqueous phase), one inlet for the continuous phase (oil) and one outlet. Representative brightfield images of encapsulated microgels are shown. (B) Frequency of formation of Msc-contacted organoids (containing DCs + SCA1+Msc) at day 4 following encapsulation. n = 4 independent experiments. (C) Representative composite single z stack image of a Msc-contacted organoid at day 4 post-encapsulation exhibiting a single-layer ductal (nuclear GFP+) epithelium surrounded by mesenchymal (nuclear tdTom+) cells on the periphery. See Figure S5F for additional examples. (D) Representative composite single z stack immunofluorescence images of Msc-contacted organoids exhibiting cystic/single-layer epithelium (left) and stratified epithelium (right). Msc, red; nuclei, white. Percentage of organoid morphologies observed according to the ratio of SCA1+Msc per DC. Data are presented as mean from n = 3 independent experiments. (E) Time-lapse imaging (24 h) of Msc-contacted (nuclear GFP+ and nuclear tdTom+) versus non-contacted (nuclear GFP+) organoids grown within the same Matrigel droplet and culture medium. Left: experimental design. Middle: stills of a time-lapse at day 4 after co-encapsulation. Non-contacted organoid grows (blue arrowhead), while the Msc-contacted organoid collapses (orange arrowhead). Violin plot indicates the data-point distribution, median, and interquartile range (IQR) of the fold change on number of DCs following 24 h of imaging in non-contacted versus Msc-contacted structures obtained from n = 3 experiments. Dot, independent organoid. Mann-Whitney test; ∗∗∗p < 0.001. (F) Representative composite maximum projected z stacks images of organoids immunostained for EdU (white) assessed in day 5 co-cultures following incubation with 10 μM EdU for 16 h. (G) Violin graphs represent the distribution, median, and IQR of the percentage of EdU+ DCs in non-contacted versus Msc-contacted organoids (left) and in single-layer/cystic versus stratified organoids (right) presented in (F) from n = 3 independent biological replicates. Mann-Whitney test; ∗∗∗∗p < 0.0001; p < 0.1. See also Figure S5 and Videos S2, S3, and S4.
Figure 6
Figure 6
Dosage of cell contacts between PDGFRα+SCA1+Msc and DCs determines the net outcome of DC proliferation (A) DCs (nuclear tdTom+, red) were mixed at different ratios with PDGFRα+SCA1+Msc cells (nuclear GFP+, green) and seeded on top of a 2D layer of Matrigel. Representative composite image of a 1:1 ratio co-culture at days 0 and 2. (B and C) Freshly sorted DCs (red) were co-cultured with increasing ratios of SCA1+Msc cells in either growth-factor-devoid medium (MM) or growth-factor-rich medium (EM) for 8 days. (B) Representative composite images. (C) Quantification of cystic/single-layer organoid formation efficiency at the indicated ratios in MM (orange) or EM (blue) at day 8, normalized to the DCs alone in MM (ratio 0:1). Graphs denote mean ± SD of n = 3 (EM) and n = 4 (MM) independent experiments. (D) Total numbers of organoids from (C). (E and F) DC co-cultured with increasing numbers of SCA1+Msc cells were incubated with 10 μM EdU at day 6, and the number of proliferating cells was quantified 16 h later. (E) Representative composite images; EdU, white; nuclei, blue. (F) Graph representing the total number of EdU+ DCs in the co-cultures at the indicated ratios. Mean ± SD of n = 2 independent experiment with >22 organoids per condition. (G) Representative composite maximum intensity projection of Msc-contacted (nuclear green) and non-contacted organoids (nuclear magenta), stained for cleaved caspase-3 (white) at day 7. Nuclei, blue; the ratio of Msc to DC is specified for each structure. (H) Percentage of DCs stained with cleaved caspase-3 in non-contacted or Msc-contacted structures; graph shows mean ± SD of n = 3 independent experiments with bins specified by the ratio of Msc to DC in each organoid structure. See also Figure S6.
Figure 7
Figure 7
Cell contact from PDGFRα+SCA1+Msc cells inhibits DC proliferation via Notch signaling (A) RT-qPCR gene expression analysis on selected genes of the Notch pathway in freshly sorted EpCAM+ DCs (gray bars) and PDGFRα+SCA1+Msc cells (orange bars). Graphs represent mean ± SD of n = 3 independent experiments. (B–E) Freshly sorted EpCAM+ DCs (5,000 cells) were pretreated for 3 h with DMSO or the indicated inhibitors prior to being co-cultured at 1:1 ratio with 5,000 SCA1+Msc cells in MM. (B) Experimental design. (C) Graph represents cystic/single-layer organoid formation at day 10 in the DC/SCA1+Msc co-cultures normalized to that of the respective DC monocultures. Graphs display mean ± SEM from n ≥ 3 independent experiments. Student’s t test (all treatments compared to the DMSO). ∗∗p < 0.01; p < 0.1; ns, p > 0.1. (D) Representative bright-field images from day 10 co-cultures. (E) Maximum projected composite images of chimeric organoids (DC, red; Msc, green) immunostained for Ki67 (white) and nuclei (blue) at day 10 after DAPT treatment. (F) Freshly sorted DCs (5,000 cells) were transfected with the indicated small interfering RNA (siRNA) and cultured alone or with 2,500 SCA1+Msc cells in MM at a 0.5:1 ratio (Msc/DCs). Organoid formation was assessed at day 10. Bar graph represents mean ± SEM of median organoid area normalized to the respective DC monocultures from n = 3 independent experiments. Student’s t test (compared to control); p < 0.1; ns, p > 0.1. (G–I) Co-cultures between DCs sorted from Hes1-GFP mouse livers (green) and SCA1+Msc cells (ntdTom+, red) seeded at a 0.5:1 (Msc/DCs). The number of Hes1-GFP+ cells was assessed at day 8. (G) Representative bright-field and composite fluorescence image showing a contacted organoid (gray and red) with active Hes1-GFP (green) and non-contacted, Hes1-GFP organoids (gray). (H) Graph represents the Hes1-GFP mean fluorescence intensity and area per z stack, normalized to total area, in non-contacted versus Msc-contacted organoids. Data are presented as violin plots showing data-point distribution, median, and IQR of n = 2 independent experiments (n = 46 Msc-contacted and 68 non-contacted organoids). Mann-Whitney test; ∗∗p < 0.01. (I) Single z stack composite images of membrane tdTomato+ SCA1+Msc cells (magenta) establishing cell-cell contact with Hes1-GFP DCs. DC membranes were immunostained with Keratin-19 (white, left) or Phalloidin (white, right) and nuclei (blue). See also Figure S7.

Comment in

References

    1. Aloia L., McKie M.A., Vernaz G., Cordero-Espinoza L., Aleksieva N., van den Ameele J., Antonica F., Font-Cunill B., Raven A., Aiese Cigliano R., et al. Epigenetic remodelling licences adult cholangiocytes for organoid formation and liver regeneration. Nat. Cell Biol. 2019;21:1321–1333. - PMC - PubMed
    1. Apte U., Thompson M.D., Cui S., Liu B., Cieply B., Monga S.P. Wnt/beta-catenin signaling mediates oval cell response in rodents. Hepatology. 2008;47:288–295. - PubMed
    1. Berger D.R., Ware B.R., Davidson M.D., Allsup S.R., Khetani S.R. Enhancing the functional maturity of induced pluripotent stem cell-derived human hepatocytes by controlled presentation of cell-cell interactions in vitro. Hepatology. 2015;61:1370–1381. - PubMed
    1. Bhatia S.N., Balis U.J., Yarmush M.L., Toner M. Microfabrication of hepatocyte/fibroblast co-cultures: role of homotypic cell interactions. Biotechnol. Prog. 1998;14:378–387. - PubMed
    1. Boulter L., Govaere O., Bird T.G., Radulescu S., Ramachandran P., Pellicoro A., Ridgway R.A., Seo S.S., Spee B., Van Rooijen N., et al. Macrophage-derived Wnt opposes Notch signaling to specify hepatic progenitor cell fate in chronic liver disease. Nat. Med. 2012;18:572–579. - PMC - PubMed

Publication types