. 2021 Aug 19;184(17):4512-4530.e22.
doi: 10.1016/j.cell.2021.07.015. Epub 2021 Aug 2.

CXCR6 positions cytotoxic T cells to receive critical survival signals in the tumor microenvironment

Affiliations

CXCR6 positions cytotoxic T cells to receive critical survival signals in the tumor microenvironment

Mauro Di Pilato et al. Cell. .

Abstract

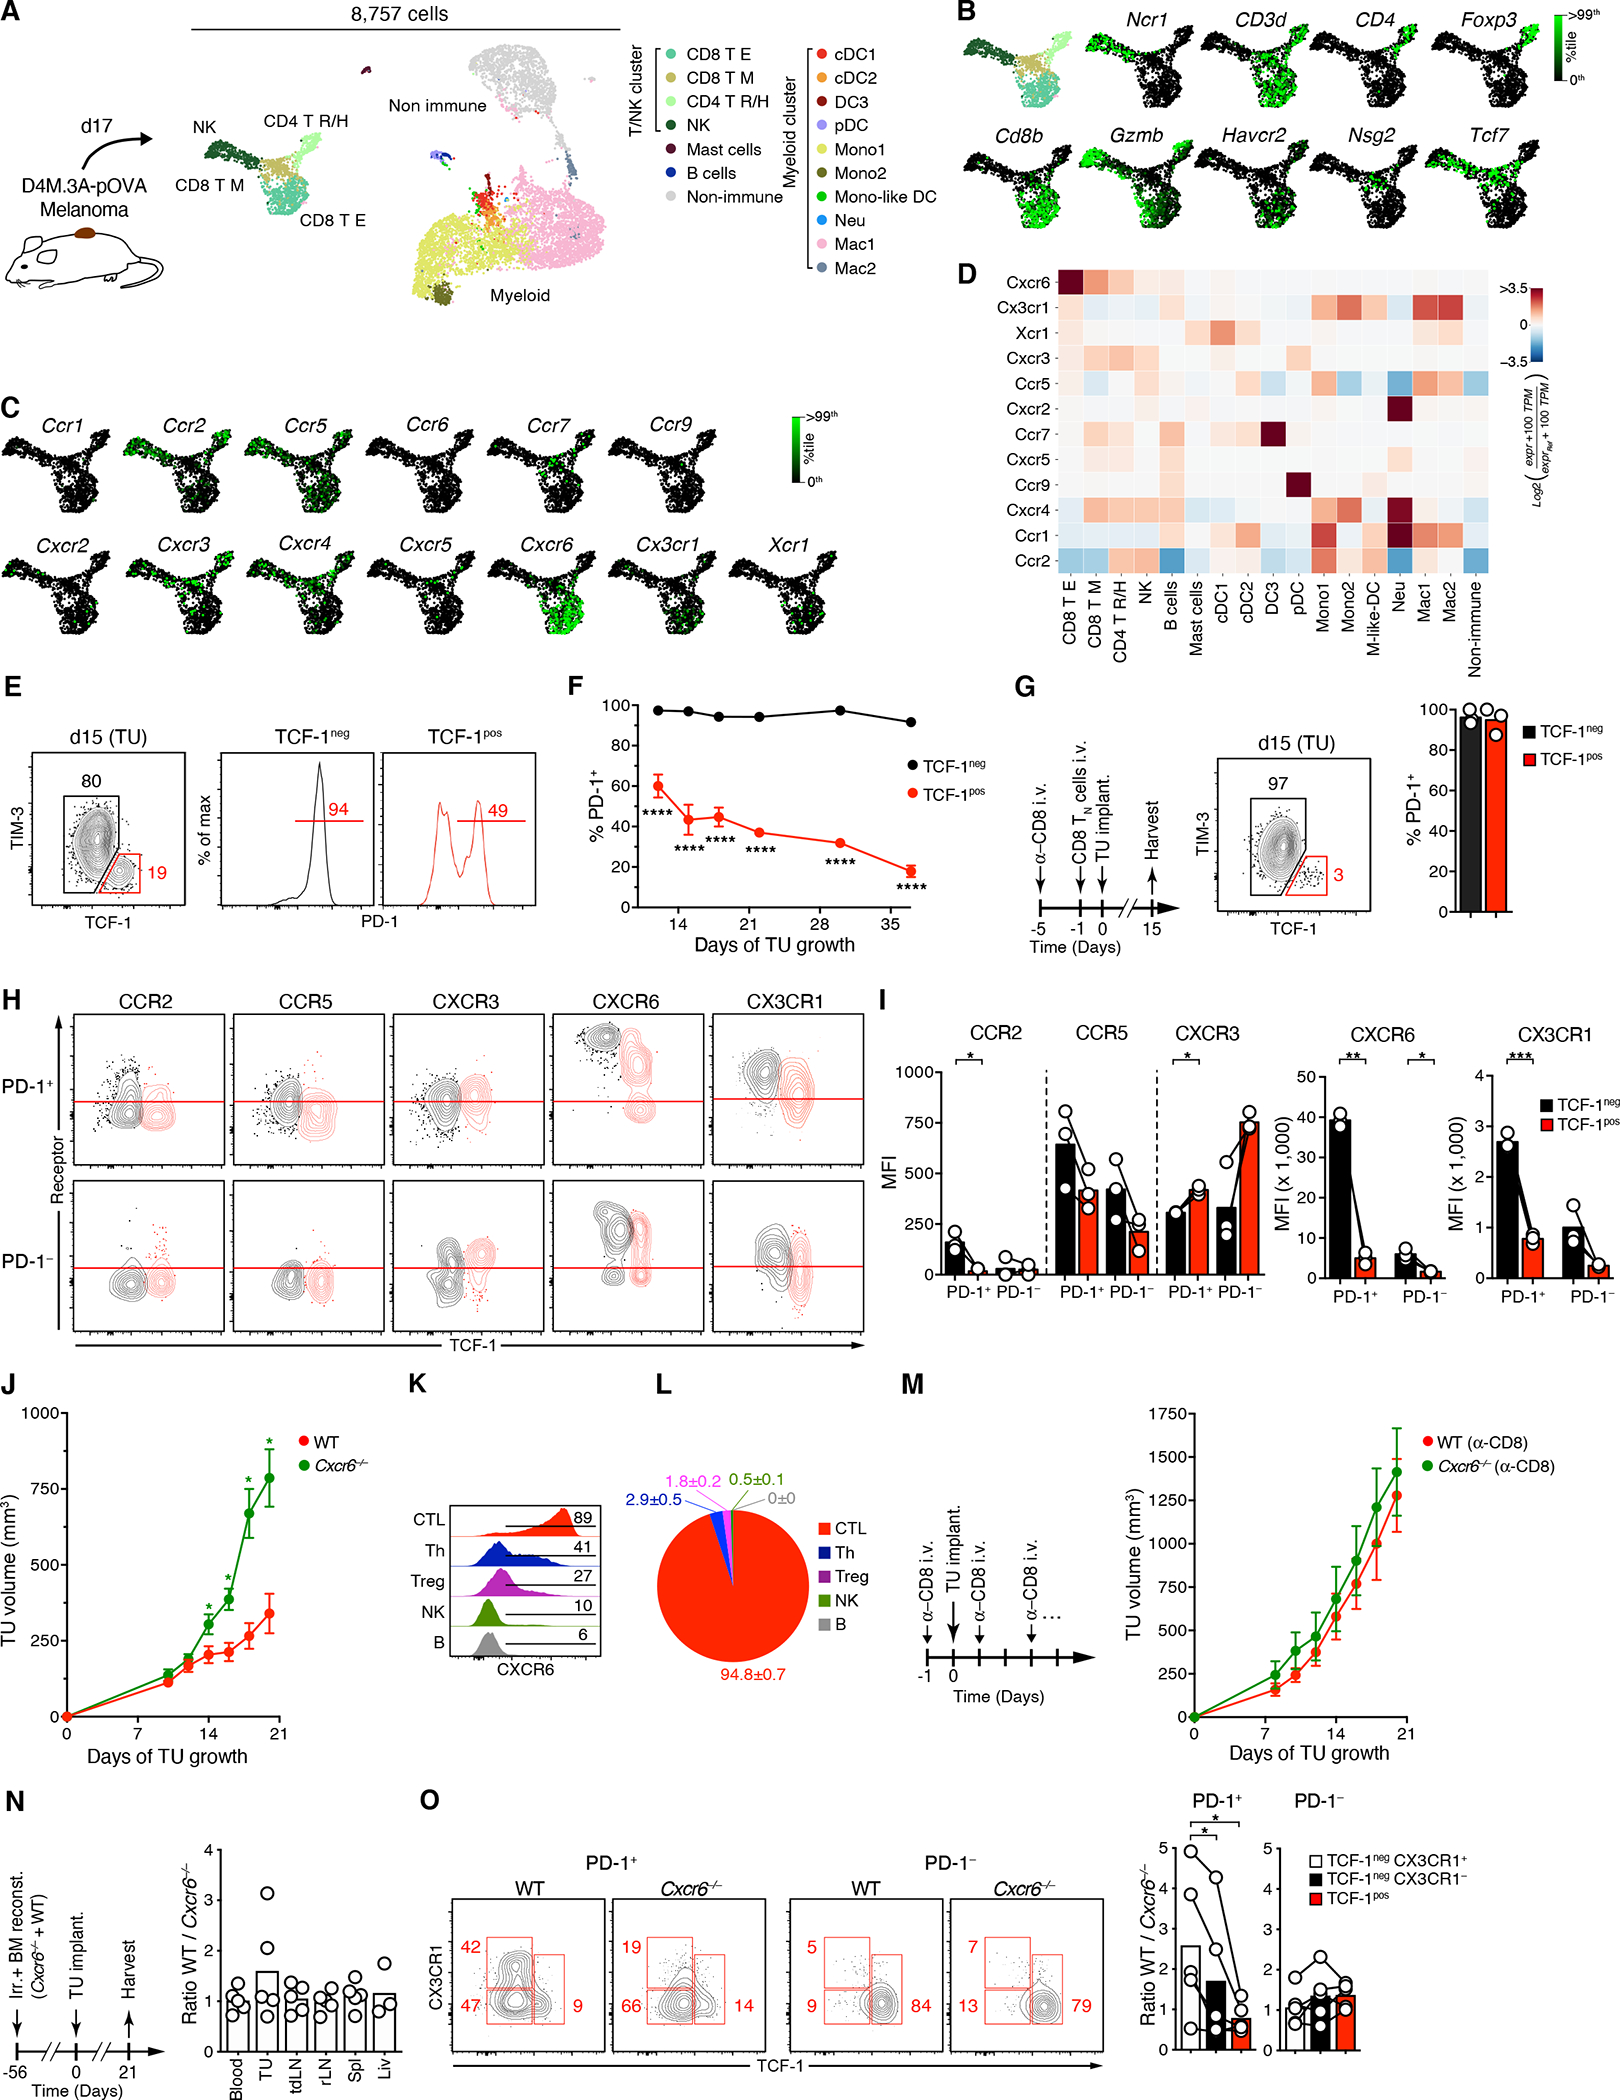
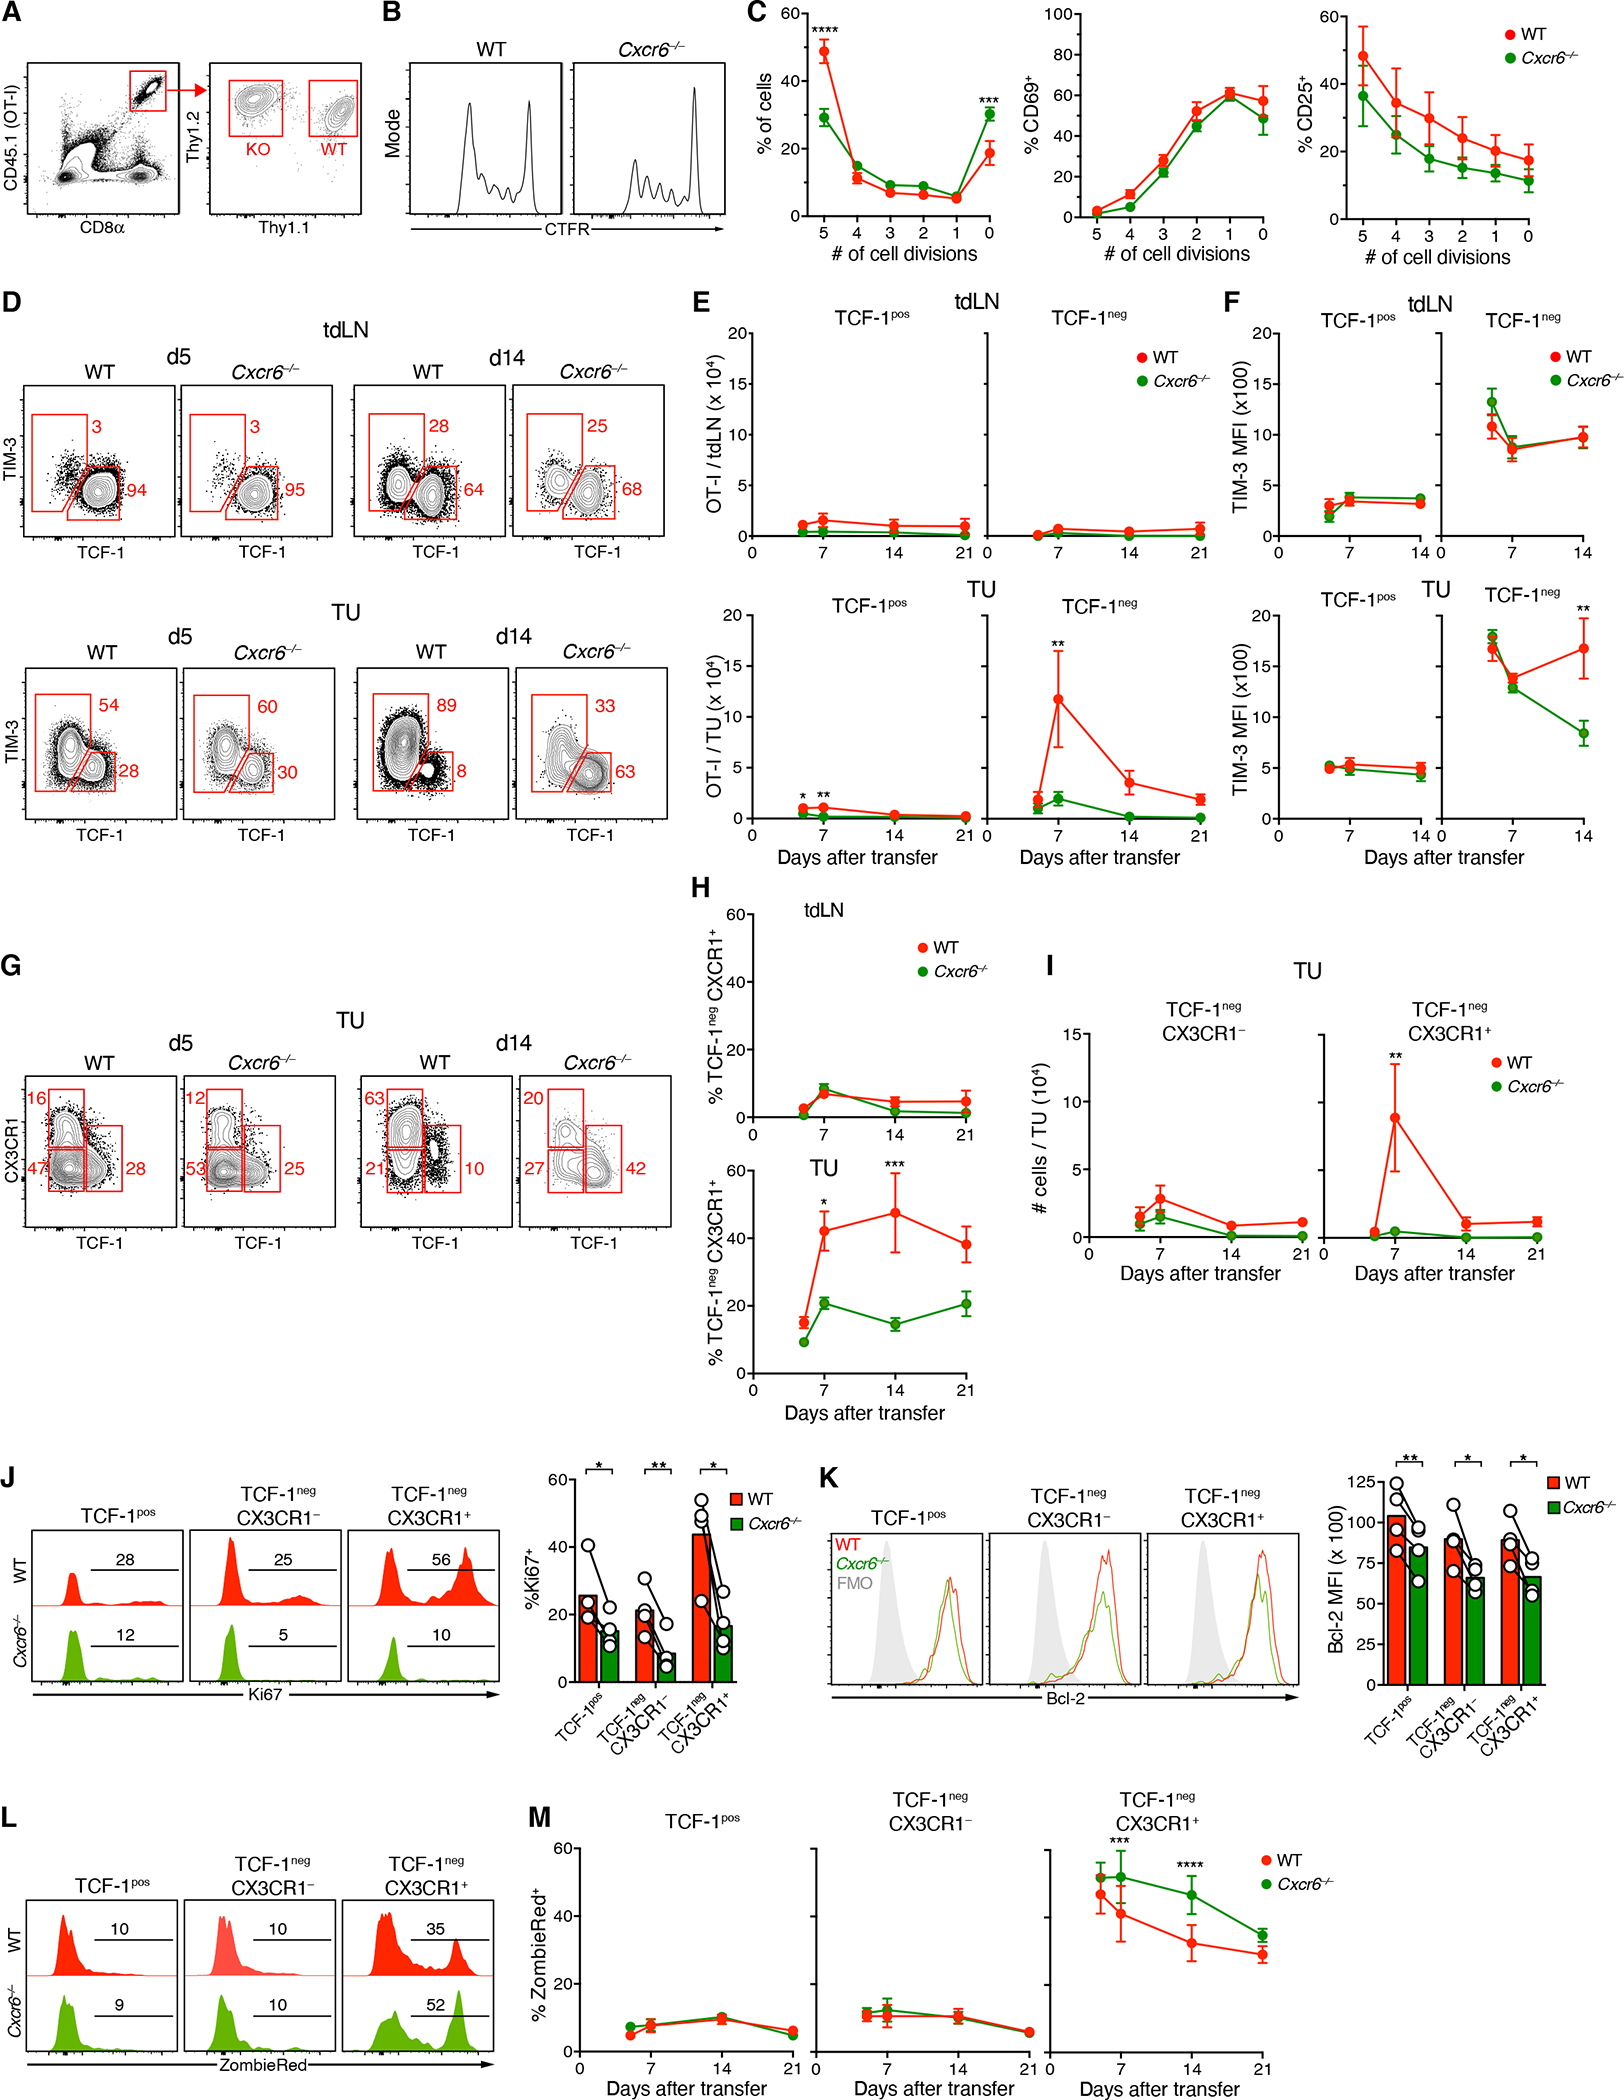
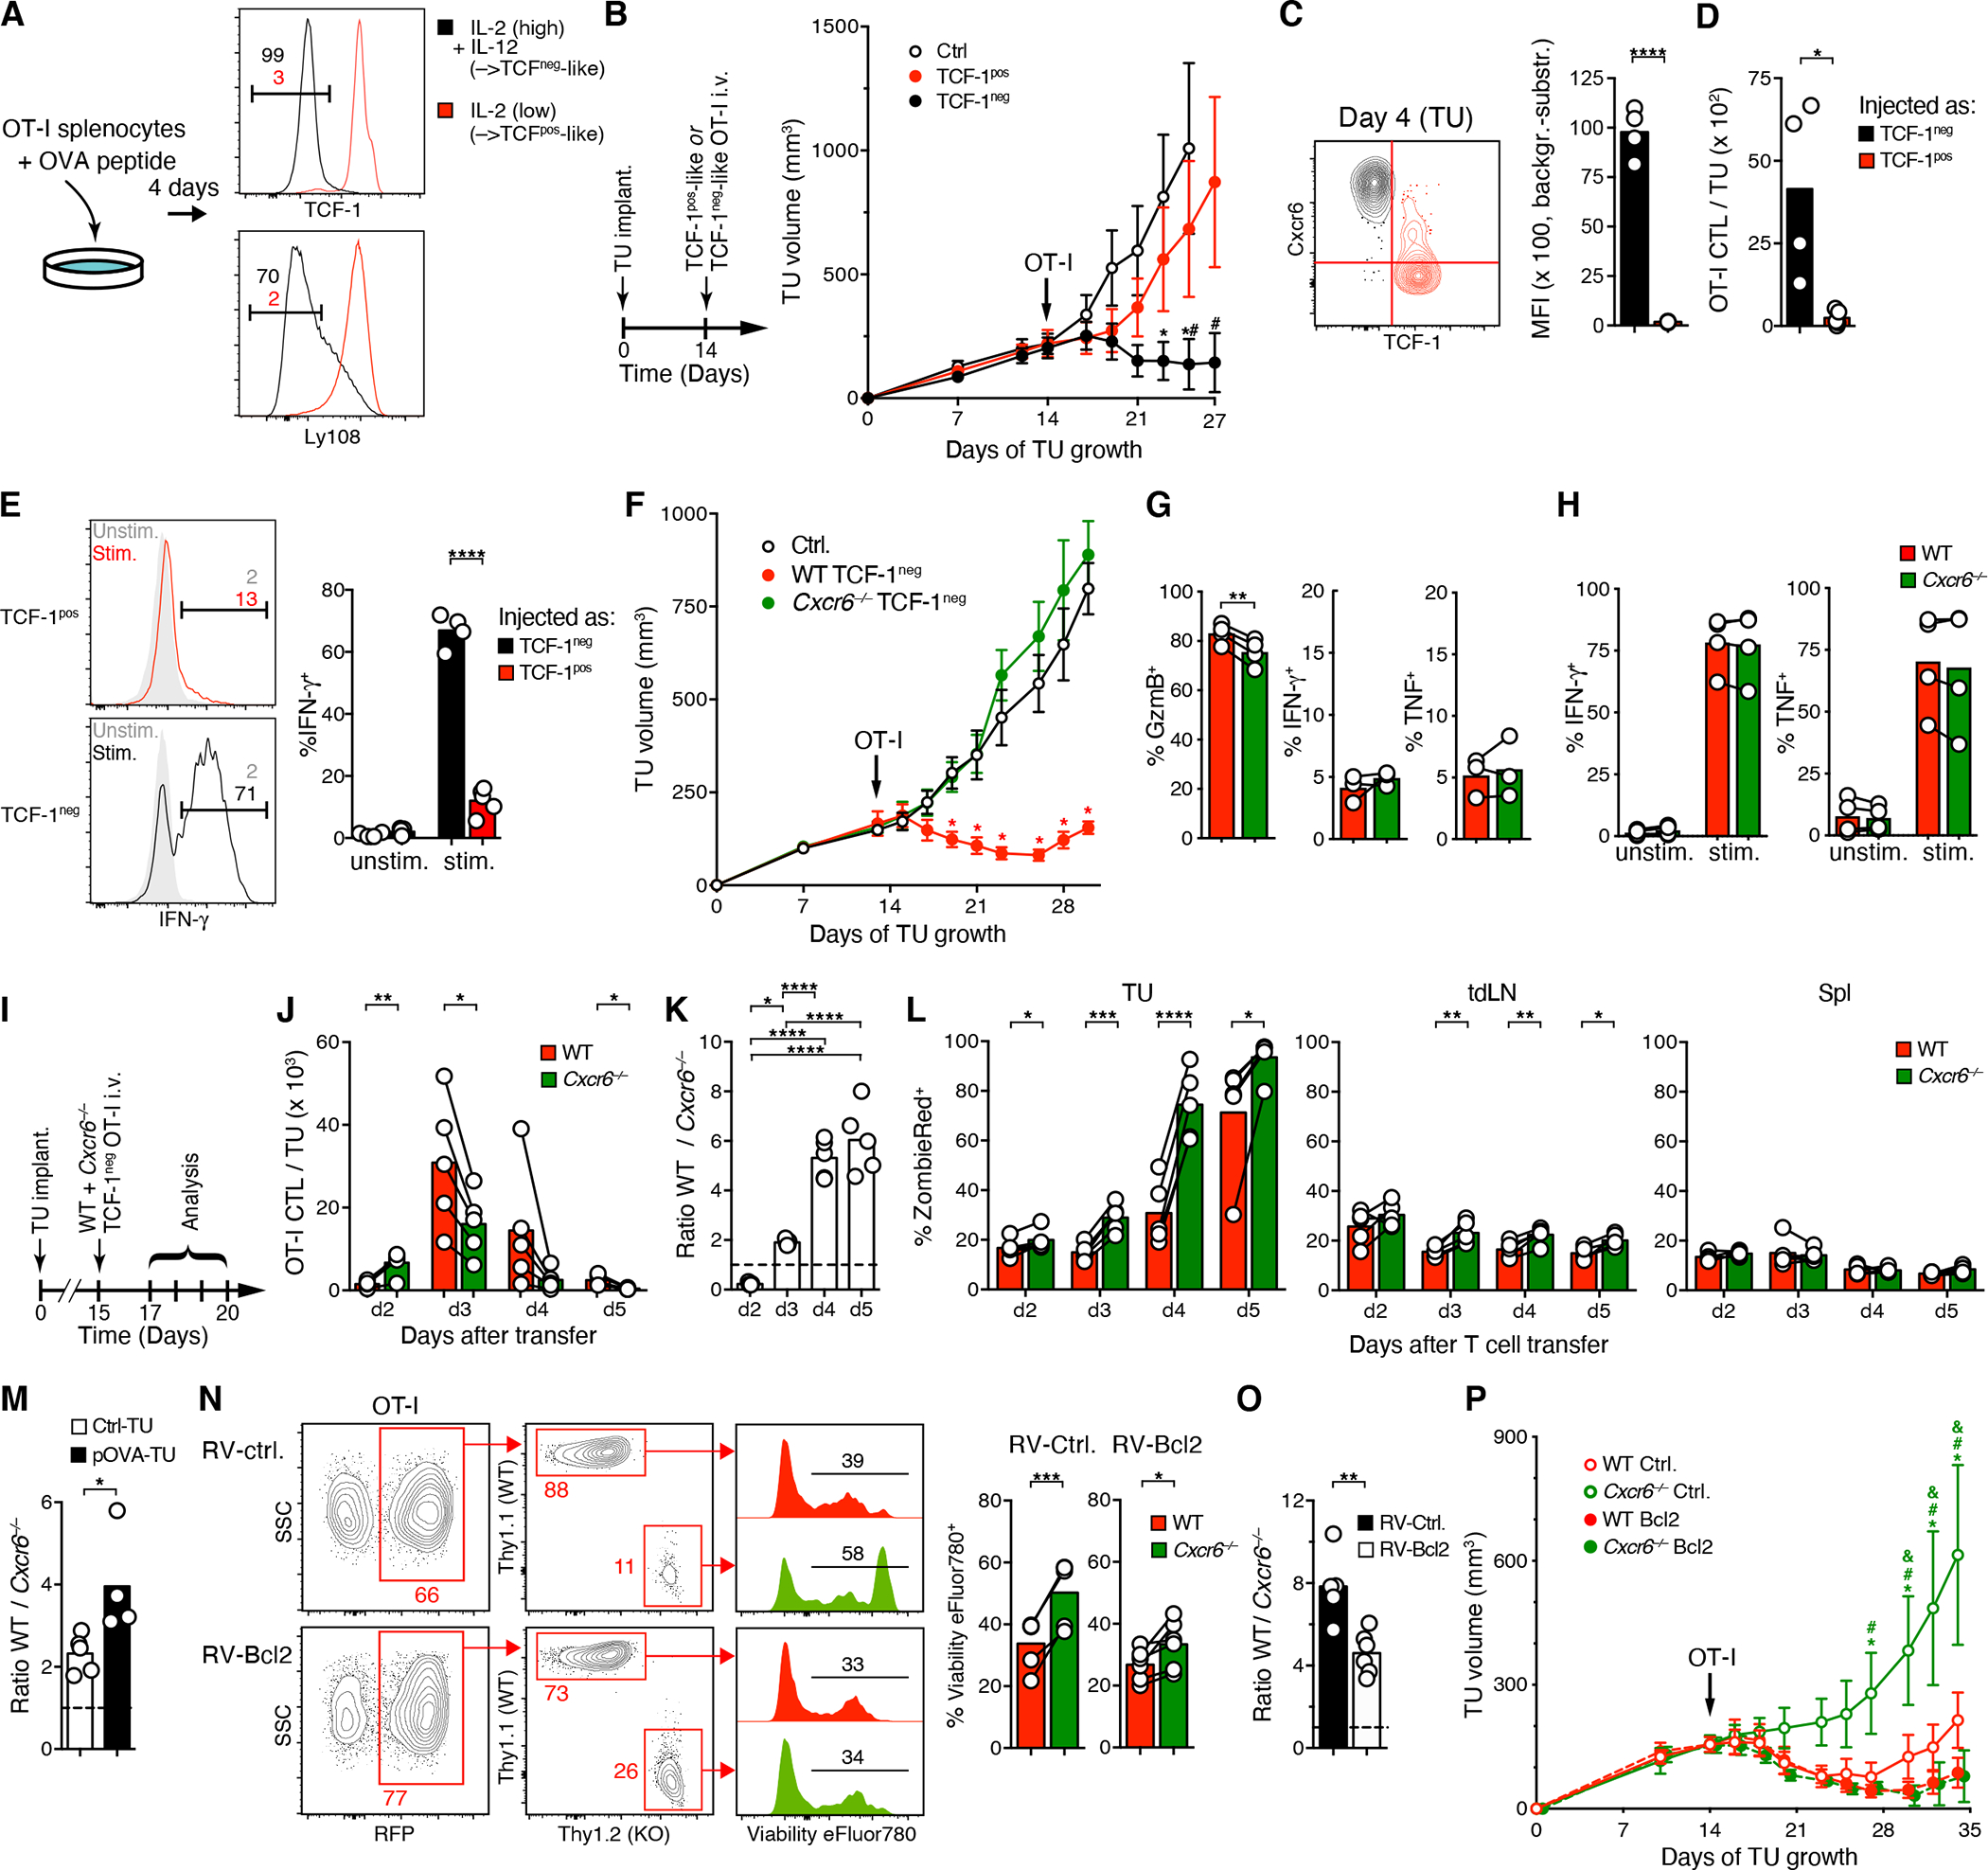
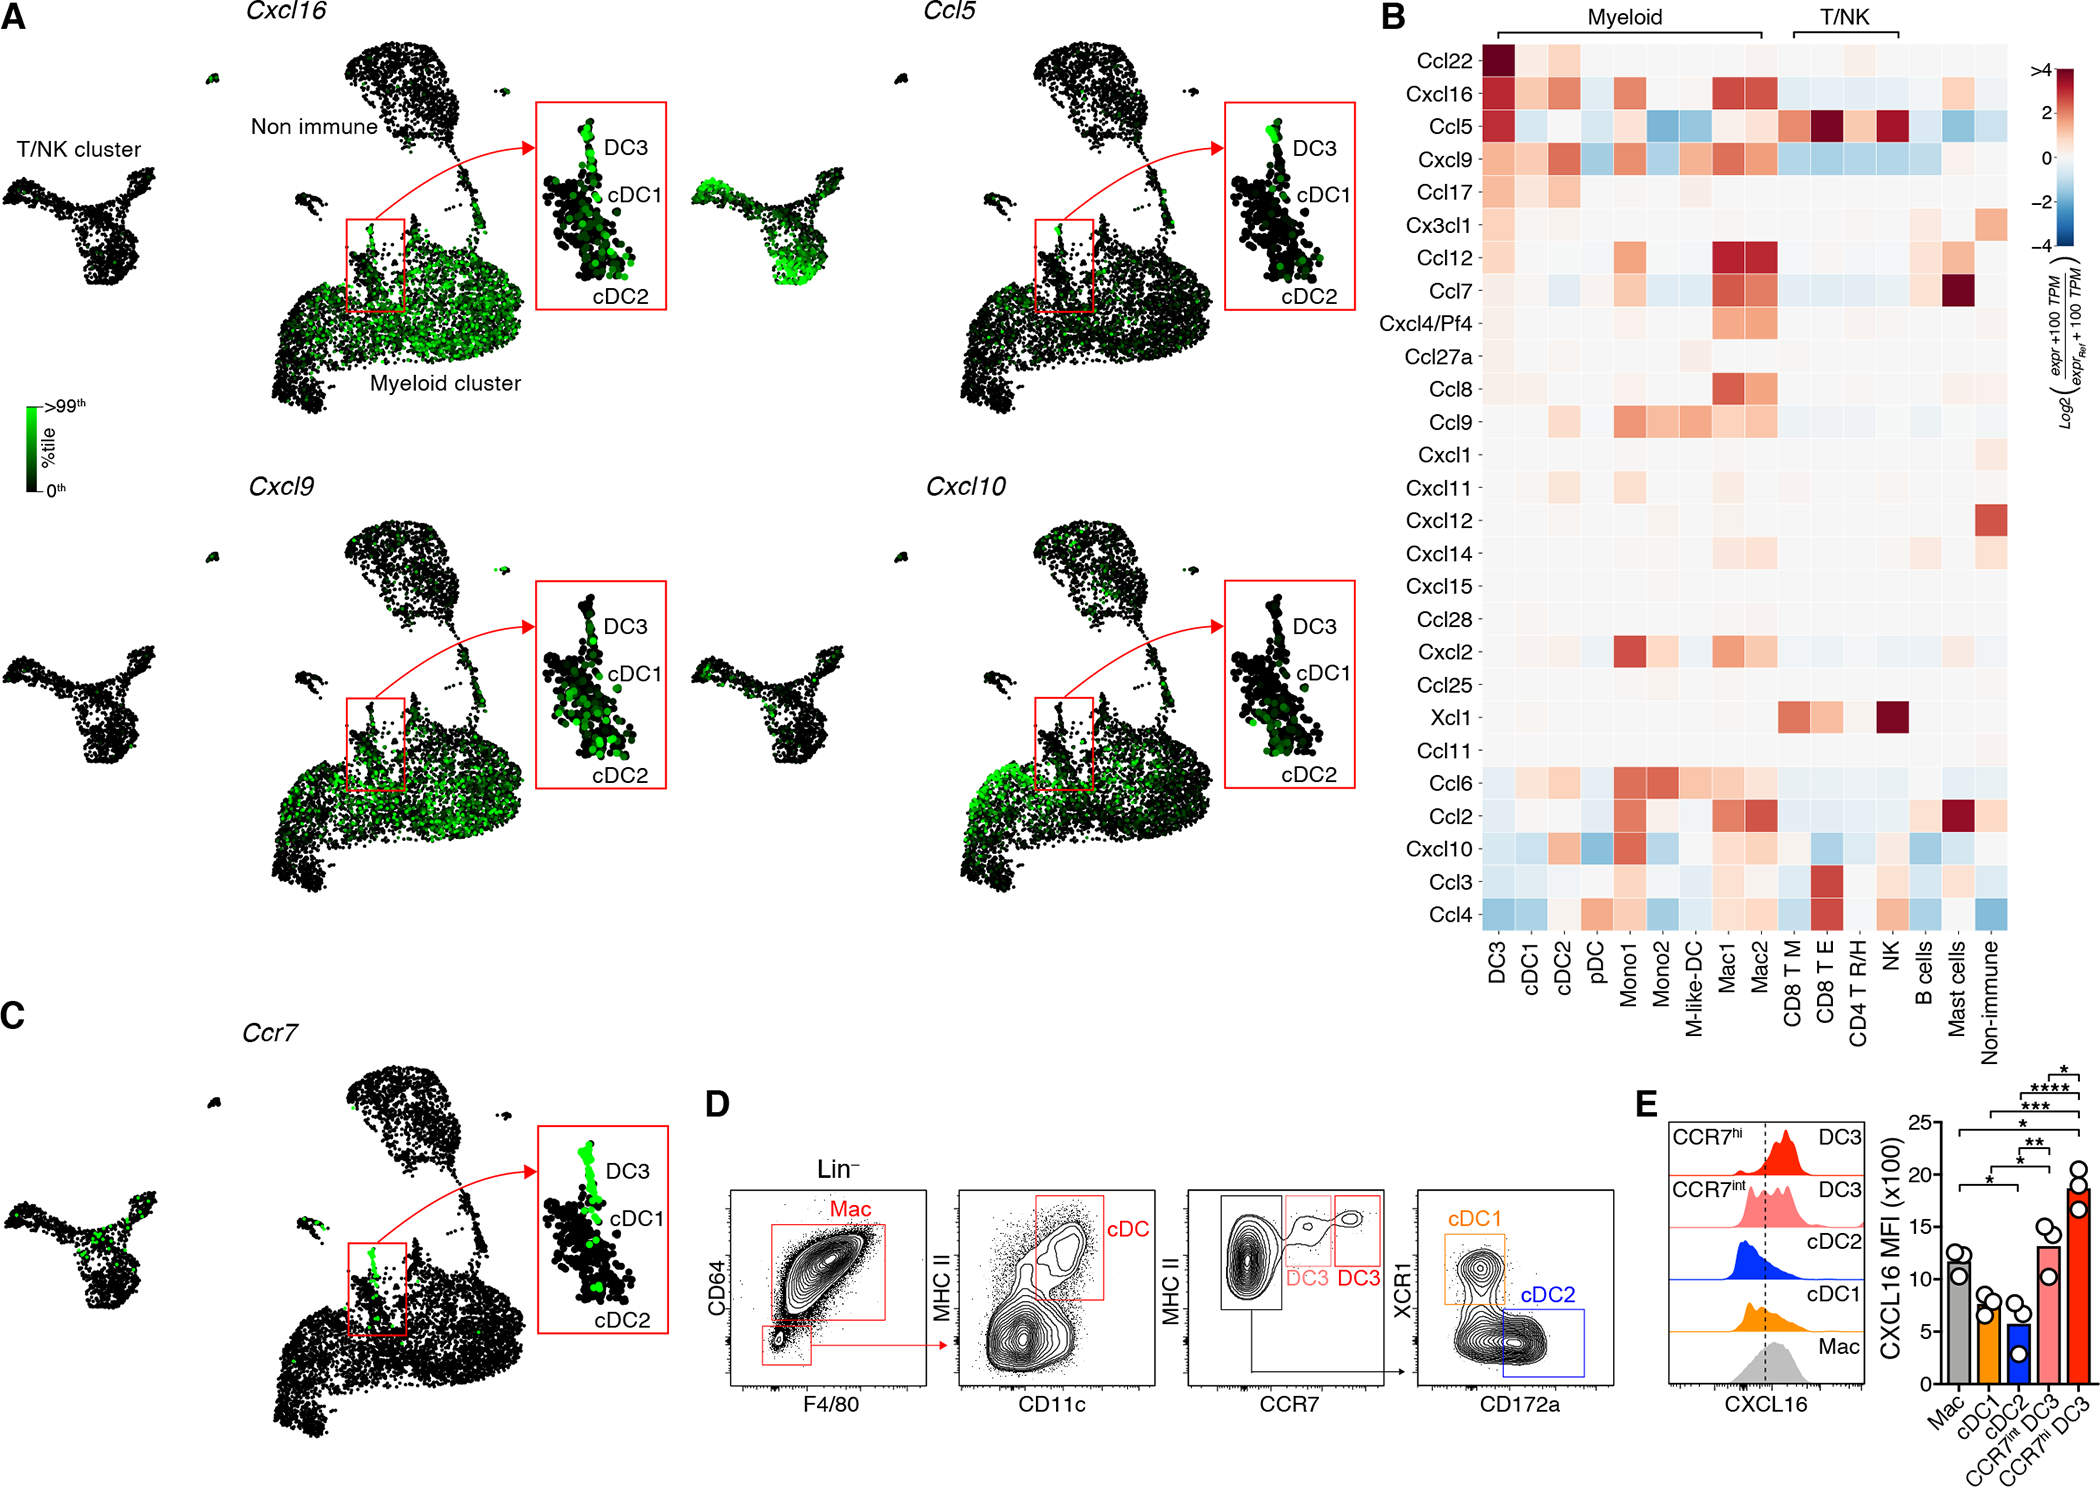
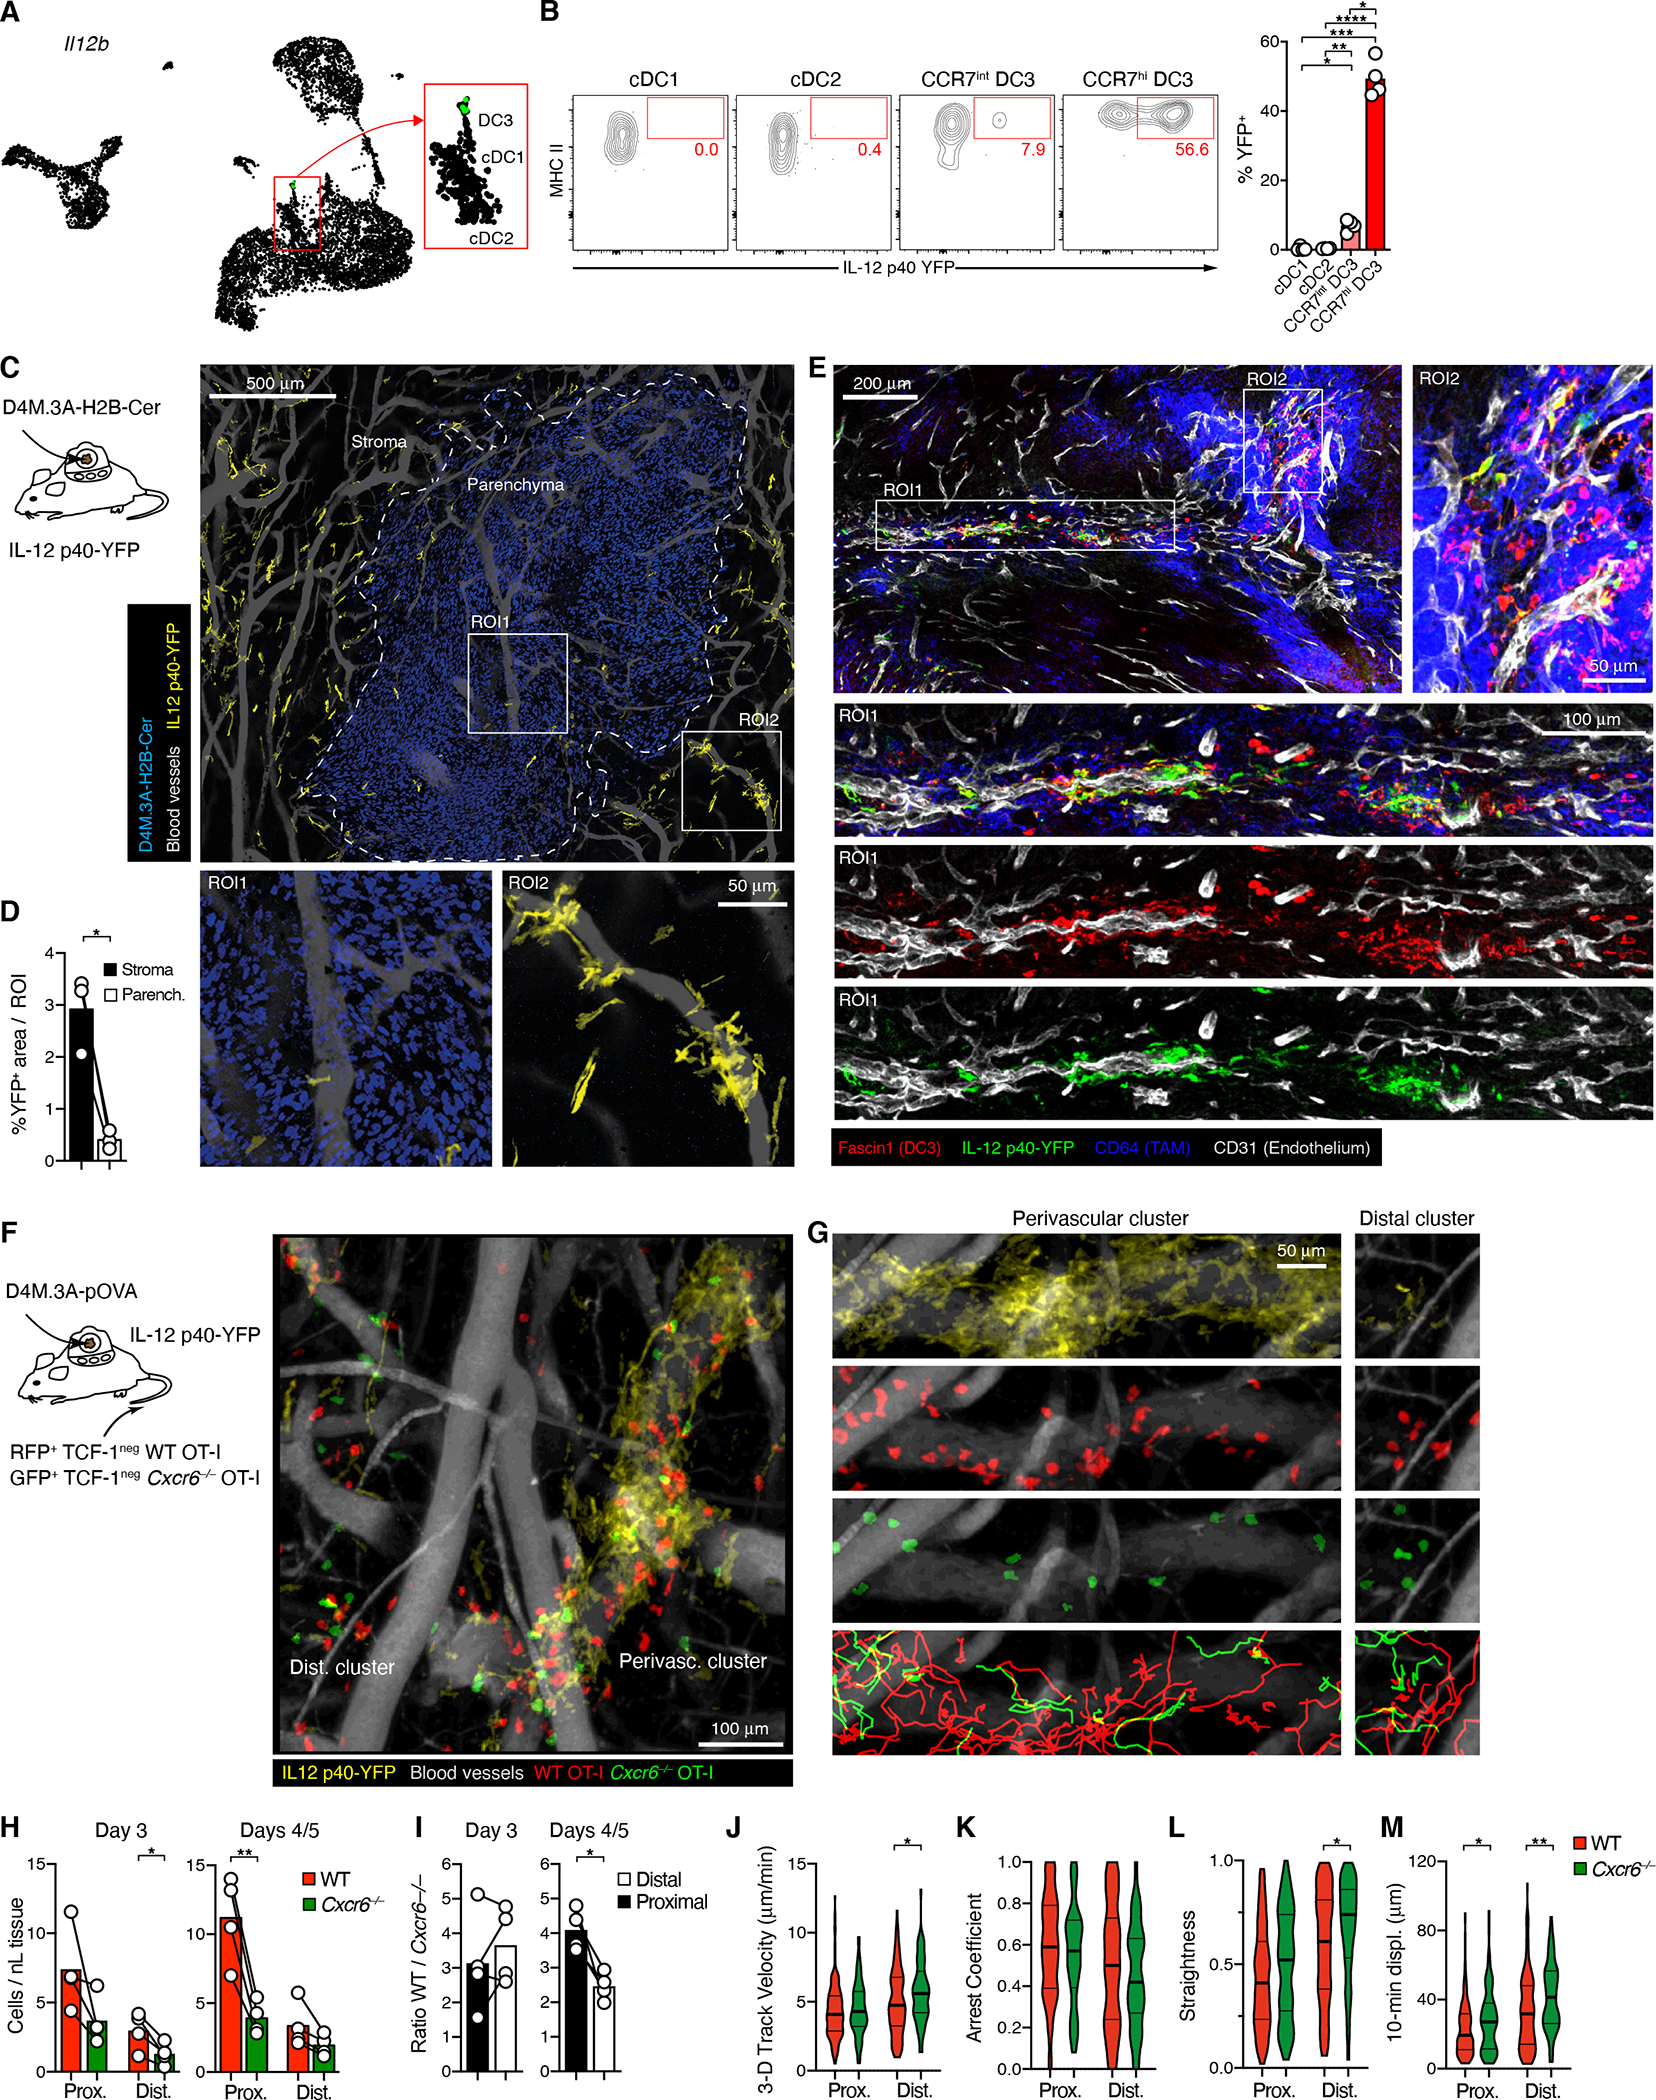
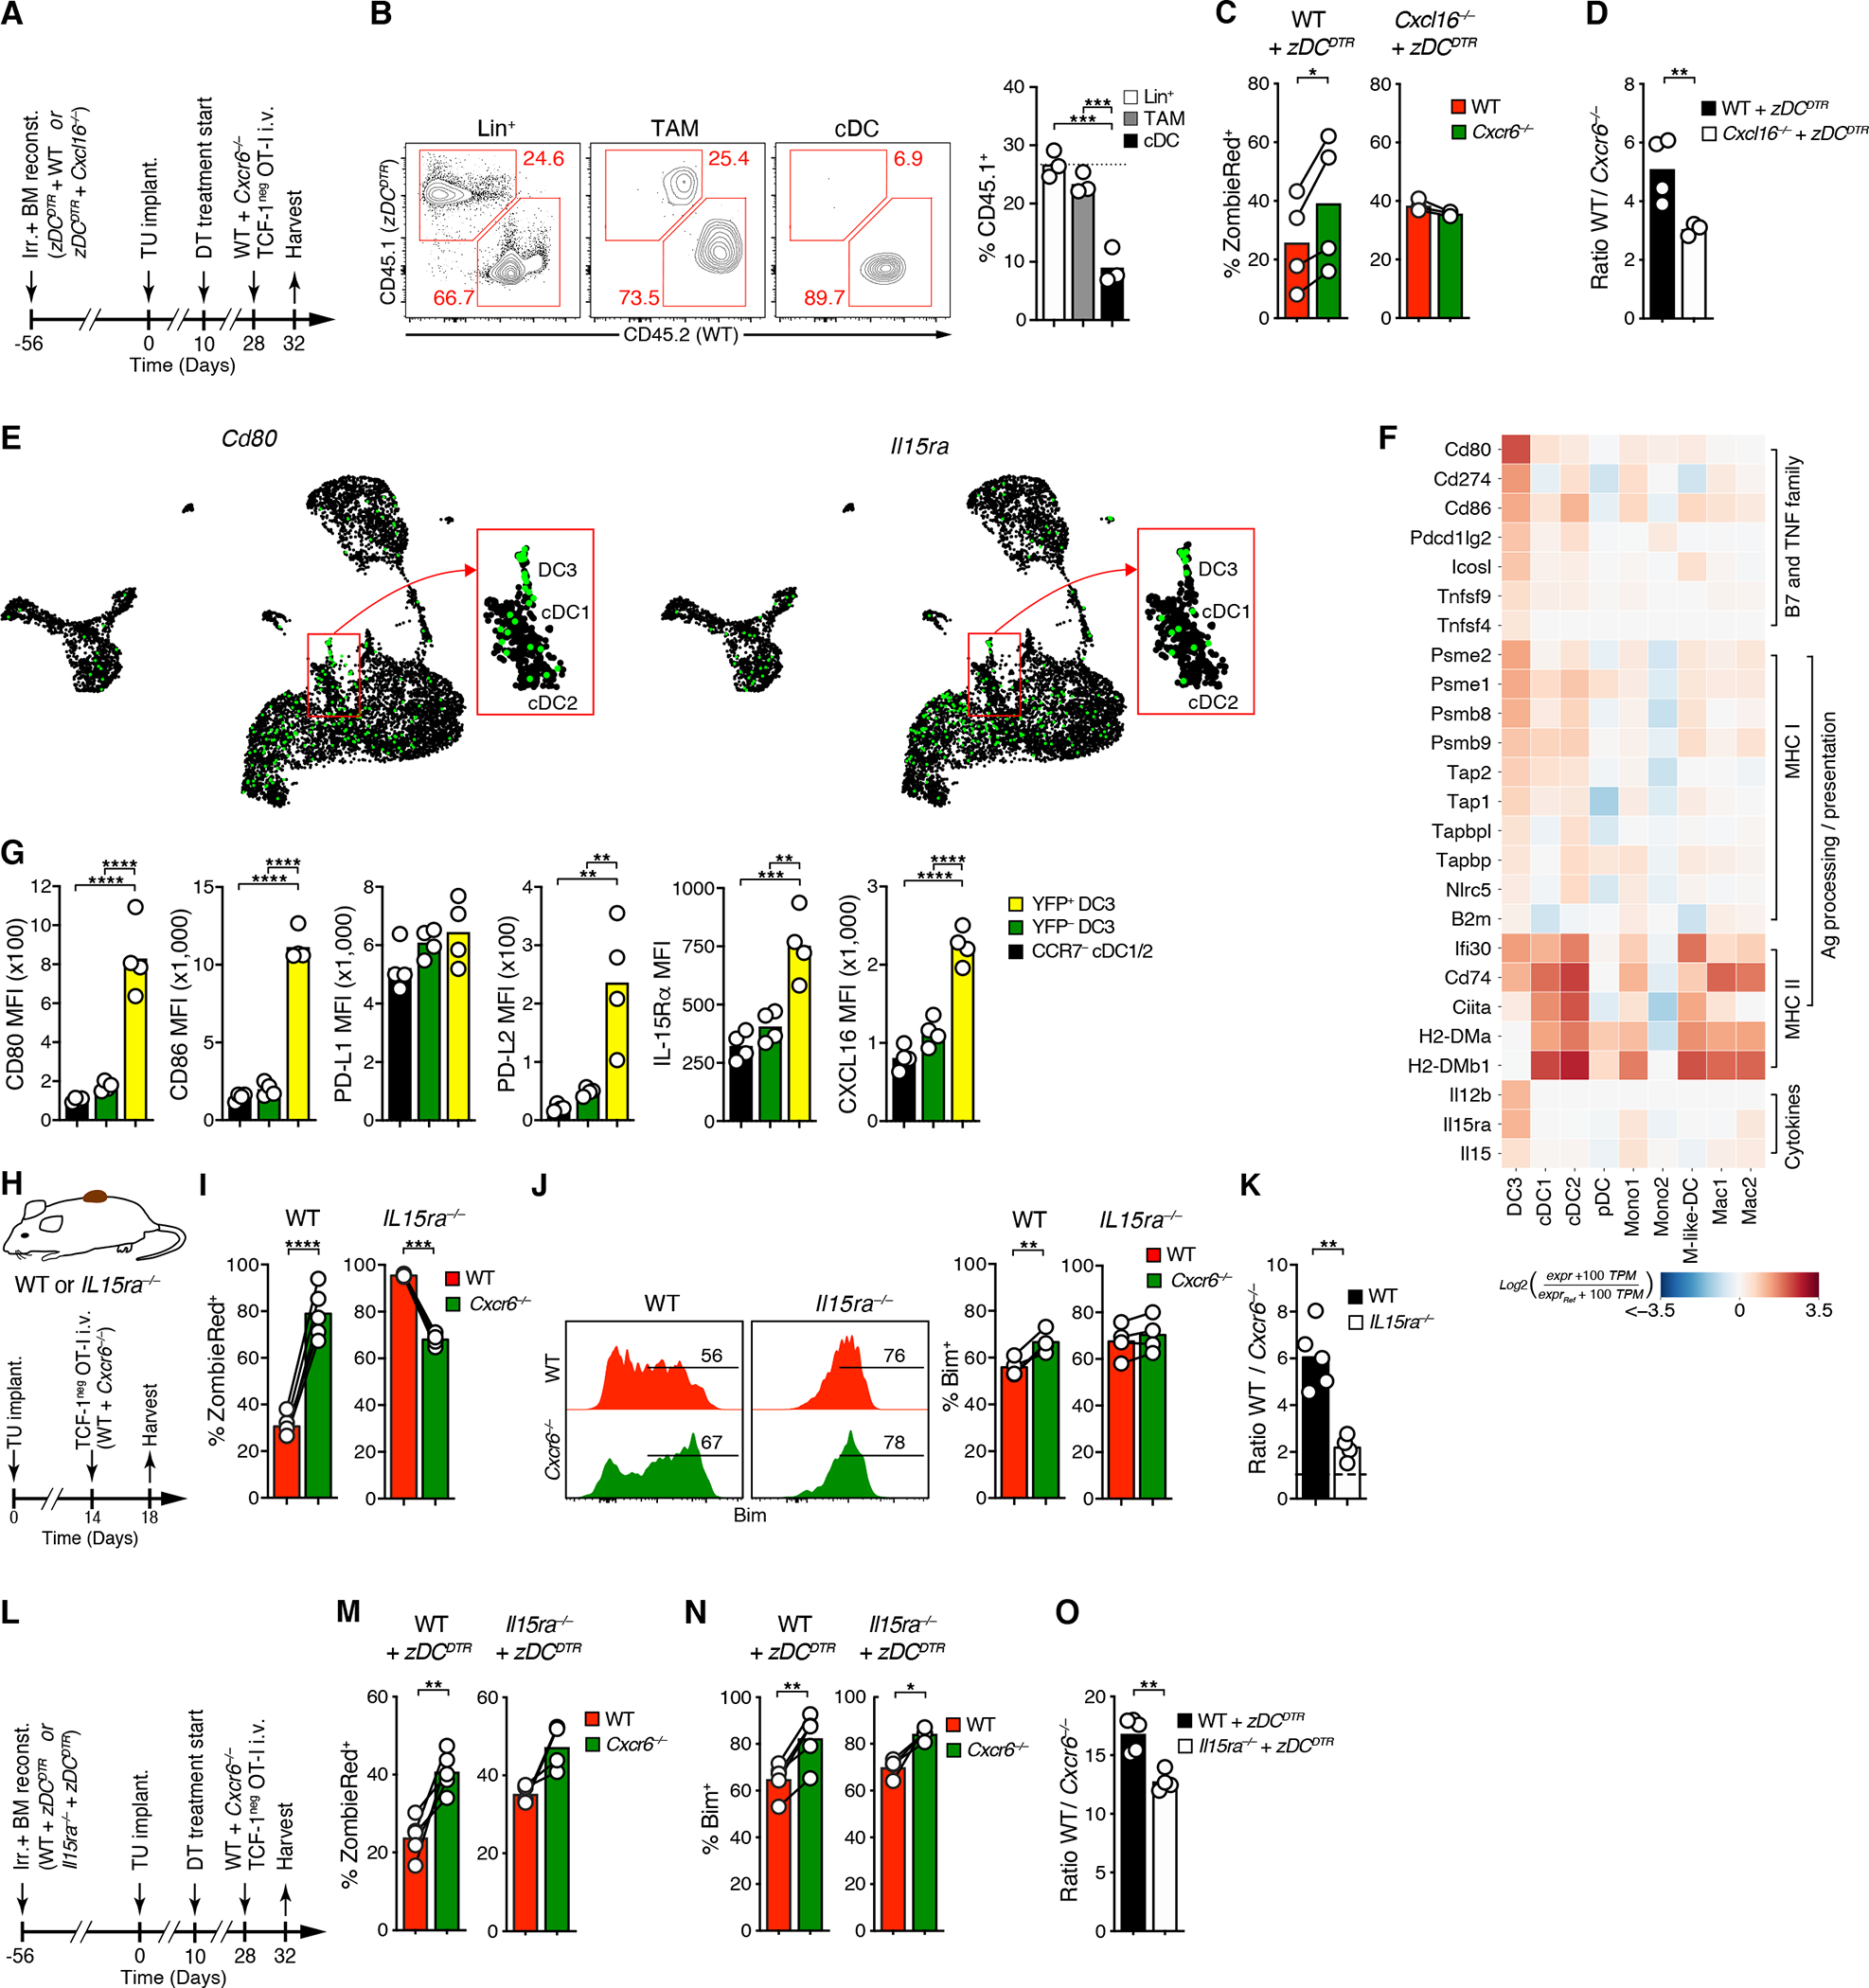
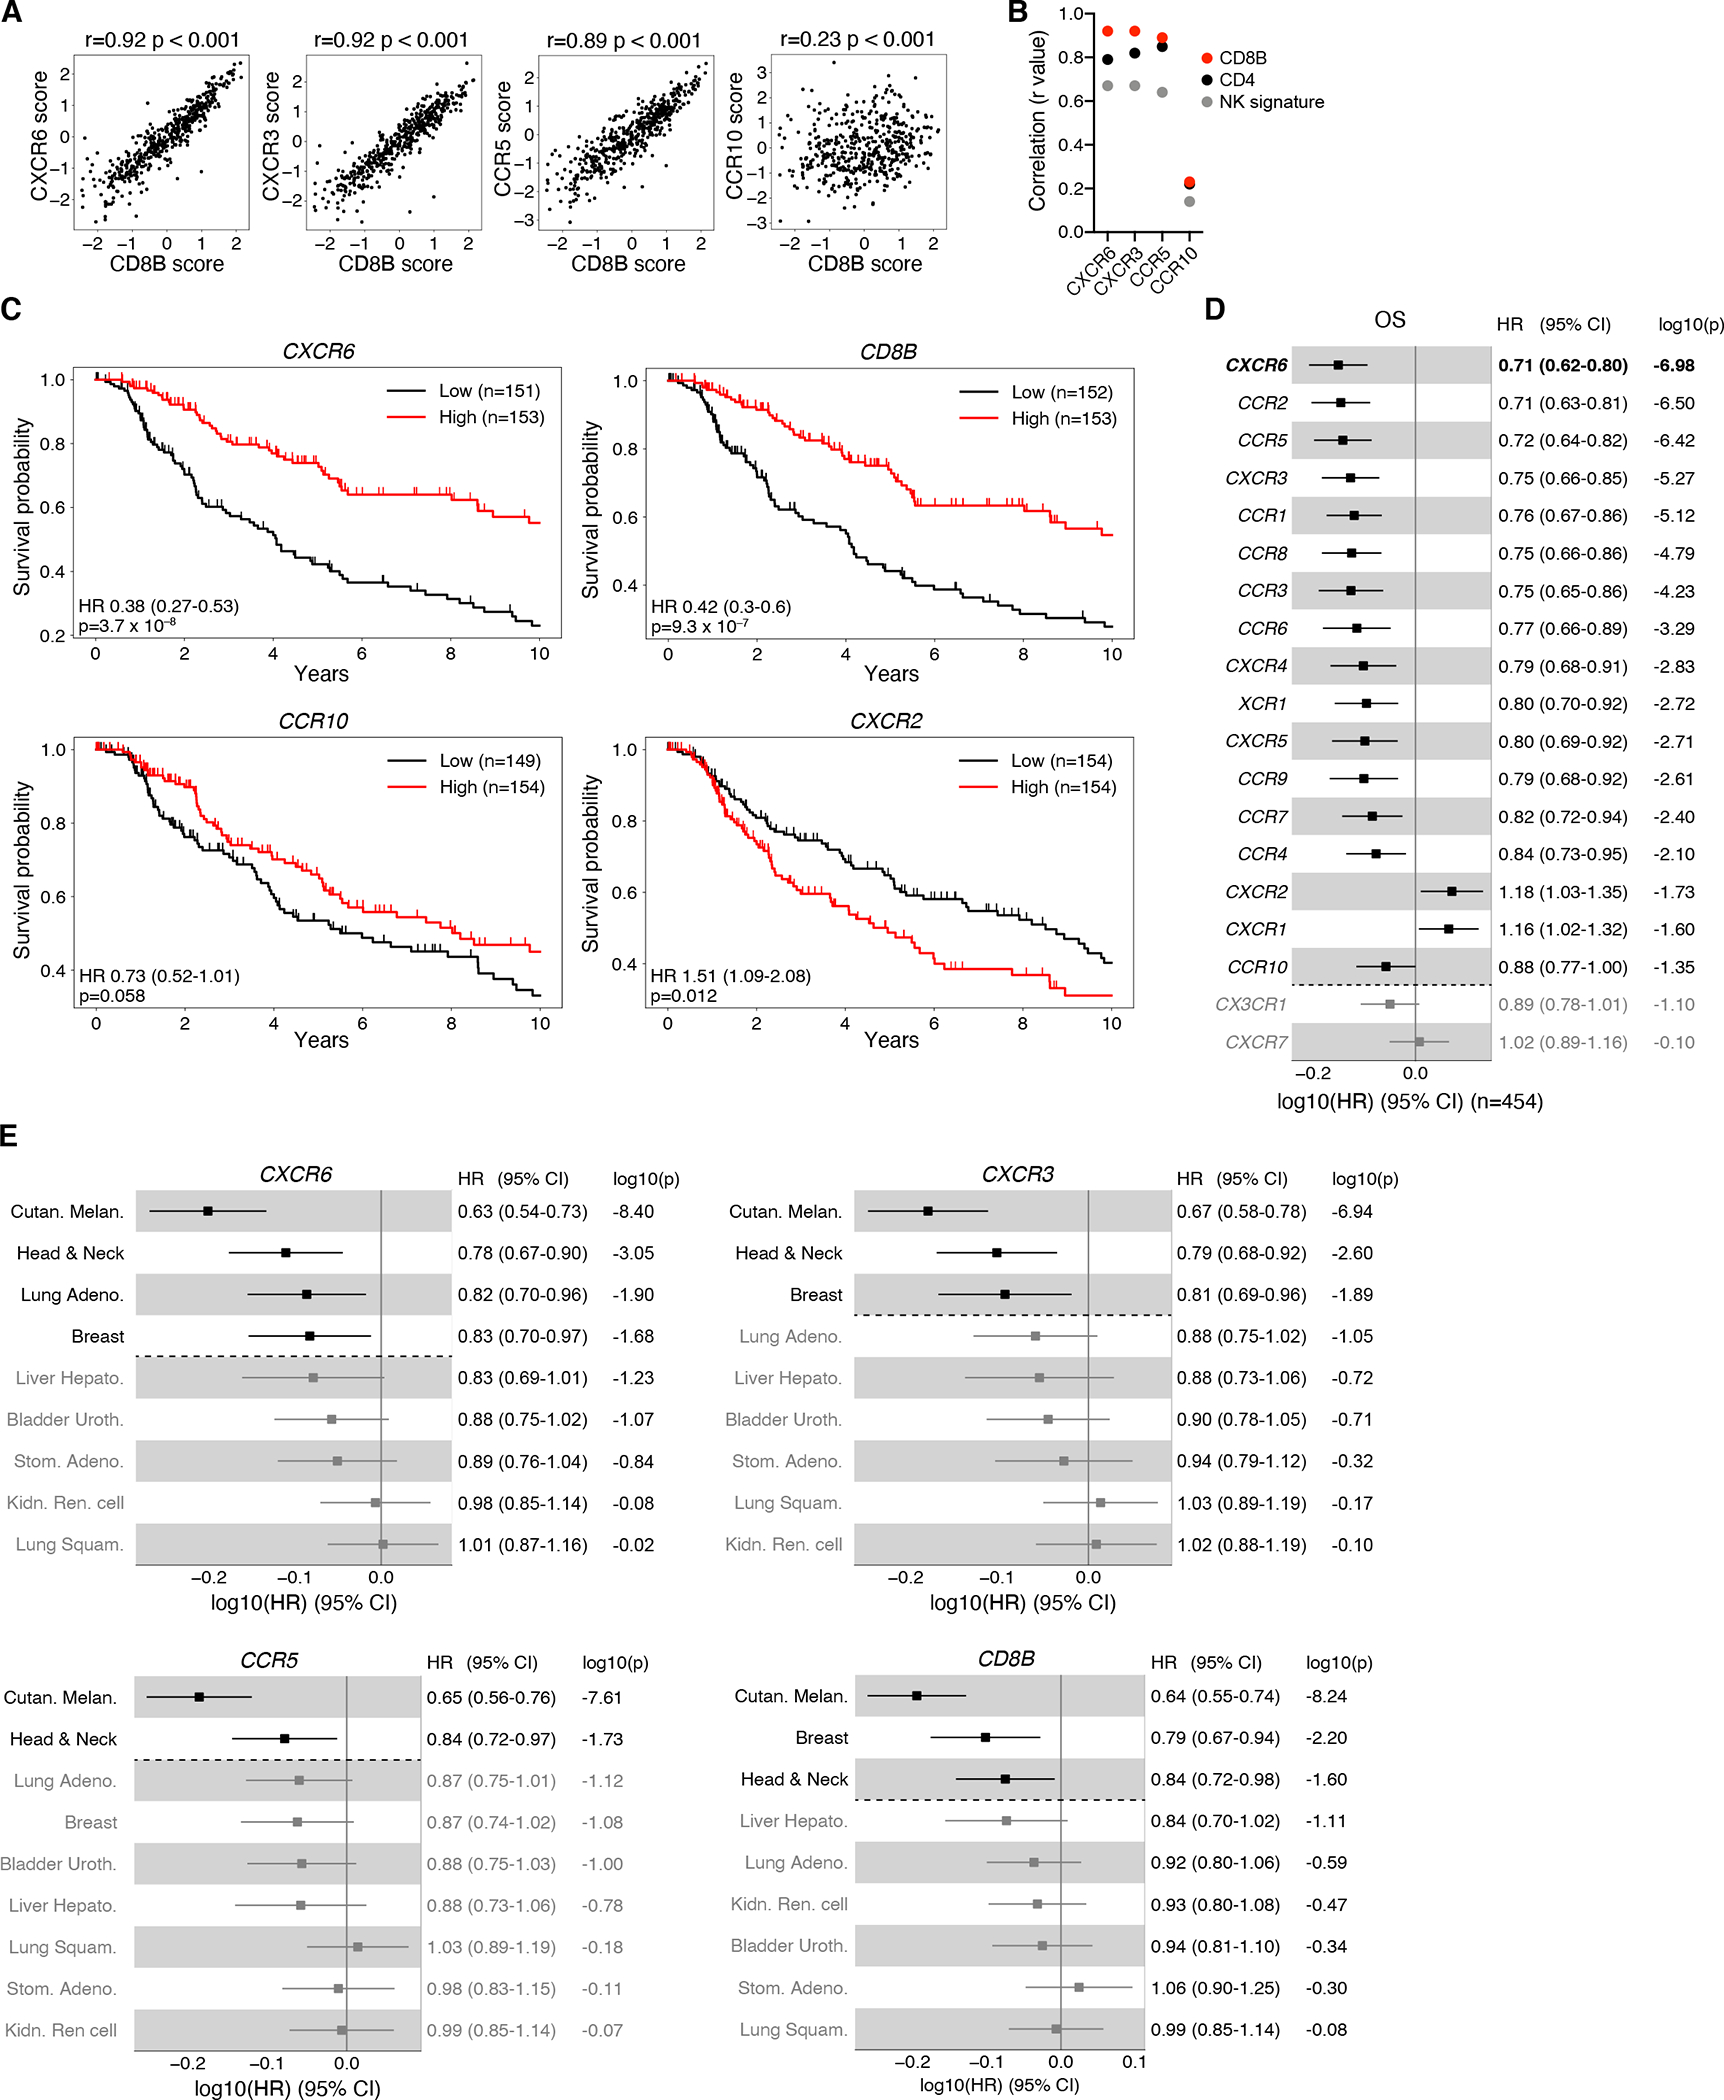
Cytotoxic T lymphocyte (CTL) responses against tumors are maintained by stem-like memory cells that self-renew but also give rise to effector-like cells. The latter gradually lose their anti-tumor activity and acquire an epigenetically fixed, hypofunctional state, leading to tumor tolerance. Here, we show that the conversion of stem-like into effector-like CTLs involves a major chemotactic reprogramming that includes the upregulation of chemokine receptor CXCR6. This receptor positions effector-like CTLs in a discrete perivascular niche of the tumor stroma that is densely occupied by CCR7+ dendritic cells (DCs) expressing the CXCR6 ligand CXCL16. CCR7+ DCs also express and trans-present the survival cytokine interleukin-15 (IL-15). CXCR6 expression and IL-15 trans-presentation are critical for the survival and local expansion of effector-like CTLs in the tumor microenvironment to maximize their anti-tumor activity before progressing to irreversible dysfunction. These observations reveal a cellular and molecular checkpoint that determines the magnitude and outcome of anti-tumor immune responses.

Keywords: CCR7(+) dendritic cells; CTL; CXCL16; CXCR6; IL-15; TCF-1; TCGA; multiphoton intravital microscopy; scRNA-seq; tumor microenvironment.


Conflict of interest statement

Declaration of interests S.K. has filed a patent application (PCT/EP2016/074644) related to the use of CXCR6-transduced T cells in tumor therapy. All other authors declare no competing interests.

Figures

Figure 1:
Figure 1:. CXCR6 is required for CTL-mediated tumor control
(A) scRNA-seq analysis of D4M.3A-pOVA melanoma expressing the SIINFEKL-peptide fused to histone H2B as a surrogate tumor neoantigen. CD45+ cells were separated from CD45 cells by FACS, recombined at a 9 to 1 ratio, and processed on the InDrops platform. (B, C) Expression of marker (A) and chemokine receptor genes (B) in the T/NK cluster. (D) Heatmap of chemokine receptor gene expression in all cell states. 100 TPM = average 100 transcripts per million of all cells. See Table S1B for numerical data underlying the heatmap. (E, F) PD-1 protein expression by TCF-1pos TIM-3 and TCF-1neg CTL in D4M.3A-pOVA tumors on 15 day (E) and over time (F). (G) PD-1 protein expression by TCF-1pos TIM-3 and TCF-1neg CTL in 15-day old D4M.3A-pOVA tumors implanted following depletion of endogenous CD8+ cells and transfer of 2.5 × 10⁶ CD45.1 congenic, purified naive CD8+ T cells. (H, I) Overlaid contour plots of chemokine receptor expression by pre-gated TCF-1pos (red) and TCF-1neg (black) PD-1+ (top) and PD-1 (bottom) CTL subsets from 18 days-old tumors. Red line indicates background fluorescence based on FMO controls (H). Background-corrected MFIs, note varying y-scales (I). (J) Growth of s.c. D4M.3A-pOVA tumors in the flanks of WT or Cxcr6−/− mice. (K) CXCR6 expression on tumor-infiltrating CD8+ (CTL), CD4+ Foxp3 (Th), CD4+ Foxp3+ (Treg), NKp46+ CD3 (NK), and B220+ cells (B). (L) Contribution of each cell type to total CXCR6 expression in the TME based on the product of cell frequency, % CXCR6+ cells, and CXCR6 MFI of CXCR6+ cells. (M) Growth of s.c. D4M.3A-pOVA tumors in CD8+ T cell-depleted WT or Cxcr6−/− mice. (N-O) Ratios of CD45.1+ WT to CD45.2+ KO total CD8+ T cells in various tissues (N) and in the TCF-1pos CX3CR1, TCF-1neg CX3CR1, and TCF-1neg CX3CR1+ subsets of both PD-1+ and PD-1 tumor-infiltrating CTL (O) when s.c. D4M.3A-pOVA tumors reached a size >150 mm3 in Cxcr6−/− × WT −> WT BMCs. Data in (E), (G-O) represent at least two independent replicates with similar results. Graphs show means and either individual replicates or ±SEM. */**/***/**** = p<0.05/0.01/0.001/0.0001.
Figure 2:
Figure 2:. Expansion of highly proliferative effector-like CTL in the TME requires CXCR6
(A-C) Celltrace Far Red (CTFR)-labeled naive Thy1.1+ CD45.1+ WT OT-I and Thy1.2+ CD45.1+ Cxcr6−/− OT-I (2 × 10⁶ cells of each) were i.v. injected into CD45.2 hosts with 14 days-old D4M.3A-pOVA tumors. Proliferation (B, C), CD69 and CD25 expression (C) of OT-I cells in tdLNs after 48 h. (D-F) Frequencies (D), numbers (E), and TIM-3 expression (F) of TCF-1pos and TCF-1neg OT-I in tdLNs (top) and tumors (bottom) 5 to 21 days following co-injection of 105 naive WT and Cxcr6−/− OT-I cells (G-I) Frequencies (G, H) and numbers (I) of indicated subsets of WT and Cxcr6−/− OT-I CTL in tdLNs or tumors. (J, K) Expression of Ki67 (J) and Bcl-2 (K) in subsets defined in (G) on day 21. (L, M) Ex vivo uptake of viability dye ZombieRed by subsets defined in (G). Data in (D-M) represent at least two independent replicates with similar results. Graphs show means and either individual replicates or ±SEM. */**/***/**** = p<0.05/0.01/0.001/0.0001.
Figure 3:
Figure 3:. CXCR6 supports survival of TCF-1neg CTL in the TME to enable their anti-tumor activity
(A) Culture of peptide-activated WT or Cxcr6−/− OT-I splenocytes in low rIL-2 (5 ng/ml) or in high rIL-2 (20 ng/ml) and rIL-12 (10 ng/ml) to generate TCF-1pos-like or TCF-1neg-like OT-I CTL, respectively. (B) D4M.3A-pOVA tumor growth following i.v. injection of 106 TCF-1pos-like or TCF-1neg-like OT-I CTL. (C) Overlaid contour plots of CXCR6 expression on tumor-infiltrating OT-I cells 4 days after injection of TCF-1pos-like (red, gated on cells that remained TCF-1pos) or TCF-1neg-like (black) cells into tumor-bearing mice on day 14. (D, E) Frequency (D) and ex vivo-stimulated IFN-γ expression (E) of the same cells as shown in (C). (F) Growth of D4M.3A-pOVA tumors following i.v. injection on day 13 of 106 either WT or Cxcr6−/−TCF-1neg-like OT-I as generated in (A) or in non-injected animals (Ctrl.). (G, H) In situ-expression of Granzyme B, IFN-γ, and TNF (G) and ex vivo-stimulated expression of IFN-γ and TNF (H) by tumor-infiltrating OT-I cells on day 4 following i.v. injection of TCF-1neg-like cells, as described for (F). (I-L) WT and Cxcr6−/− TCF-1neg-like OT-I cells were co-injected into tumor-bearing mice on day 15 and their respective frequencies and ratios in tumor tissue (J and K) and their ex vivo uptake of the viability dye ZombieRed by cells in tumors, tdLNs, and spleens (L) were assessed at the indicated time-points thereafter. (M) Ratios of tumor-infiltrating CTL 4 days after injection of WT and Cxcr6−/− TCF-1neg-like OT-I cells (106) into animals implanted with either D4M.3A-pOVA or D4M.3A tumors into their flanks. (N, O) WT and Cxcr6−/− TCF-1neg-like OT-I cells were retrovirally transduced to express either Bcl-2 and mRFP (RV-Bcl2) or RFP only (RV-ctrl.) and co-injected into tumor-bearing animals on day 14. Four days later, tumor-infiltrating cells were examined for ex vivo uptake of the viability dye Viability eFluor 780 (N) and their input-corrected ratios (O). (P) Same cells as described for use in (N, O) were injected into separate tumor-bearing animals and tumor growth was monitored. *, #, and & = p<0.05 vs. WT Bcl2, Cxcr6−/− Bcl2, and WT Ctrl., respectively. Data in A to M represent at least two independent replicates with similar results. Graphs show means and either individual replicates or ±SEM. */**/***/**** = p<0.05/0.01/0.001/0.0001 in all graphs except for (B), (F), and (P).
Figure 4:
Figure 4:. The CXCR6 ligand CXCL16 is most highly expressed by the CCR7+ DC3 state
(A-C) Single-cell expression of Cxcl16, Ccl5, Cxcl9, and Cxcl10 (A), of CCR7 (C), and heatmap of chemokine gene expression (B) in D4M.3A-pOVA tumors (Neutrophils not shown). See Table S1C for numerical data underlying the heatmap. (D, E) Total (intracellular and cell surface) expression of CXCL16 protein in APC types. (D, E) represent two independent replicates with similar results. Graphs show means and individual replicates. */**/***/**** = p<0.05/0.01/0.001/0.0001.
Figure 5:
Figure 5:. CXCR6 promotes CTL interactions with perivascular clusters of DC3
(A) Single-cell expression of Il12b in D4M.3A-pOVA tumors. (B) Expression of YFP in cDC subsets in 18 days-old tumors in IL-12 p40-YFP reporter mice. (C) Distribution of YFP+ DC3 in D4M.3A-pOVA-H2B-Cerulean tumors in DSFCs installed on IL-12 YFP reporter mice, as recorded by MP-IVM following injection with QTracker 655 to visualize perfused blood vessels. The image is a collage of 20 individual image stacks. ROIs show representative regions illustrating the characteristic distribution of YFP+ DC3 in tumor parenchyma (ROI1) and stroma (ROI2). (D) % of area occupied by YFP+ cells in stroma vs. parenchyma (E) Immuno-stained sections of D4M.3A-pOVA flank tumors 3 days after i.v. injection of CD45.1+ TCF-1neg OT-I into IL-12 p40-YFP reporter mice. Magnified ROIs illustrate overlap of YFP and Fascin1 signal. (F, G) Migratory behavior of Cxcr6−/− (Green) and WT (Red) TCF-1neg OT-I CTL in the stroma of D4M.3A-pOVA tumors visualized in DSFCs installed on IL-12 p40 YFP mice. (G) shows DC3 (yellow), WT CTL, KO CTL, and WT and KO CTL migratory tracks (bottom) in ROIs selected for the accumulation of T cells near perivascular DC3 clusters (left) or around smaller DC3 clusters distal to venular vessels (right). (H, I) Densities (H) and input-corrected ratios (I) of WT and Cxcr6−/− CTL proximal and distal to perivascular DC3 on day 3 (left) or days 4 and 5 (right) after CTL i.v. injection. (J-M) Median 3D migratory velocities (J), Arrest coefficients (K), Track straightness coefficients (L), and 10-min displacement coefficients (M) of 422 WT and 182 Cxcr6−/− CTL in 4 recordings from two independently performed experiments. Data in B, D represent two and three independent experiments with similar results. Graphs in B, D, H, and I show means and individual replicates, J-M represent medians and quartiles. */**/**** = p<0.05/0.01/0.0001.
Figure 6:
Figure 6:. DC3 trans-present IL-15, a critical survival signal for effector-like CTL in the TME
(A) Experimental protocol (B) Selective depletion of cDC upon DT treatment of WT : zDCDTR −> WT mixed BMCs (C, D) Ex vivo ZombieRed uptake (C) and ratios (D) of tumor-infiltrating WT and Cxcr6−/− TCF-1neg OT-I CTL (E, F) Single-cell expression of Cd80 and Il15ra and (E) heatmap analysis of indicated transcripts in the D4M.3A-pOVA TME, ranked within indicated groups (F). See Table S1D for numerical data underlying the heatmap. (G) Expression of indictated proteins by CCR7 cDC, YFP, and -YFP+ DC3 in D4M.3A-pOVA tumors in IL-12 p40 YFP mice. (H-K) Ex vivo uptake of ZombieRed (I), expression of Bim (J), and ratios (K) of WT and Cxcr6−/− TCF-1neg OT-I cells in D4M.3A-pOVA tumors in WT or Il15ra−/− hosts. (L-O) Same as for (I-K), but following CTL injection into DT-treated Il15ra−/− : zDCDTR −> WT or WT : zDCDTR −> WT mixed BMCs Graphs in B-D, G, I-K, and M-O show means and individual replicates. */**/***/**** = p<0.01/0.001/0.0001.
Figure 7:
Figure 7:. CXCR6 expression predicts survival in human cancer patients
(A) Correlation between chemokine receptor and CD8B expression scores in tumor tissue of 469 TCGA melanoma (SKCM) patients. Spearman’s rank-correlation coefficient r and two-sided P value are shown. (B) Summary of rank-correlation coefficients between indicated chemokine receptors and CD8B, CD4, or NK signature (NCR1 and SH2D1B) expression scores. (C) Kaplan-Meier estimates of overall survival comparing the top (“High”) and bottom (“Low”) third of melanoma patients with regard to expression scores of indicated genes. Hazard ratios (HR), 95% confidence intervals (CI), and P values (Wald Chi-Squared test) based on univariate Cox proportional-hazards model (High versus Low). Tick marks indicate censoring. (D) Association between overall survival and continuous expression score of individual chemokine receptor genes in melanoma patients. HR, 95% CI, and P values (Wald Chi-Squared test) based on univariate Cox proportional-hazards model. Note: a HR of e.g. 0.71 (CXCR6) indicates that at any time during the TCGA melanoma study period patients had a 1–0.71 = 0.29 = 29% reduction in risk of death per one standard deviation increase of normalized log2 transformed CXCR6 expression + pseudo count. (E) Association between overall survival and continuous expression score of indicated genes in all indicated cancer types, adjusted for Sex (versus Male) and AJCC pathologic tumor stage (versus Stage 0 & I). Significant (P < 0.05) associations shown in black in (D, E).

Comment in

References

    1. Akbani R, Akdemir KC, Aksoy BA, Albert M, Ally A, Amin SB, Arachchi H, Arora A, Auman JT, Ayala B, et al. (2015). Genomic Classification of Cutaneous Melanoma. Cell 161, 1681–1696. - PMC - PubMed
    1. Apetoh L, Smyth MJ, Drake CG, Abastado J-P, Apte RN, Ayyoub M, Blay J-Y, Bonneville M, Butterfield LH, Caignard A, et al. (2015). Consensus nomenclature for CD8(+) T cell phenotypes in cancer. Oncoimmunology 4, e998538. - PMC - PubMed
    1. Ariotti S, Beltman JB, Borsje R, Hoekstra ME, Halford WP, Haanen JBAG, de Boer RJ, and Schumacher TNM (2015). Subtle CXCR3-Dependent Chemotaxis of CTLs within Infected Tissue Allows Efficient Target Localization. J. Immunol. 195, 5285–5295. - PubMed
    1. Best JA, Blair DA, Knell J, Yang E, Mayya V, Doedens A, Dustin ML, Goldrath AW, Monach P, Shinton SA, et al. (2013). Transcriptional insights into the CD8 + T cell response to infection and memory T cell formation. Nat. Immunol. 14, 404–412. - PMC - PubMed
    1. Binnewies M, Mujal AM, Pollack JL, Combes AJ, Hardison EA, Barry KC, Tsui J, Ruhland MK, Kersten K, Abushawish MA, et al. (2019). Unleashing Type-2 Dendritic Cells to Drive Protective Antitumor CD4 + T Cell Immunity. Cell 177, 556–571.e16. - PMC - PubMed

Publication types