. 2021 Sep 14;54(9):1948-1960.e5.
doi: 10.1016/j.immuni.2021.07.001. Epub 2021 Aug 2.

Protein kinase R and the integrated stress response drive immunopathology caused by mutations in the RNA deaminase ADAR1

Affiliations

Protein kinase R and the integrated stress response drive immunopathology caused by mutations in the RNA deaminase ADAR1

Megan Maurano et al. Immunity. .

Abstract

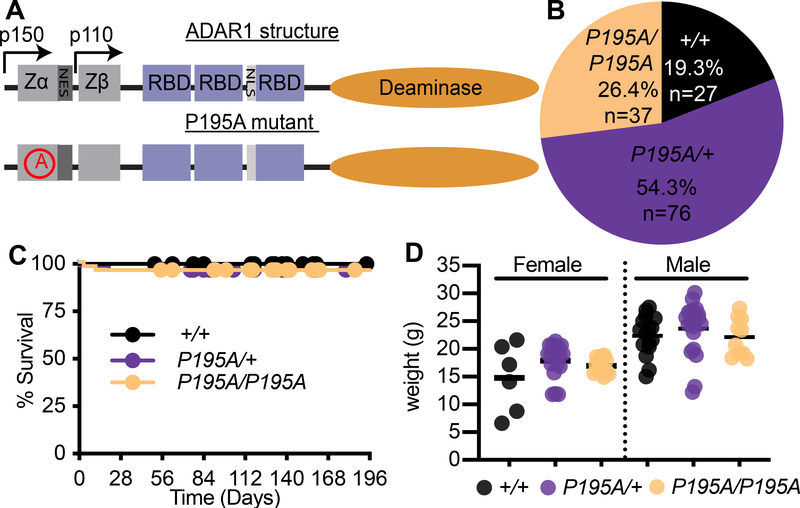
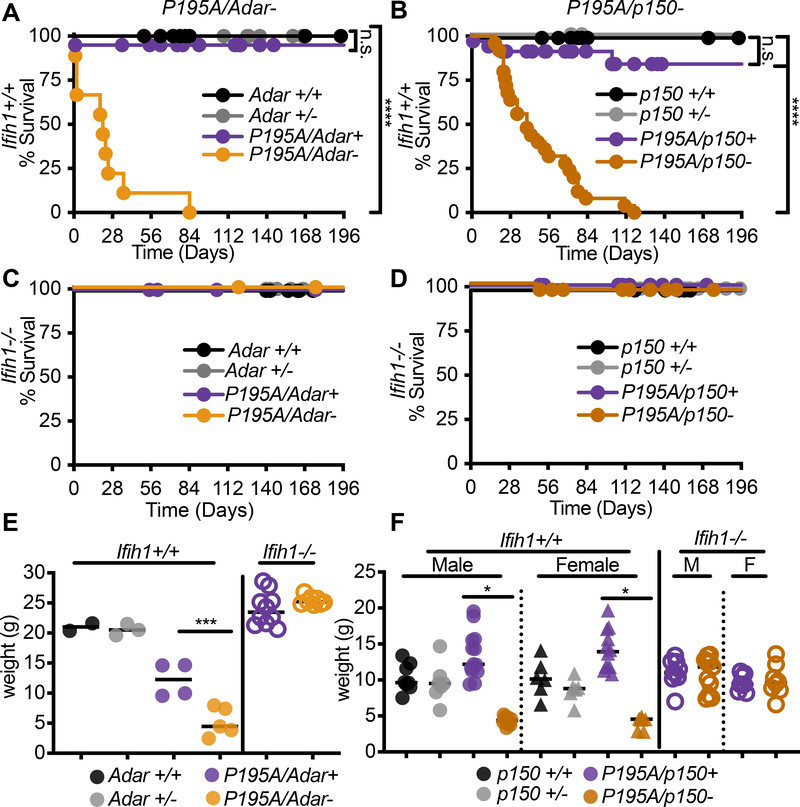
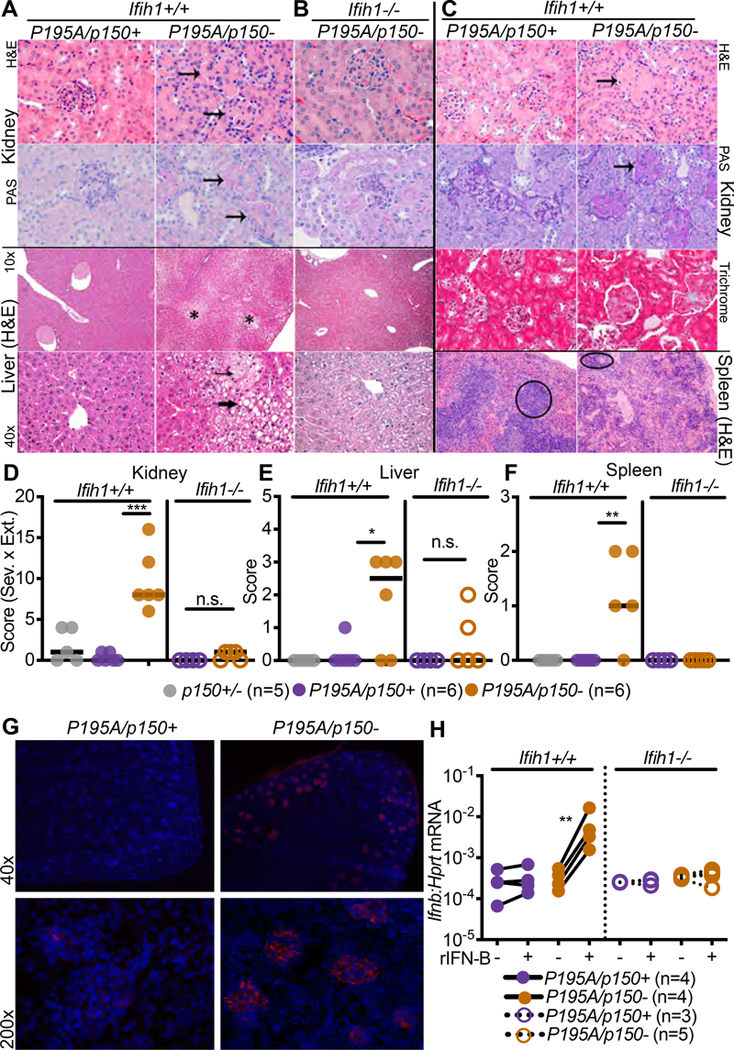
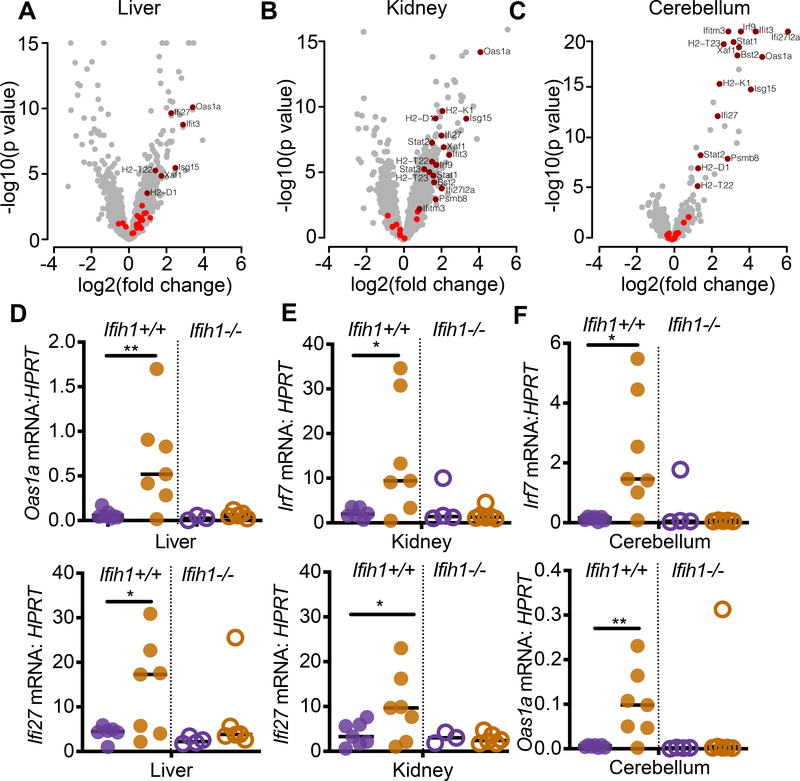
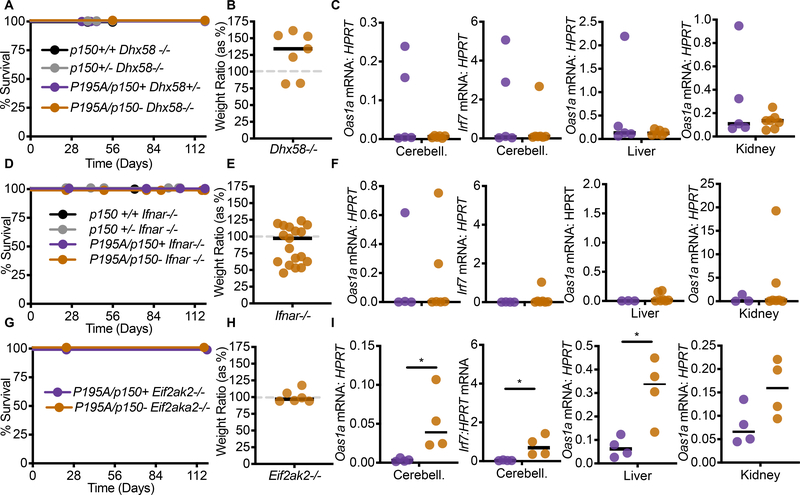
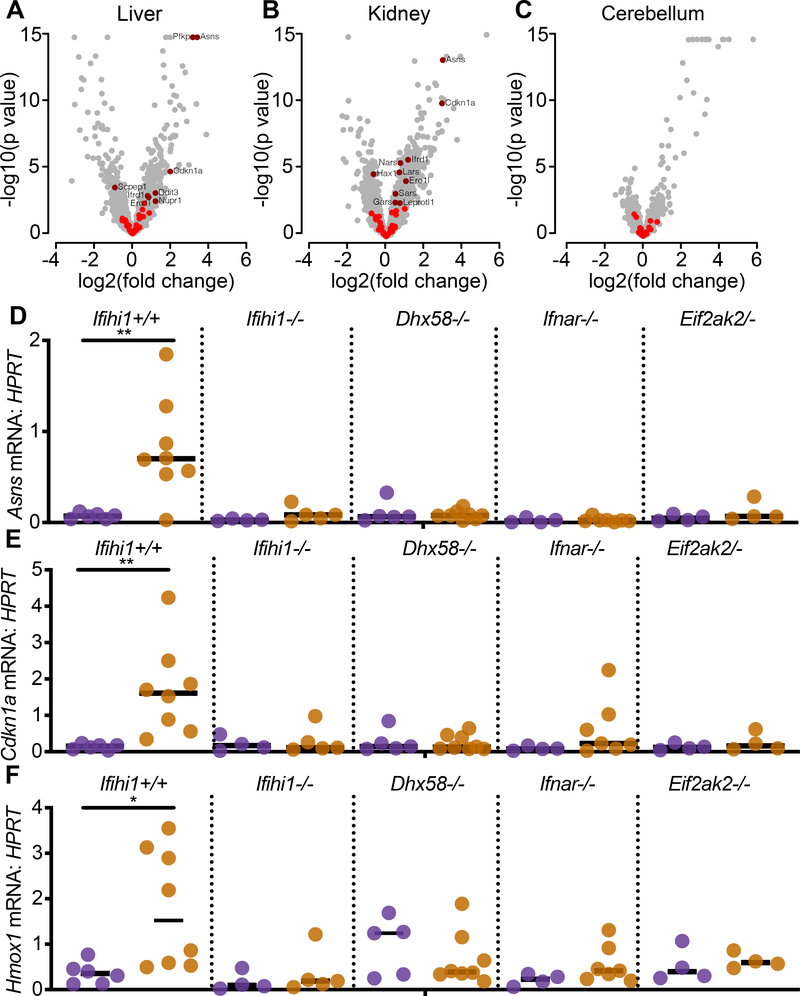
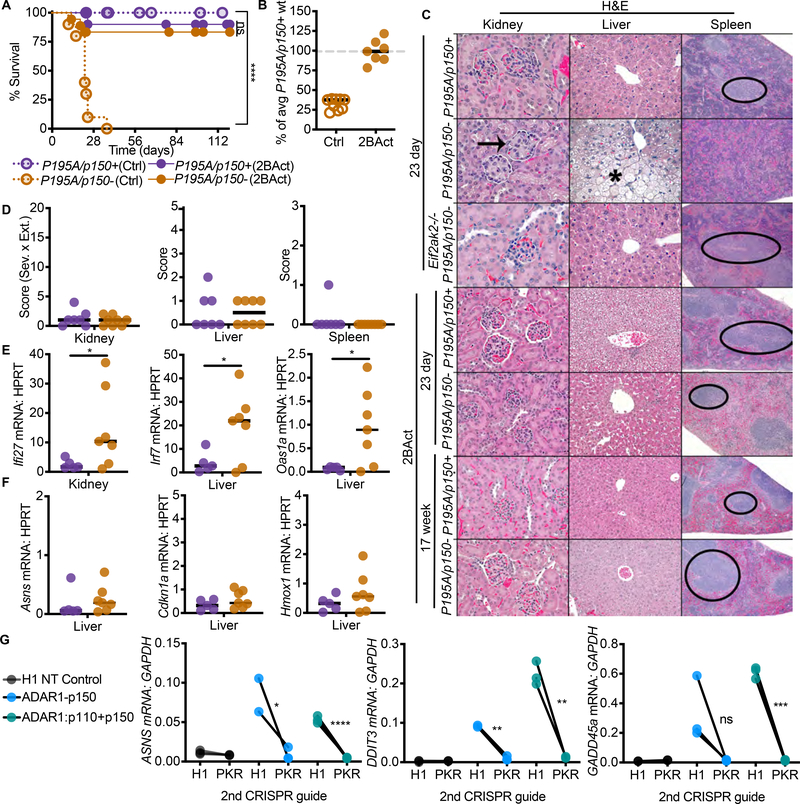
The RNA deaminase ADAR1 is an essential negative regulator of the RNA sensor MDA5, and loss of ADAR1 function triggers inappropriate activation of MDA5 by self-RNAs. Mutations in ADAR, the gene that encodes ADAR1, cause human immune diseases, including Aicardi-Goutières syndrome (AGS). However, the mechanisms of MDA5-dependent disease pathogenesis in vivo remain unknown. Here we generated mice with a single amino acid change in ADAR1 that models the most common human ADAR AGS mutation. These Adar mutant mice developed lethal disease that required MDA5, the RIG-I-like receptor LGP2, type I interferons, and the eIF2α kinase PKR. A small-molecule inhibitor of the integrated stress response (ISR) that acts downstream of eIF2α phosphorylation prevented immunopathology and rescued the mice from mortality. These findings place PKR and the ISR as central components of immunopathology in vivo and identify therapeutic targets for treatment of human diseases associated with the ADAR1-MDA5 axis.

Keywords: ADAR1; Aicardi-Goutières syndrome; LGP2; MDA5; PKR; integrated stress response; interferons.


Conflict of interest statement

Declaration of interests C.S. is an employee of Calico Life Sciences and is listed as an inventor on a patent application WO2017193063 describing 2BAct. D.B.S. is a co-founder and shareholder of Danger Bio, LLC, and a scientific advisor for Related Sciences, LLC.

Figures

Figure 1.
Figure 1.. Adar P195A mice model the most common Aicardi-Goutieres Syndrome mutation
(A) Schematic of the structure of ADAR1 protein, and the location of the P195A mutation. Zα, Zβ, = Z-DNA binding domains, NES = Nuclear export signal, NLS = nuclear localization signal. (B) Percentage of mice of the indicated genotype from intercrosses of AdarP195A/+ mice. (n=140 pups) (C) Survival of Adar+/+ (n=23), AdarP195A/+ (n=47), AdarP195A/P195A (n=48) mice. (D) Weights of mice at 23 days of age. Adar+/+ (n= 6F,12M), AdarP195A/+ (n= 13F,14M), AdarP195A/P195A (n= 8F, 9M). Bar represents the mean. See also Figure S1.
Figure 2.
Figure 2.. Recapitulation of AGS patient genotypes causes severe disease in AdarP195A mice
(A-B) Survival of Ifihi1+/+ mice of the indicated genotypes: Adarr+/+ (n=14), Adar+/− (n=21), AdarP195A/Adar+ (n=41), AdarP195A/Adar− (n=9); Adar p150+/+ (n=15), Adar p150+/− (n=6), AdarP195A/p150+ (n=34), AdarP195A/p150− (n=25). (C-D) Survival of Ifihi1−/− mice of the indicated genotypes: Adar+/+ (n=18), Adar+/− (n=22), AdarP195A/Adar+ (n=14), AdarP195A/Adar- (n=19); Adar p150+/+ (n=17), Adar p150+/− (n=24), AdarP195A/p150+ (n=25), AdarP195A/p150- (n=28). (E-F). Weights of mice of the indicated genotypes, measured at 23 days. Bars represent mean. Male and female mice are pooled in (E) because there was no significant difference by sex. Adar+/+ (n=2); Adar+/− (n=3); AdarP195A/Adar+ (n=4); AdarP195A/Adar− (n=5); Adar p150+/+ (n=5M, 6F); p150+/− (n=5M, 5F); AdarP195A/p150+ (n=11M, 10F); AdarP195A/p150− (n=6M, 4F); AdarP195A/p150+ (n=9M, 8F); AdarP195A/p150− (n=11M, 8F). See also Figure S2
Figure 3.
Figure 3.. AdarP195A/p150− mice develop organ-specific pathology
(A) Representative histology of kidney and liver from AdarP195A/p150− mice measured at 23 days of age. (B) Representative histology of kidney and liver from AdarP195A/p150−Ifih1−/− mice measured at 23 days of age. (C) Representative histology of kidney, liver, and spleen from AdarP195A/p150− mice measured at 147 days of age. Arrows indicate glomeruli in kidneys, asterisk indicates region of cytoplasmic vacuolation in liver with small arrow showing microvesicular vacuolation and large arrow showing macrovesicular vacuolation. (D-F) Histological scores in the kidney, liver, and spleen, measured at 23 days of age. Adar p150+/+ (n=5); AdarP195A/p150+ (n=5); AdarP195A/p150− (n=6); AdarP195A/p150+Ifih1−/− (n=4); AdarP195A/p150Ifih1−/− (n=5). (G) Representative (of 3 of each genotype) immunofluorescence of the kidney for AdarP195A/p150− and AdarP195/p150+ mice. DAPI is blue. IgG is red. (H) Ifnb transcript measured by qRT-PCR in BMMs of the indicated genotypes, with and without 24 hours of treatment with recombinant mouse IFNβ. AdarP195A/p150+ (n=4); AdarP195A/p150− (n=4); AdarP195A/p150+Ifih1−/− (n=3); AdarP195A/p150−Ifihi1−/− (n=5).
Figure 4.
Figure 4.. AdarP195A/p150− mice have an MDA5-dependent interferon signature
(A-C) Expression data for ISGs, defined by the GO term ‘response to type I interferon,’ were evaluated in the liver, kidney, and cerebellum of 23 day old AdarP195A/p150− mice, plotting the log2 fold change over matched AdarP195A/p150+ control mice. ISGs that were not significantly changed are shown in bright red; significant expression changes are shown in dark red. (D-F) Expression of ISGs identified in A-C, measured by TaqMan qPCR, in 23 day old mice of the indicated genotypes. AdarP195A/p150+ (n=6); AdarP195A/p150− (n=7); AdarP195A/p150+Ifihi1−/− (n=4); Adar P195A/p150− Ifih1−/− (n=6).
Figure 5.
Figure 5.. Identification of a genetic pathway linking the AdarP195A mutation to disease
(A) Survival of Dhx58−/− mice of the indicated genotype: Adar p150+/+ (n=3), Adar p150+/− (n=8), AdarP195A/p150+ (n=5), AdarP195A/p150− (n=12). (B) Weights, measured at 23 days, of AdarP195A/p150Dhx58−/− mice (n=7), as a percentage of the average weight of age- and sex-matched AdarP195A/p150+Dhx58−/− (n=7) control mice. (C) Expression of the indicated ISGs measured by TaqMan qRT-PCR, normalized to HPRT, in the cerebellum, liver, or kidney, comparing AdarP195A/p150Dhx58−/− mice (n=8) to AdarP195A/p150+Dhx58−/− controls (n=6). (D) Survival of Ifnar1−/− mice of the indicated genotype: Adar p150+/+ (n=3), Adar p150+/− (n=7), AdarP195A/p150+ (n=4), AdarP195A/p150− (n=16). (E) Weights, measured at 23 days, of AdarP195A/p150Ifnar1−/− (n=19) mice, as a percentage of the average weight of age- and sex-matched AdarP195A/p150+Ifnar1−/− (n=6) control mice. (F) Expression of the indicated ISGs measured by TaqMan qRT-PCR, normalized to HPRT, in the cerebellum, liver, or kidney, comparing AdarP195A/p150Ifnar1−/−(n=8) mice to AdarP195A/p150+Ifnar1−/− (n=5) controls. (G) Survival of Eif2ak2−/− mice of the indicated genotype: AdarP195A/p150+ (n=4), or AdarP195A/p150− (n=7). (H) Weights, measured at 23 days, of AdarP195A/p150Eif2ak2−/− mice (n=6), as a percentage of the average weight of age- and sex-matched AdarP195A/p150+Eif2ak2−/− control (n=4)mice. (I) Expression of the indicated ISGs measured by TaqMan qRT-PCR, normalized to HPRT, in the cerebellum, liver, or kidney, comparing AdarP195A/p150Eif2ak2−/− mice(n=4) to AdarP195A/p150+Eif2ak2−/− controls (n=4). (See also figures S3 and S4)
Figure 6.
Figure 6.. An ISR gene expression signature is evident in AdarP195A/p150− mice
(A-C) Expression data for ISR gene set genes in the liver, kidney, and cerebellum of 23 day old AdarP195A/p150− mice (n=7), plotting the log2 fold change over control AdarP195A/p150+ (n=5) mice. ISR genes that are not significantly changed are shown in bright red; significant expression changes are shown in dark red. (D-F) Expression of ISR transcripts identified in the livers of rescued mice, measured by TaqMan qRT-PCR, and compared among the indicated genotypes. Each data point represents an individual mouse. AdarP195A/p150+ (n=6); AdarP195A/p150− (n=7); AdarP195A/p150+Ifihi1−/− (n=4); AdarP195A/p150−Ifih1−/− (n=6); AdarP195A/p150+Dhx58−/− (n=7); AdarP195A/p150−Dhx58−/− (n=8); AdarP195A/p150+Ifnar1−/− (n=4); AdarP195A/p150− Ifnar1−/− (n=7); AdarP195A/p150+Eif2ak2−/− (n=4); AdarP195A/p150Eif2ak2−/− mice (n=4).
Figure 7.
Figure 7.. Pharmacological Inhibition of the ISR rescues AdarP195A/p150− mice
(A) Survival of mice on control chow: AdarP195A/p150+ (n=23), AdarP195A/p150− (n=10); versus survival of mice on 2BAct chow: AdarP195A/p150+ (n=17), AdarP195A/p150− (n=17). (B) Weights of AdarP195A/p150 mice on control chow AdarP195A/p150+ (n=12), AdarP195A/p150− (n=9) or 2BAct chow AdarP195A/p150+ (n=16), AdarP195A/p150− (n=7), as a percentage of average weight of age- and sex-matched AdarP195A/p150+ mice on control chow. (C) Representative histology of kidney, liver, and spleen of untreated, Eif2ak2−/−, and 2BAct-treated mice of the indicated genotypes. (D) Histological scores of the kidneys, livers, and spleens of 2BAct-treated mice at day 23. AdarP195A/p150+ (n=7), AdarP195A/p150− (n=8). Arrows indicate glomeruli, asterisk indicates region of cytoplasmic vacuolation, and oval indicates periarteriolar lymphoid sheath (white pulp of spleen). (E) ISG expression in the kidneys and livers of AdarP195A/p150+ (n=5) and AdarP195A/p150−(n=7) mice treated with 2BAct. (F) ISR transcript expression in the liver of AdarP195A/p150+ (n=5) and AdarP195A/p150− (n=7) mice treated with 2BAct. Bars represents the mean in all graphs for B-F. (G) Human A549 cells were transduced simultaneously with two lentiCRISPR constructs, each containing a distinct selectable marker. The first construct (puromycin-resistant) encoded gRNAs targeting just the p150 isoform of ADAR1, both isoforms of ADAR1, or an H1 nontargeting control. The second construct (blasticidin resistant) encoded either an H1 nontargeting control gRNA or a gRNA targeting the human EIFAK2 (PKR) gene. After selection in puromycin and blasticidin, the cells were treated with 1000U recombinant human IFNb for 72 hours, followed by measurement of the indicated genes by qRT-PCR. n=3 independent transduced populations for each group. Data are representative of 2 independent repeats.

Similar articles

Cited by

References

    1. Ahmad S, Mu X, Yang F, Greenwald E, Park JW, Jacob E, Zhang CZ, and Hur S (2018). Breaching Self-Tolerance to Alu Duplex RNA Underlies MDA5-Mediated Inflammation. Cell 172, 797–810 e713. - PMC - PubMed
    1. Brinkman EK, Chen T, Amendola M, and van Steensel B (2014). Easy quantitative assessment of genome editing by sequence trace decomposition. Nucleic Acids Res 42, e168. - PMC - PubMed
    1. Bruns AM, Leser GP, Lamb RA, and Horvath CM (2014). The innate immune sensor LGP2 activates antiviral signaling by regulating MDA5-RNA interaction and filament assembly. Mol Cell 55, 771–781. - PMC - PubMed
    1. Chung H, Calis JJA, Wu X, Sun T, Yu Y, Sarbanes SL, Dao Thi VL, Shilvock AR, Hoffmann HH, Rosenberg BR, and Rice CM (2018). Human ADAR1 Prevents Endogenous RNA from Triggering Translational Shutdown. Cell 172, 811–824 e814. - PMC - PubMed
    1. Civril F, Deimling T, de Oliveira Mann CC, Ablasser A, Moldt M, Witte G, Hornung V, and Hopfner KP (2013). Structural mechanism of cytosolic DNA sensing by cGAS. Nature 498, 332–337. - PMC - PubMed

Publication types

MeSH terms

Supplementary concepts