. 2021 Sep 7;33(9):1820-1835.e9.
doi: 10.1016/j.cmet.2021.07.008. Epub 2021 Aug 2.

Mitochondrial cristae-remodeling protein OPA1 in POMC neurons couples Ca2+ homeostasis with adipose tissue lipolysis

Affiliations

Mitochondrial cristae-remodeling protein OPA1 in POMC neurons couples Ca2+ homeostasis with adipose tissue lipolysis

Alicia G Gómez-Valadés et al. Cell Metab. .

Abstract

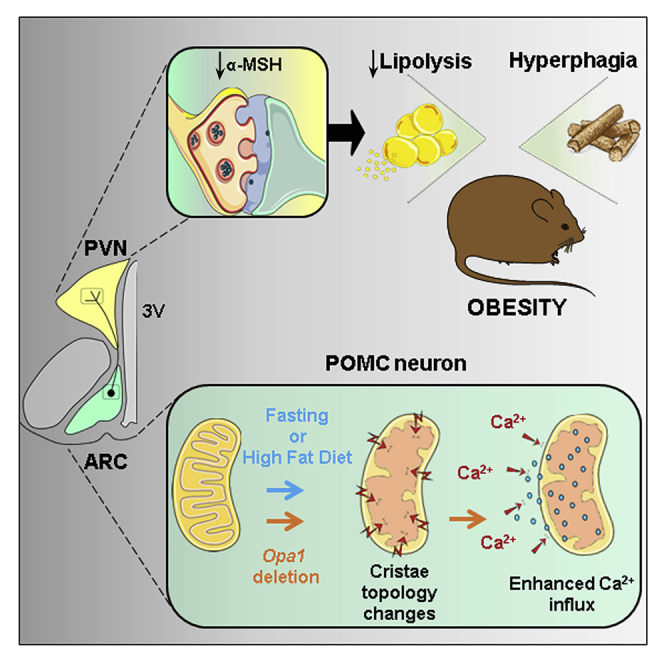
Appropriate cristae remodeling is a determinant of mitochondrial function and bioenergetics and thus represents a crucial process for cellular metabolic adaptations. Here, we show that mitochondrial cristae architecture and expression of the master cristae-remodeling protein OPA1 in proopiomelanocortin (POMC) neurons, which are key metabolic sensors implicated in energy balance control, is affected by fluctuations in nutrient availability. Genetic inactivation of OPA1 in POMC neurons causes dramatic alterations in cristae topology, mitochondrial Ca2+ handling, reduction in alpha-melanocyte stimulating hormone (α-MSH) in target areas, hyperphagia, and attenuated white adipose tissue (WAT) lipolysis resulting in obesity. Pharmacological blockade of mitochondrial Ca2+ influx restores α-MSH and the lipolytic program, while improving the metabolic defects of mutant mice. Chemogenetic manipulation of POMC neurons confirms a role in lipolysis control. Our results unveil a novel axis that connects OPA1 in POMC neurons with mitochondrial cristae, Ca2+ homeostasis, and WAT lipolysis in the regulation of energy balance.

Keywords: OPA-1; POMC neurons; cristae; hypothalamus; lipolysis; mitochondria; obesity.


Conflict of interest statement

Declaration of interests The authors declare no competing interests.

Figures

None
Graphical abstract
Figure 1
Figure 1
Mitochondrial cristae remodeling in POMC neurons is influenced by nutritional status (A and B) Quantification of cristae per mitochondria (A) and cumulative probability distribution of cristae length (B) in POMC neurons of C57Bl/6J mice upon random fed (n = 1,009 cristae, 152 mitochondria, 15 neurons, 4 mice) or fasted (n = 906 cristae, 151 mitochondria, 20 neurons, 4 mice) conditions. (C) Representative electron micrographs of mitochondria cristae profiles in POMC neurons from fed, fasted, and high-fat diet (HFD) C57Bl/6J mice. Scale bar, 100 nm. (D and E) Quantification of cristae per mitochondria (D) and cumulative probability distribution of cristae length (E) in POMC neurons of C57Bl/6J mice fed normal chow diet (NCD; n = 893 cristae, 164 mitochondria, 16 neurons, 4 mice) or HFD for 16 weeks (n = 881 cristae, 186 mitochondria, 19 neurons, 4 mice). (F) Schematic of the protocol used for POMC neuron translatome enrichment. (G) Expression of mitochondrial fusion genes in POMC neurons from random fed or fasted POMCRiboTag mice (n = 6–8/ group). (H) Expression of mitochondrial fusion genes in POMC neurons from POMCRiboTag mice fed with NCD or HFD (n = 5–7/ group). All studies were conducted in 12- to 14-week-old male mice. Data are expressed as mean ± SEM. p < 0.05; ∗∗p < 0.01; ∗∗∗p < 0.001. ns, not significant. See also Figure S1.
Figure 2
Figure 2
Deletion of Opa1 in POMC neurons causes obesity (A) Body weight of control (n = 6) and POMCOpa1KO (n = 7) mice on chow diet. (B) Total lean and fat mass in control (n = 8) and POMCOpa1KO (n = 9) mice. (C) Adiposity in control (n = 5) and POMCOpa1KO (n = 11) mice. Perigonadal (pgWAT), subcutaneous (scWAT), and brown (BAT) adipose tissues are represented. (D) Fasting plasma leptin levels in control (n = 5) and POMCOpa1KO (n = 11) mice. (E and F) Cumulative food intake (E) and body weight gain (F) after vehicle (Veh) or leptin (Lep) treatment in control (n = 6) and POMCOpa1KO (n = 7) mice. (G) Daily food intake in control (n = 6) and POMCOpa1KO (n = 7) mice. (H and I) Relative neuropeptide expression in the hypothalamus of control (n = 6) and POMCOpa1KO (n = 7) mice under fed or fasting conditions. (J and K) Representative immunofluorescence images (J) and integrated density quantification (K) of α-MSH staining in the PVN from control (n = 3) and POMCOpa1KO (n = 3) mice. 3V, third ventricle. Scale bar, 100 μm. (L and M) Representative TOMATO fluorescence images (L) and quantification (M) of POMC neuron projection density in the PVH from control (n = 5) and POMCOpa1KO (n = 7) mice. 3V, third ventricle. Scale bar, 100 μm. (N) Total hypothalamic α-MSH content in control (n = 7) and POMCOpa1KO (n = 7) mice. (O) Gene expression of POMC-processing enzymes in the hypothalamus from control (n = 7) and POMCOpa1KO (n = 7) mice. (P) Fed and fasting blood glucose levels in control (n = 5) and POMCOpa1KO (n = 11) mice. (Q) Fasting plasma insulin levels in control (n = 6) and POMCOpa1KO (n = 7) mice. All studies were conducted in 12- to 14-week-old male control and POMCOpa1KO mice. Data are expressed as mean ± SEM. p < 0.05; ∗∗p < 0.01; ∗∗∗p < 0.001. ns, not significant. See also Figures S2 and S3.
Figure 3
Figure 3
Impaired lipolysis upon fasting in POMCOpa1KO mice precedes the onset of obesity (A) Body weight (n = 9–11/genotype/nutritional status; pooled from two independent experiments). (B) pgWAT, scWAT, and BAT mass (n = 9–11/genotype/nutritional status; pooled from two independent experiments). (C) Plasma FFA levels (n = 9–10/genotype/nutritional status). (D) Gene expression of lipolytic enzymes in pgWAT (n = 7–8/genotype/nutritional status). (E and F) Representative immunoblot images (E) and densitometric quantification (F) of pHSL (normalized by total HSL protein) and perilipin A (normalized by tubulin) levels in pgWAT (n = 4/genotype/nutritional status). (G) Epinephrine and norepinephrine content in pgWAT (n = 4/genotype/nutritional status). All studies were conducted in 5- to 6-week-old male control and POMCOpa1KO mice under fed or overnight (16 h) fasting conditions. Data are expressed as mean ± SEM. p < 0.05; ∗∗p < 0.01; ∗∗∗p < 0.001. ns, not significant. See also Figure S4.
Figure 4
Figure 4
Modulation of POMC neuron activity influences lipolysis (A) Schematic of viral activatory DREADD injection. (B) Fasting-induced FFA increase after CNO-mediated stimulation of POMC neuronal activity (n = 9–13/group). (C) Fasting-induced pgWAT mass after CNO-mediated stimulation of POMC neuronal activity (n = 12–13/group). (D) Fasting-induced body weight change after CNO-mediated stimulation of POMC neuronal activity (n = 13/group). (E) Schematic of viral inhibitory DREADD injection. (F) Fasting-induced FFA increase after CNO-mediated inhibition of POMC neuronal activity (n = 8–13/group). (G) Fasting-induced pgWAT mass after CNO-mediated inhibition of POMC neuronal activity (n = 8–13/group). (H) Fasting-induced body weight change after CNO-mediated inhibition of POMC neuronal activity (n = 8–13/group). (I) Immunoblot images and quantification of fasting-induced changes of lipolytic enzymes in pgWAT after CNO-mediated inhibition of POMC neuronal activity (n = 8/group). Phosphorylated HSL was normalized by total HSL and perilipin A was normalized by actin. All studies were conducted in 14- to 16-week-old male POMCCre/+ mice or POMC+/+. Data are expressed as mean ± SEM. p < 0.05. See also Figure S5.
Figure 5
Figure 5
Deletion of Opa1 in POMC neurons alters mitochondrial morphology, cristae ultrastructure, and mitochondrial function before the onset of obesity (A–D) Mitochondrial density (A), coverage (B), area (C), and aspect ratio (AR) (D) in POMC neurons from control (n = 1,216 mitochondria, 19 neurons, 4 mice) and POMCOpa1KO (n = 367 mitochondria, 15 neurons, 4 mice) mice. (E) Representative electron microscopy images of POMC neuron mitochondria (scale bar, 100 nm) and cumulative frequency distribution of mitochondria with disrupted inner morphology in POMC neurons from control (n = 1,216 mitochondria, 19 neurons, 4 mice) and POMCOpa1KO (n = 367 mitochondria, 15 neurons, 4 mice) mice. (F) Mitochondrial respirometry of ARC-enriched microdissections from control (n = 5) and POMCOpa1KO mice (n = 4). x axis shows the substrates utilized (P, pyruvate; M, malate; G, glutamate; S, succinate), respiratory states, and pathways. (G) Representative immunoblot images and densitometric quantification of archetypical proteins for complex I (Ndufb8), complex II (Sdhb), complex III (Uqcrc2), complex IV (Mtco1), and complex V (Atp5a) in ARC microdissections from control and POMCOpa1KO mice (n = 6/phenotype). Actin was used as loading control. All studies were conducted in 5- to 6-week-old male control and POMCOpa1KO overnight fasted (16 h) mice. Data are expressed as mean ± SEM. p < 0.05; ∗∗∗p < 0.001.
Figure 6
Figure 6
Mitochondrial Ca2+ dyshomeostasis in POMC neurons from POMCOpa1KO mice underlies defective lipolysis (A) Gene expression of MCU complex subunits in ARC microdissections from control (n = 5) and POMCOpa1KO mice (n = 11). (B and C) Recordings of mitochondrial (B) and cytosolic (C) Ca2+ normalized fluorescence signal from POMC neurons in fasted mice. Food presentation response is marked with a dotted frame. Inset represents the area under the curve (AUC) quantification of the fluorescence increase over baseline during the acquisition period. Mitochondrial Ca2+ measurements: control (n = 6) and POMCOpa1KO (n = 8) mice. Cytosolic Ca2+ measurements: control (n = 5) and POMCOpa1KO (n = 3) mice. (D and E) Representative mitochondrial Ca2+ fluorescence trace of POMC neurons from control and POMCOpa1KO fasted mice after i.c.v. injection of either vehicle (Veh) or Ru265. (E) AUC quantification of the fluorescence increase over baseline during the acquisition period. n = 3/genotype. (F) Schematic of acute i.c.v. injection setup. (G) Fasting-induced increase of plasma FFA after vehicle (Veh) or Ru360 i.c.v. injection in control and POMCOpa1KO mice. n = 7–12 genotype/treatment. (H and I) Representative immunoblot images (H) and densitometric quantification (I) of lipolytic markers (HSL-pS660/HSL, HSL-pS563/HSL, and perilipin/tubulin) in pgWAT from control and POMCOpa1KO mice after i.c.v. treatment with vehicle (Veh) or Ru360 (n = 4/genotype/treatment). (J) Epinephrine and norepinephrine content in pgWAT from control and POMCOpa1KO mice after i.c.v. treatment with vehicle (Veh) or Ru360. n = 9–11/genotype/treatment. (K) Fasting-induced increase of plasma FFA levels in control and POMCOpa1KO mice after vehicle (Veh) or Ru360 i.c.v. injection together with i.p. administration of saline (Sal) or β3-adrenergic blocker SR59230A (SR). n = 10–12/genotype/treatment. All studies were conducted in 12- to 16-week-old male control and POMCOpa1KO mice under fed or overnight (16 h) fasting conditions. Data are expressed as mean ± SEM. p < 0.05; ∗∗p < 0.01; ∗∗∗p < 0.001. ns, not significant. See also Figure S6.
Figure 7
Figure 7
Central blockade of mitochondrial Ca2+ transport reverts obesity in POMCOpa1KO mice by restoring α-MSH in target areas (A) Fasting-induced increase of plasma FFA levels after vehicle (Veh) or α-MSH i.c.v. injection in control and POMCOpa1KO mice. n = 7–8 genotype/treatment. (B) Ex vivo measurements of α-MSH secretion in hypothalamic explants from control and POMCOpa1KO mice. The average from 12 mice per genotype pooled from 3 independent experiments is shown. (C) Scheme depicting subchronic i.c.v. Ru360 injection setup. (D and E) Representative immunofluorescence images (D) and integrated density quantification (E) of α-MSH staining in the PVN from control and POMCOpa1KO mice after subchronic i.c.v. injection of vehicle (Veh) or Ru360. n = 4/genotype/treatment. 3V, third ventricle. Scale bar, 100 μm. (F–H) Body weight change (F), final body weight (G), and average daily food intake (H) after subchronic treatment with vehicle (Veh) or Ru360 in control (vehicle, n = 12; Ru360, n = 11) and POMCOpa1KO (vehicle, n = 10; Ru360, n = 10) mice. (I) Adiposity after subchronic protocol (n = 6/genotype/treatment). (J) Representative hematoxylin and eosin staining images of pgWAT. Scale bar, 100 μm. (K) Adipocyte area quantification (n = 2–3/genotype/treatment). (L) Cumulative frequency of adipocyte area distribution. (M) Gene expression of representative markers of obesity-associated adipose tissue inflammation (Tnfa, tumor necrosis factor alpha; Lbp, lipopolysaccharide binding protein; Ccl2, chemokine [C–C motif] ligand 2; Itgax, integrin alpha X) in mice after 13 days of subchronic treatment with vehicle (Veh) or Ru360 (n = 6/genotype/treatment). All studies were conducted in 12- to 16-week-old male control and POMCOpa1KO mice. Data are expressed as mean ± SEM. p < 0.05; ∗∗p < 0.01; ∗∗∗p < 0.001.

References

    1. Anthonsen M.W., Rönnstrand L., Wernstedt C., Degerman E., Holm C. Identification of novel phosphorylation sites in hormone-sensitive lipase that are phosphorylated in response to isoproterenol and govern activation properties in vitro. J. Biol. Chem. 1998;273:215–221. - PubMed
    1. Arduino D.M., Wettmarshausen J., Vais H., Navas-Navarro P., Cheng Y., Leimpek A., Ma Z., Delrio-Lorenzo A., Giordano A., Garcia-Perez C. Systematic identification of MCU modulators by orthogonal interspecies chemical screening. Mol. Cell. 2017;67:711–723.e7. - PMC - PubMed
    1. Bartness T.J., Liu Y., Shrestha Y.B., Ryu V. Neural innervation of white adipose tissue and the control of lipolysis. Front. Neuroendocrinol. 2014;35:473–493. - PMC - PubMed
    1. Baughman J.M., Perocchi F., Girgis H.S., Plovanich M., Belcher-Timme C.A., Sancak Y., Bao X.R., Strittmatter L., Goldberger O., Bogorad R.L. Integrative genomics identifies MCU as an essential component of the mitochondrial calcium uniporter. Nature. 2011;476:341–345. - PMC - PubMed
    1. Bermont F., Hermant A., Benninga R., Chabert C., Jacot G., Santo-Domingo J., Kraus M.R.-C., Feige J.N., De Marchi U. Targeting mitochondrial calcium uptake with the natural flavonol kaempferol, to promote metabolism/secretion coupling in pancreatic β-cells. Nutrients. 2020;12:538. - PMC - PubMed

Publication types