Spatiotemporal blood vessel specification at the osteogenesis and angiogenesis interface of biomimetic nanofiber-enabled bone tissue engineering
- PMID: 34343857
- PMCID: PMC8477312
- DOI: 10.1016/j.biomaterials.2021.121041
Spatiotemporal blood vessel specification at the osteogenesis and angiogenesis interface of biomimetic nanofiber-enabled bone tissue engineering
Abstract
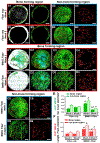
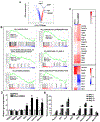
While extensive research has demonstrated an interdependent role of osteogenesis and angiogenesis in bone tissue engineering, little is known about how functional blood vessel networks are organized to initiate and facilitate bone tissue regeneration. Building upon the success of a biomimetic composite nanofibrous construct capable of supporting donor progenitor cell-dependent regeneration, we examined the angiogenic response and spatiotemporal blood vessel specification at the osteogenesis and angiogenesis interface of cranial bone defect repair utilizing high resolution multiphoton laser scanning microscopy (MPLSM) in conjunction with intravital imaging. We demonstrate here that the regenerative vasculature can be specified as arterial and venous capillary vessels based upon endothelial surface markers of CD31 and Endomucin (EMCN), with CD31+EMCN- vessels exhibiting higher flowrate and higher oxygen tension (pO2) than CD31+EMCN+ vessels. The donor osteoblast clusters are uniquely coupled to the sprouting CD31+EMCN+ vessels connecting to CD31+EMCN- vessels. Further analyses reveal differential vascular response and vessel type distribution in healing and non-healing defects, associated with changes of gene sets that control sprouting and morphogenesis of blood vessels. Collectively, our study highlights the key role of spatiotemporal vessel type distribution in bone tissue engineering, offering new insights for devising more effective vascularization strategies for bone tissue engineering.
Keywords: Angiogenesis; Biomimetic nanofibers; Blood vessel specification; Bone tissue engineering; Intravital imaging; Oxygen tension pO(2).
Copyright © 2021 Elsevier Ltd. All rights reserved.
Conflict of interest statement
Declaration of interests
The authors declare that they have no known competing financial interests or personal relationships that could have appeared to influence the work reported in this paper.
Figures


Similar articles
-
Ophiopogonin D promotes bone regeneration by stimulating CD31hi EMCNhi vessel formation.Cell Prolif. 2020 Mar;53(3):e12784. doi: 10.1111/cpr.12784. Epub 2020 Feb 20. Cell Prolif. 2020. PMID: 32080957 Free PMC article.
-
High-resolution imaging of the osteogenic and angiogenic interface at the site of murine cranial bone defect repair via multiphoton microscopy.Elife. 2022 Nov 3;11:e83146. doi: 10.7554/eLife.83146. Elife. 2022. PMID: 36326085 Free PMC article.
-
Spatiotemporal Analyses of Osteogenesis and Angiogenesis via Intravital Imaging in Cranial Bone Defect Repair.J Bone Miner Res. 2015 Jul;30(7):1217-30. doi: 10.1002/jbmr.2460. J Bone Miner Res. 2015. PMID: 25640220 Free PMC article.
-
H Vessel Formation as a Marker for Enhanced Bone Healing in Irradiated Distraction Osteogenesis.Semin Plast Surg. 2024 Jan 19;38(1):31-38. doi: 10.1055/s-0043-1778039. eCollection 2024 Feb. Semin Plast Surg. 2024. PMID: 38495069 Free PMC article. Review.
-
Motivating role of type H vessels in bone regeneration.Cell Prolif. 2020 Sep;53(9):e12874. doi: 10.1111/cpr.12874. Epub 2020 Jul 19. Cell Prolif. 2020. PMID: 33448495 Free PMC article. Review.
Cited by
-
Tannic acid-loaded hydrogel coating endues polypropylene mesh with hemostatic and anti-inflammatory capacity for facilitating pelvic floor repair.Regen Biomater. 2022 Sep 26;9:rbac074. doi: 10.1093/rb/rbac074. eCollection 2022. Regen Biomater. 2022. PMID: 36267152 Free PMC article.
-
Multimodality imaging reveals angiogenic evolution in vivo during calvarial bone defect healing.Angiogenesis. 2024 Feb;27(1):105-119. doi: 10.1007/s10456-023-09899-0. Epub 2023 Nov 30. Angiogenesis. 2024. PMID: 38032405 Free PMC article.
-
3D-printed bioceramic scaffolds for bone defect repair: bone aging and immune regulation.Front Bioeng Biotechnol. 2025 Mar 31;13:1557203. doi: 10.3389/fbioe.2025.1557203. eCollection 2025. Front Bioeng Biotechnol. 2025. PMID: 40242352 Free PMC article. Review.
-
Self-assembled peptide hydrogel loaded with functional peptide Dentonin accelerates vascularized bone tissue regeneration in critical-size bone defects.Regen Biomater. 2024 Aug 23;11:rbae106. doi: 10.1093/rb/rbae106. eCollection 2024. Regen Biomater. 2024. PMID: 39263324 Free PMC article.
-
One-step strategy for fabricating icariin-encapsulated biomimetic Scaffold: Orchestrating immune, angiogenic, and osteogenic cascade for enhanced bone regeneration.Bioact Mater. 2025 Jun 10;52:271-286. doi: 10.1016/j.bioactmat.2025.06.001. eCollection 2025 Oct. Bioact Mater. 2025. PMID: 40547322 Free PMC article.
References
-
- Greenwald AS, Boden SD, Goldberg VM, Khan Y, Laurencin CT, Rosier RN, Bone-graft substitutes: facts, fictions, and applications, J Bone Joint Surg Am 83-ASuppl 2 Pt 2 (2001) 98–103. - PubMed
-
- I. Grand View Research, Bone Grafts and Substitutes Market Size, Share & Trends Analysis Report By Material Type (Natural, Synthetic), Market Watch (2018).
-
- Giannoudis PV, Dinopoulos H, Tsiridis E, Bone substitutes: an update, Injury 36Suppl 3 (2005) S20–7. - PubMed
-
- T.o.C. Foundation., Available at http://www.oralcancerfoundation.org/facts/index.htm (2008).
-
- Dinopoulos H, Dimitriou R, Giannoudis PV, Bone graft substitutes: What are the options?, The surgeon : journal of the Royal Colleges of Surgeons of Edinburgh and Ireland 10(4) (2012) 230–9. - PubMed
Publication types
MeSH terms
Grants and funding
LinkOut - more resources
Full Text Sources

