. 2021 Aug 19;15(4):10.1088/1752-7163/ac1a61.
doi: 10.1088/1752-7163/ac1a61.

Exhaled breath biomarkers of influenza infection and influenza vaccination

Affiliations

Exhaled breath biomarkers of influenza infection and influenza vaccination

Eva Borras et al. J Breath Res. .

Abstract

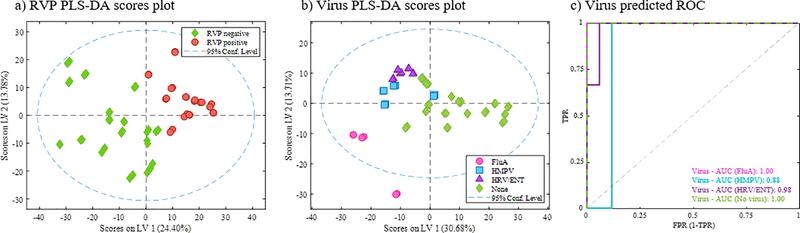
Respiratory viral infections are considered a major public health threat, and breath metabolomics can provide new ways to detect and understand how specific viruses affect the human pulmonary system. In this pilot study, we characterized the metabolic composition of human breath for an early diagnosis and differentiation of influenza viral infection, as well as other types of upper respiratory viral infections. We first studied the non-specific effects of planned seasonal influenza vaccines on breath metabolites in healthy subjects after receiving the immunization. We then investigated changes in breath content from hospitalized patients with flu-like symptoms and confirmed upper respiratory viral infection. The exhaled breath was sampled using a custom-made breath condenser, and exhaled breath condensate (EBC) samples were analysed using liquid chromatography coupled to quadruplole-time-of-flight mass spectrometer (LC-qTOF). All metabolomic data was analysed using both targeted and untargeted approaches to detect specific known biomarkers from inflammatory and oxidative stress biomarkers, as well as new molecules associated with specific infections. We were able to find clear differences between breath samples collected before and after flu vaccine administration, together with potential biomarkers that are related to inflammatory processes and oxidative stress. Moreover, we were also able to discriminate samples from patients with flu-related symptoms that were diagnosed with confirmatory respiratory viral panels (RVPs). RVP positive and negative differences were identified, as well as differences between specific viruses defined. These results provide very promising information for the further study of the effect of influenza A and other viruses in human systems by using a simple and non-invasive specimen like breath.

Keywords: breath analysis; exhaled breath condensate (EBC); influenza; metabolomics; vaccine.


Figures

Figure 1.
Figure 1.
Targeted results from flu vaccination effects. (a) Concentration of 13-HODE detected through the days analyzed; (b) Boxplots comparing concentrations of 13-HODE at different days, considering pre (day 0), and post* (days 1, 2 and 3); and (c) ROC curves obtained from multivariate analysis using all targeted compounds detected. ROC curves compare AUC for different classification methods: PLS-DA, SVM-C and XDB-DA.
Figure 2.
Figure 2.
Scores plots from principal component analysis (PCA) of the untargeted data from flu vaccination effects. (a) non-corrected dataset; (b) dataset after correction by season of flu vaccine showing samples by season (I) and by pre and post flu shot (II).
Figure 3.
Figure 3.
Scores plots from PLS-DA of the untargeted data from flu vaccination effects. Classifications obtained between (a) pre (day 0) and post (day 1, 2, and 3); (b) day 0 and day 1; (c) day 0 and day 2; and (d) day 0 and day 3.
Figure 4.
Figure 4.
Examples of up- and down-regulations for some of the compounds that explain differences before and after flu vaccine. Post up-regulated markers (a) show an increase in EBC abundance once the flu shot was administered; and Post down-regulated markers (b) show a reduction of signal after the flu shot. Right graphs for each compound represent evolution of the abundances through the days; and left graphs represent a general difference between pre and post vaccine (including days 1, 2, and 3).
Figure 5.
Figure 5.
Targeted results from respiratory infections in patients. (a) Concentrations of detected compounds with significant differences by RVP positive/negative results (left), and by type of virus detected by RVP (right). (b) ROC curves obtained from multivariate analysis using all targeted compounds comparing AUC for different PLS-DA models: negative vs. positive RVP (−); and type of virus (−).
Figure 6.
Figure 6.
PLS-DA models for untargeted data from subjects with respiratory infections. Models built with final selection of variables. (a) Scores plot from RVP positive and negative classification, (b) scores plot from virus type classification, and (c) ROC curves for virus differentiation model.
Figure 7.
Figure 7.
Examples of up- and down-regulations for some of the compounds that explain differences between RVP positive and negative (a), and between each type of virus detected (b).

References

    1. Davis CE, Schivo M and Kenyon NJ 2021. A breath of fresh air—the potential for COVID-19 breath diagnostics EBioMedicine 63 103183. - PMC - PubMed
    1. Davis CE et al. 2020. Breath analysis for respiratory infections Breathborne Biomarkers and the Human Volatilome (Netherlands: Elsevier; ) pp 335–47
    1. Traxler S. et al. VOC breath profile in spontaneously breathing awake swine during Influenza A infection. Sci. Rep. 2018;8:14857. - PMC - PubMed
    1. CDC 2021. Disease Burden of Influenza (available at: www.cdc.gov/flu/about/burden/index.html) (Accessed 4 September 2021)
    1. Pawelec G and McElhaney J 2020. Recent advances in influenza vaccines F1000Research 9 F1000 Faculty Rev–305

Publication types