. 2021 Jan-Dec:35:20587384211033683.
doi: 10.1177/20587384211033683.

Positron emission tomography and single photon emission computed tomography imaging of tertiary lymphoid structures during the development of lupus nephritis

Affiliations

Positron emission tomography and single photon emission computed tomography imaging of tertiary lymphoid structures during the development of lupus nephritis

Esmaeil S Dorraji et al. Int J Immunopathol Pharmacol. 2021 Jan-Dec.

Abstract

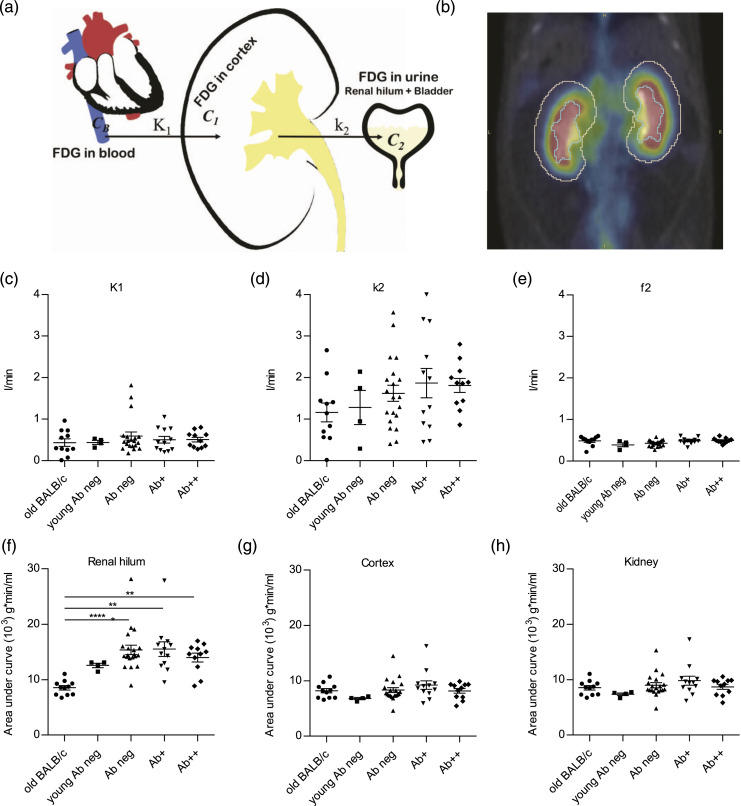
Lymphoid neogenesis occurs in tissues targeted by chronic inflammatory processes, such as infection and autoimmunity. In systemic lupus erythematosus (SLE), such structures develop within the kidneys of lupus-prone mice ((NZBXNZW)F1) and are observed in kidney biopsies taken from SLE patients with lupus nephritis (LN). The purpose of this prospective longitudinal animal study was to detect early kidney changes and tertiary lymphoid structures (TLS) using in vivo imaging. Positron emission tomography (PET) by tail vein injection of 18-F-fluoro-2-deoxy-D-glucose (18F-FDG)(PET/FDG) combined with computed tomography (CT) for anatomical localization and single photon emission computed tomography (SPECT) by intraperitoneal injection of 99mTC labeled Albumin Nanocoll (99mTC-Nanocoll) were performed on different disease stages of NZB/W mice (n = 40) and on aged matched control mice (BALB/c) (n = 20). By using one-way ANOVA analyses, we compared two different compartmental models for the quantitative measure of 18F-FDG uptake within the kidneys. Using a new five-compartment model, we observed that glomerular filtration of 18FFDG in lupus-prone mice decreased significantly by disease progression measured by anti-dsDNA Ab production and before onset of proteinuria. We could not visualize TLS within the kidneys, but we were able to visualize pancreatic TLS using 99mTC Nanocoll SPECT. Based on our findings, we conclude that the five-compartment model can be used to measure changes of FDG uptake within the kidney. However, new optimal PET/SPECT tracer administration sites together with more specific tracers in combination with magnetic resonance imaging (MRI) may make it possible to detect formation of TLS and LN before clinical manifestations.

Keywords: 18-F-fluoro-2-deoxy-D-glucose; 99mTC-Nanocoll; lupus nephritis; positron emission tomography; single photon emission computed tomography; systemic lupus erythematosus; tertiary lymphoid structures.


Conflict of interest statement

Declaration of conflicting interests: The author(s) declared no potential conflicts of interest with respect to the research, authorship, and/or publication of this article.

Figures

Figure 1.
Figure 1.
Renal hilum SUV increased in anti-dsDNA Ab+ mice. (a) Illustrates the three-compartment model. C B , C1, and C2 represent tracer in the blood (input function), activity concentration in the parenchyma, and urine, respectively. (b) Cortex and renal hilum were delineated based on CT. There was no difference in K1 (c) and f2 (e) between the groups, but k2 (d) increased during SLE progression. Area-under-curve of renal hilum (f) increased during SLE progression, while AUCs of cortex (g) and whole kidney (h) were steady. (c)–(h) One-way ANOVA with post-hoc analysis (Dunn’s multiple comparisons test). *p < 0.05, **p < 0.01, ***p < 0.001, ****p < 0.0001.
Figure 2.
Figure 2.
Filtration of 18F-FDG by glomeruli was lower in lupus-prone mice producing anti-dsDNA Ab. (a) Illustrates the five-compartment model, where C a , C f , C t , C u , and C m p represent tracer in blood, extravascular, tubule, urine, and metabolized 18F-FDG, respectively. The kfa (b), k af (c), and kmf (d) were increased in mice with anti-dsDNA Ab production, but k ma (f) decreased. K fm (e), k tm (g), and k ut (h) were steady during SLE progression. (b)–(h) One-way ANOVA with post-hoc analysis (Dunn’s multiple comparisons test). *p < 0.05, **p < 0.01, ***p < 0.001.
Figure 3.
Figure 3.
Histological pictures and ex vivo organ biodistribution. (a) Representative Alcian blue/periodic acid–Schiff (AB/PAS) stained kidney sections from old BALB/c, Ab- NZB/W, Ab+ NZB/W, and Ab++ NZB/W mice. (b) 18F-FDG accumulation measured by SUV (g/ml) in tissue after 24 h. 18F-FDG accumulated higher in heart (c) and renal lymph node (d). 18F-FDG was higher in right (e) and left (f) kidneys, axillary/brachial lymph node, spleen, thymus, brain, and salivary gland (b) of anti-dsDNA Ab+ mice compared to Ab neg mice and was lower for GI track (b). Unpaired t test. *<0.05, **<0.01. a, artery; us, urinary space; v, vein. Scale bar = 100 µm.
Figure 4.
Figure 4.
SPECT imaging of pancreatic TLS. (a) SPECT and (b) CT transversal, coronal, and sagittal frames of an example (dsDNA Ab+) showing multiple ROIs generated in Pmod 3.7. A threshold of 75% of the maximum activity was defined for the delineation in all mice. (c) Total number of VOIs accumulating 99mTC-Nanocoll over time in BALB/c, dsDNA Ab- NZB/W, and dsDNA Ab+ NZB/W groups. (d) Relation between total number of VOIs drawn and the number of VOIs that accumulated 99mTC-Nanocoll with time. No differences among the groups could be observed. (e) Atlas representation of kidneys and pancreas in the mouse. (f) Representing a fusion SPECT/CT image of the NZB/W dsDNA Ab+ mouse with a hot spot in the pancreatic area, which could only be observed in NZB/W dsDNA Ab+ mice (n = 6) not in the (g) BALB/c or NZB/W dsDNA Ab neg mice (data not shown). (h) Autoradiography of the 99mTC Nanocoll in dsDNA Ab+ mice, which shows a clear tracer accumulation in the pancreas in comparison to blood. (c)–(d) One-way ANOVA with post-hoc analysis (Dunn’s multiple comparisons test). p, pancreas; k, kidney; b, blood.
Figure 5.
Figure 5.
HE staining and immunostaining of TLS in pancreatic tissue in lupus-prone (a)–(c) and BALB/c mice (d). TLS was positively stained for T cells (CD3), B cells (B220), and macrophages (F480). Some TLS was detected near pancreatic islets (black arrows, c). (d) TLS was not detected in pancreatic sections from BALB/c mice. a, artery; d, ducts.

References

    1. Lahita R. (1999) The clinical presentation of systemic lupus erythematosus. In: Lahitha R. (ed) Systemic Lupsus Erythematosus. 3rd edition. San Diego, CA: Academic Press, 325–336.
    1. Liu Z, Davidson A. (2012) Taming lupus-a new understanding of pathogenesis is leading to clinical advances. Nature Medicine 18: 871–882. - PMC - PubMed
    1. Balow J, Boumpas D, Austiniii H., III (2004) Systemic lupus erythematosus and the kidney. In: Lahita RG. (ed) Systemic Lupus Erythematosus. 4th edition. New York, NY: Elsevier academic press, 877–912.
    1. Chan TM. (2015) Treatment of severe lupus nephritis: the new horizon. Nature Reviews Nephrology 11: 46–61. DOI: 10.1038/nrneph.2014.215. - DOI - PubMed
    1. Davidson A, Aranow C. (2010) Lupus nephritis: lessons from murine models. Nature Reviews Rheumatology 6: 13–20. DOI: 10.1038/nrrheum.2009.240. - DOI - PMC - PubMed

Substances

LinkOut - more resources