. 2021 Aug 3;12(1):4670.
doi: 10.1038/s41467-021-24836-9.

Canine tumor mutational burden is correlated with TP53 mutation across tumor types and breeds

Affiliations

Canine tumor mutational burden is correlated with TP53 mutation across tumor types and breeds

Burair A Alsaihati et al. Nat Commun. .

Abstract

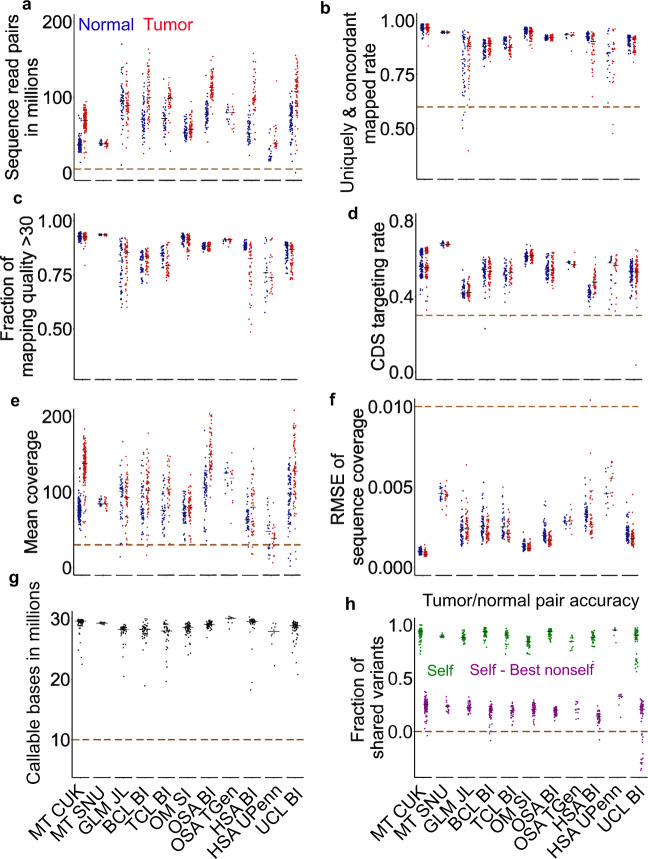
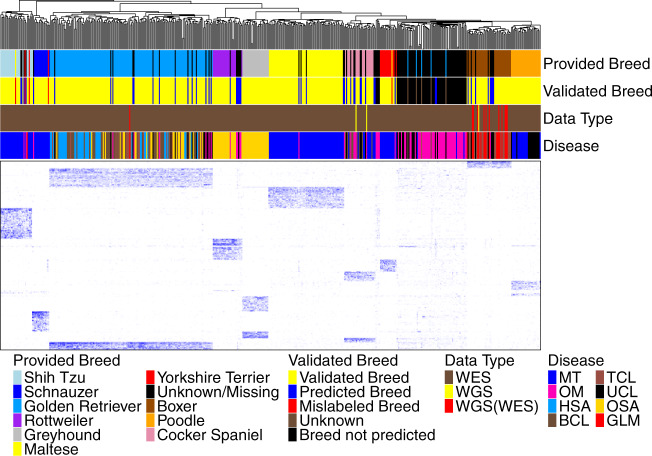
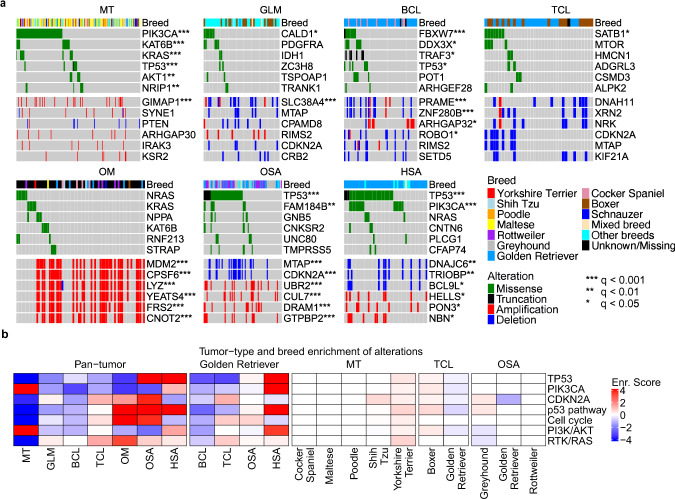
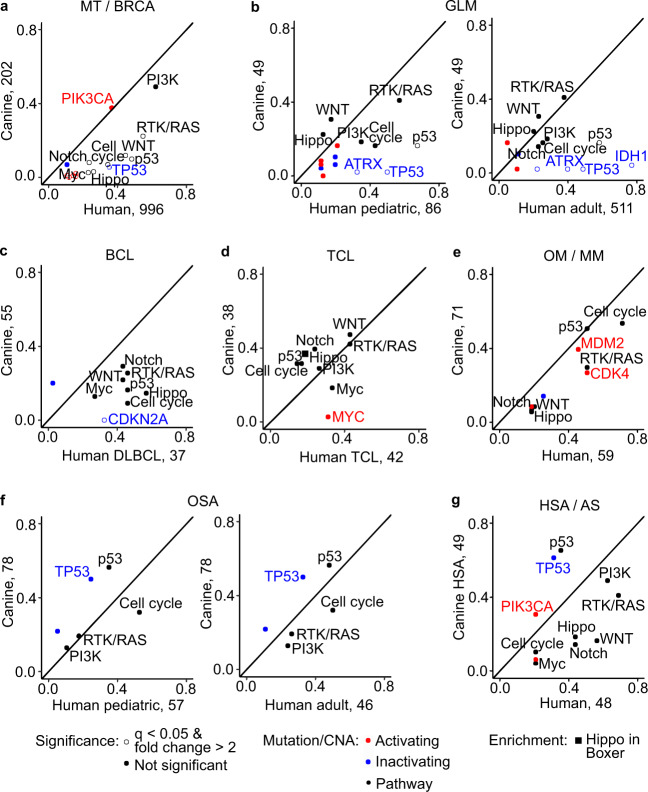
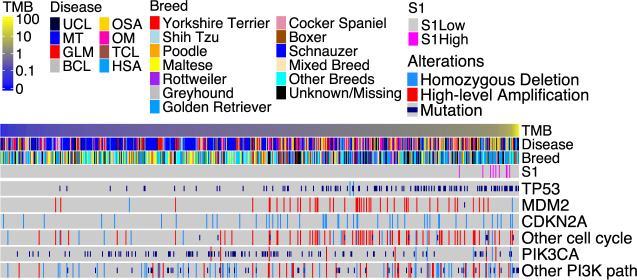
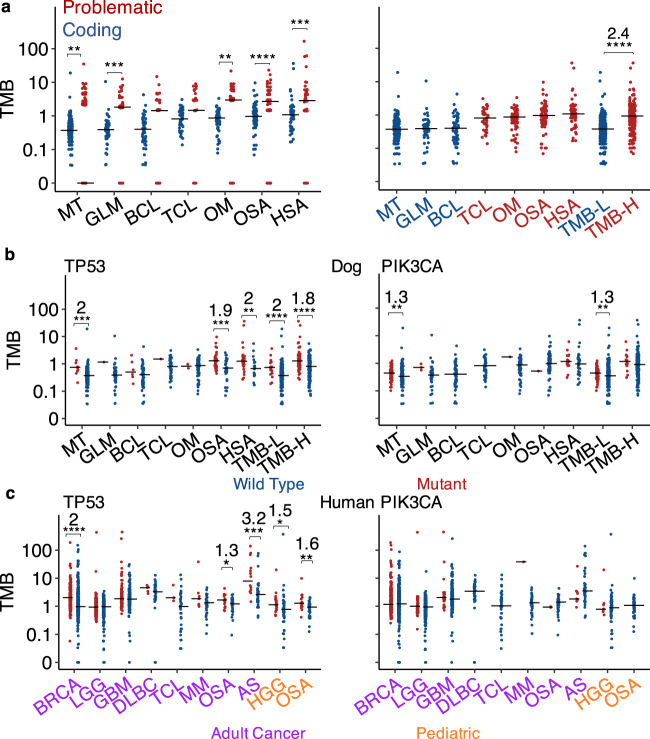
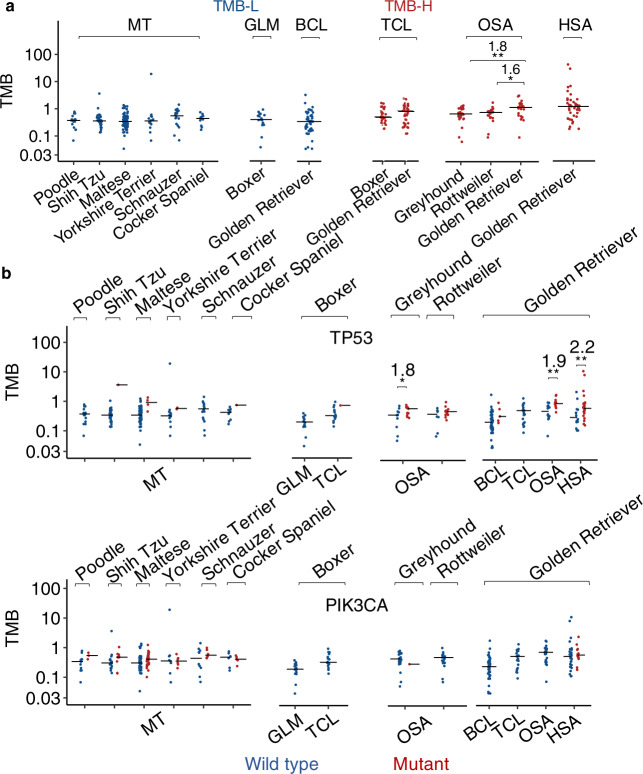
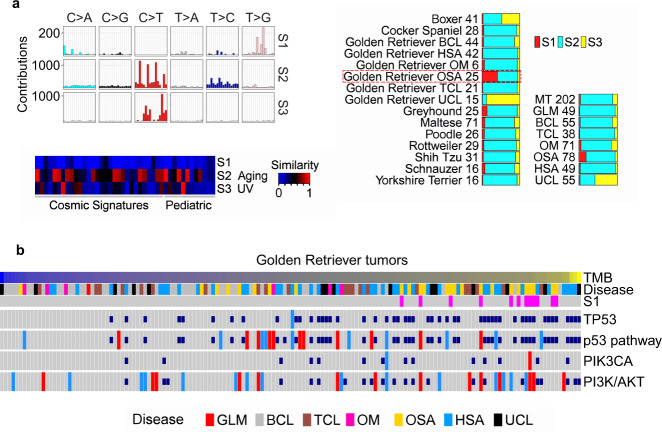
Spontaneous canine cancers are valuable but relatively understudied and underutilized models. To enhance their usage, we reanalyze whole exome and genome sequencing data published for 684 cases of >7 common tumor types and >35 breeds, with rigorous quality control and breed validation. Our results indicate that canine tumor alteration landscape is tumor type-dependent, but likely breed-independent. Each tumor type harbors major pathway alterations also found in its human counterpart (e.g., PI3K in mammary tumor and p53 in osteosarcoma). Mammary tumor and glioma have lower tumor mutational burden (TMB) (median < 0.5 mutations per Mb), whereas oral melanoma, osteosarcoma and hemangiosarcoma have higher TMB (median ≥ 1 mutations per Mb). Across tumor types and breeds, TMB is associated with mutation of TP53 but not PIK3CA, the most mutated genes. Golden Retrievers harbor a TMB-associated and osteosarcoma-enriched mutation signature. Here, we provide a snapshot of canine mutations across major tumor types and breeds.


Conflict of interest statement

The authors declare no competing interests.

Figures

Fig. 1
Fig. 1. We performed a rigorous quality control (QC) of whole-exome sequencing (WES) data published for 654 canine cases.
a Distributions of total read pairs per sample of the tumor and normal sample sets of each study. Each dot represents a sample and the median is indicated by a black line. The dashed line specifies the QC cutoff. Each study is represented by the tumor type and the institute name. MT mammary tumor, GLM glioma, BCL B-cell lymphoma, TCL T-cell lymphoma, OM oral melanoma, OSA osteosarcoma, HSA hemangiosarcoma, UCL unclassified. CUK Catholic University of Korea, SNU Seoul National University, JL Jackson Laboratory, SI Sanger Institute, BI Broad Institute, TGen Translational Genomics Research Institute, UPenn University of Pennsylvania. n = 184, 20, 56, 61, 39, 65 (71 tumors), 66, 12, 47, 21 (23 tumors), and 83 independent cases for matched normal and tumors samples for each independent study listed from left to right. bf Distributions of per sample rate of read pairs that aligned concordantly and uniquely to the canFam3 reference genome (b) (n = 81 for UCL BI; others the same as a), the fraction of reads with mapping quality of ≥30 (c) (n = 50 and 18 for GLM JL and HSA UPenn respectively; others the same as b), CDS-targeting rate (the fraction of read pairs that align concordantly and uniquely to the canFam3 CDS regions) (d) (the same sample size as c), mean read coverage in CDS regions (e) (n = 60, 38 and 80 for BCL BI, TCL BI, and UCL BI, respectively; others the same as d) and root-mean-square error (RMSE) between the actual distribution and theoretical distribution (based on the Poisson distribution) of sequence coverage in CDS regions (f) (n = 183, 49, 58, 43, 8, and 74 for MT CUK, GLM JL, BCL BI, HSA BI, HSA UPenn, and UCL BI, respectively; others the same as e). g Distributions of the total number of callable bases per case, determined by MuTect. n = 183, 20, 49, 58, 38, 71, 66, 12, 42, 8, and 74 independent tumors from left to right. h Tumor-normal pairing accuracy. “Self” (in green) is the fraction of germline variants shared between the normal and tumor samples of a dog. “Best nonself” is the fraction of germline variants shared between a normal or tumor sample of one dog and its best-matched sample from another dog. “Self—Best nonself” (in purple) indicates the difference and a negative difference points to incorrect tumor-normal pairing. The sample size is the same as in (g). Source data are provided as a Source Data file.
Fig. 2
Fig. 2. We conducted breed validation and prediction using breed-specific germline base substitutions and small indels discovered.
The heatmap shows the clustering of 505 animals (398 dogs with breeds provided and 107 dogs with no breeds provided), using variant allele frequency (VAF) values of the 5363 breed-specific germline base substitution and small indel variants in their normal samples. These variants were discovered with the WES dataset (see “Methods”). The WGS dataset was used for validation as specified in the “Data Type” bar, where “WGS(WES)” indicates that a dog has both WGS and WES data but only WGS data were used in the clustering analysis. The “Provided Breed” bar and the “Disease” bar respectively indicate the breed and tumor type of each dog provided by the source studies. The “Validated Breed” bar denotes the analysis outcome as specified, with “Unknown” representing dogs whose provided breeds could not be validated or corrected, due to the lack of any specific VAF clustering patterns of the ten pure breeds investigated. Source data are provided as a Source Data file.
Fig. 3
Fig. 3. Canine tumor alteration landscape, consisting of genes recurrently mutated and/or amplified/deleted, varies with tumor types but not with breeds in general.
a Oncoprints indicate the top six most recurrently altered genes with nonsynonymous somatic base substitutions or small indels (top), or copy number alterations (CNAs) (bottom), in CDS regions in each tumor type indicated. Significant recurrence, identified by Fisher exact tests with multiple testing correction, are denoted by “*” as shown. The breed of each animal is specified in the breed bar. b Enrichment scores of the most recurrently altered genes and pathways, obtained via Fisher exact test q-values (see “Method”), in each tumor type of all breeds (left) and of Golden Retriever (middle), as well as in each breed with ≥10 dogs within a tumor type (right). Source data are provided as a Source Data file.
Fig. 4
Fig. 4. Canine tumors share many of the same major gene and pathway alterations as their human counterparts.
Each panel of ag compares the mutation recurrence of a gene or pathway in a tumor type between the two species. Human breast cancer (BRCA) (a), pediatric and adult GLM (b), diffuse large B-cell lymphoma (DLBCL) (c), TCL (d), mucosal melanoma (MM) (e), OSA (f) and angiosarcoma (AS) (g) are from published studies (see text). Shown are curated pathways (10 total) from a TCGA pan-cancer publication, as well as genes mutated in ≥10 tumors and ≥10% (for pathway genes) or 20% (for non-pathway genes) of all tumors in a tumor type in either species. Genes and pathways with the mutation frequency that are significantly different (q < 0.05 from Fisher exact tests followed by multiple testing correction) and have ≥2-fold changes between the two species are considered different. Source data are provided as a Source Data file.
Fig. 5
Fig. 5. We investigated TMB and common alterations in each of the 597 tumors of over 7 tumor types and over 35 breeds.
The tumors in the oncoprint were ordered from left to right by lowest to highest TMB. Seven tumor types as indicated in Fig. 3 and unknown tumor types (UCL; see Fig. 1) are included. Breeds shown include those validated, corrected, predicted or unknown (with an issue or not predicted) as shown in Fig. 2, as well as other breeds, which are not validated due to small sample size, and mixed breeds. Top recurrent gene and pathway alterations are shown. Source data are provided as a Source Data file.
Fig. 6
Fig. 6. TMB varies among tumor types and is correlated with TP53 mutation.
a TMB distributions of each canine tumor type ordered left to right from lowest to highest median values. The left plot shows that problematic genes (see “Methods”) have significantly higher TMB than other genes, and thus were excluded from further analyses. The right plot indicates that canine tumors are classified into TMB-low (TMB-L) and -high (TMB-H). Two-sided Wilcoxon tests were conducted to examine the TMB difference between two groups indicated, with **, ***, **, ****, ***, and **** from left to right representing unadjusted p = 0.006, 0.0006, 0.001, 4.7e−6, 0.0003 and 2e−16, respectively. For significant comparisons, the fold change in median TMB is also indicated. n = 202, 49, 55, 38, 71, 78, 49, 306 and 236 independent tumors for each tumor type listed from left to right, respectively. b, c TMB distributions of cases with wild type (blue) or mutant (red) TP53 or PIK3CA within each canine (b) or human (c) tumor type. For tumor types with both wild type and mutant groups having ≥5 tumors, two-sided Wilcoxon tests were conducted to determine the significance of the association between TMB and TP53 or PI3KCA, with unadjusted p-values and fold changes shown as described in (a). LGG low-grade glioma, GBM glioblastoma, HGG high-grade glioma. From left to right: b n = 11, 191, 1, 49, 6, 49, 1, 37, 2, 69, 40, 38, 29, 20, 18, 288, 72 and 164 independent tumors for TP53 (***, ***, **, ****, and **** representing p = 0.0002, 0.0003, 0.005, 2.4e−7 and 9.9e−5, respectively), while n = 74, 128, 3, 46, 55, 38, 1, 70, 1, 77, 15, 34, 77, 229, 17 and 219 independent tumors for PIK3CA (** and ** representing p = 0.005 and 0.007, respectively). c n = 345, 703, 249, 265, 121, 268, 5, 36, 4, 38, 7, 39, 20, 29, 14, 34, 22, 44, 19 and 37 independent tumors for TP53 (****, *, ***, *, and ** representing p = 2e−16, 0.02, 0.0006, 0.02 and 0.008, respectively), while n = 347, 701, 42, 472, 36, 353, 41, 42, 1, 45, 2, 47, 10, 38, 8, 58 and 56 independent tumors for PIK3CA. Source data are provided as a Source Data file.
Fig. 7
Fig. 7. TMB is largely independent of breeds.
a TMB distributions of cases grouped by tumor type and then breed. Only groups with ≥10 tumors are shown, with n = 15, 28, 70, 14, 16, 11, 17, 44, 16, 21, 25, 21, 25 and 42 independent tumors from left to right. Two-sided Wilcoxon tests were conducted, with ** and * representing unadjusted p = 0.009 and 0.01, respectively, and fold-changes shown. b TMB distributions of tumors grouped by breed, tumor type, and finally TP53 (top) or PIK3CA (bottom) mutation status. Only groups with TP53 (or PIK3CA) wild-type and mutant-combined tumors of ≥10 are shown, with n = 15, 27, 1, 66, 4, 12, 2, 16, 10, 1, 17, 15, 1, 12, 13, 8, 13, 39, 5, 21, 14, 11, 14 and 28 (top) and n = 12, 3, 18, 10, 41, 29, 8, 6, 10, 6, 6, 5, 17, 16, 24, 1, 21, 44, 21, 25, 29 and 13 (bottom) independent tumors left to the right. Two-sided Wilcoxon tests were conducted, with *, **, and ** from left to right representing unadjusted p = 0.04, 0.003, and 0.008, respectively, and fold-changes shown. Source data are provided as a Source Data file.
Fig. 8
Fig. 8. Golden Retrievers harbor a unique mutation signature that is osteosarcoma-enriched, TMB-associated, and TP53 mutation-independent.
a Three mutation signatures were detected in CDS regions of 597 canine tumors from the WES dataset. Right bars indicate the distribution of the three signatures in each tumor type and each validated breed, with the numbers denoting the tumor counts. Left plots indicate the 96 base substitution patterns (top) and the cosine similarity scores between each canine signature and each of the 30 COSMIC and 12 pediatric, signatures (bottom). b Golden Retriever-specific oncoprint, including 154 animals and presented as described in Fig. 5. Source data are provided as a Source Data file.

References

    1. Dow S. A Role for Dogs in Advancing Cancer Immunotherapy Research. Front Immunol. 2019;10:2935. doi: 10.3389/fimmu.2019.02935. - DOI - PMC - PubMed
    1. Thamm DH. Canine Cancer: Strategies in Experimental Therapeutics. Front Oncol. 2019;9:1257. doi: 10.3389/fonc.2019.01257. - DOI - PMC - PubMed
    1. Somarelli JA, et al. Improving Cancer Drug Discovery by Studying Cancer across the Tree of Life. Mol. Biol. Evol. 2020;37:11–17. doi: 10.1093/molbev/msz254. - DOI - PMC - PubMed
    1. Hanahan D, Weinberg RA. Hallmarks of cancer: the next generation. Cell. 2011;144:646–674. doi: 10.1016/j.cell.2011.02.013. - DOI - PubMed
    1. Alexandrov LB, et al. The repertoire of mutational signatures in human cancer. Nature. 2020;578:94–101. doi: 10.1038/s41586-020-1943-3. - DOI - PMC - PubMed

Publication types

Substances