. 2021 Aug 3;6(1):41.
doi: 10.1038/s41536-021-00151-1.

Driving regeneration, instead of healing, in adult mammals: the decisive role of resident macrophages through efferocytosis

Affiliations

Driving regeneration, instead of healing, in adult mammals: the decisive role of resident macrophages through efferocytosis

Lise Rabiller et al. NPJ Regen Med. .

Abstract

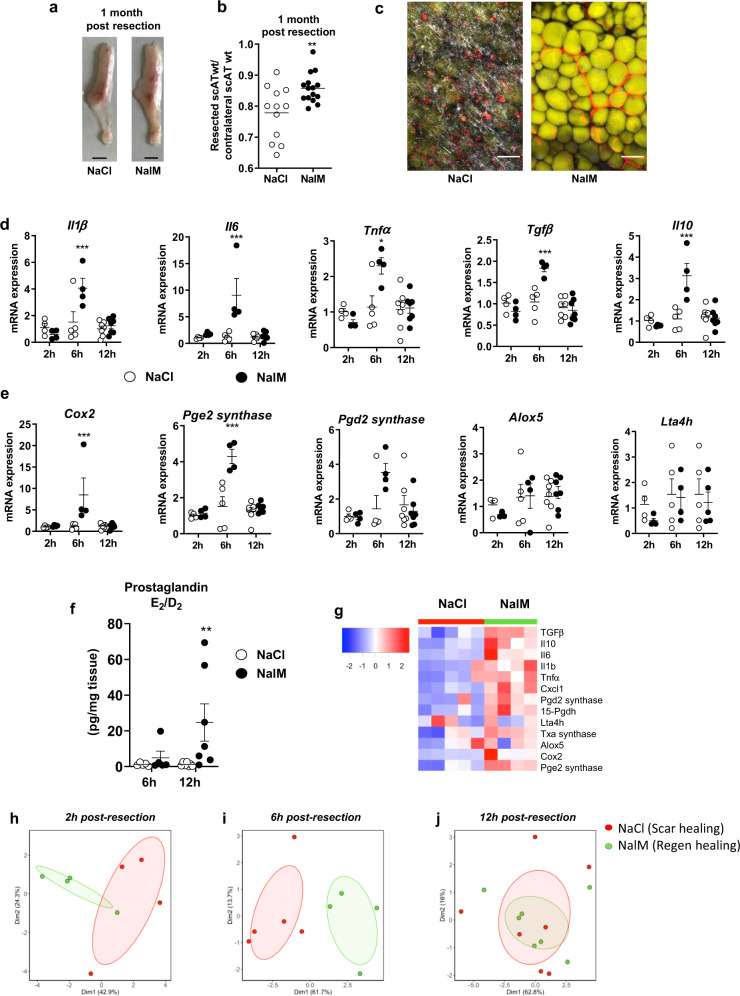
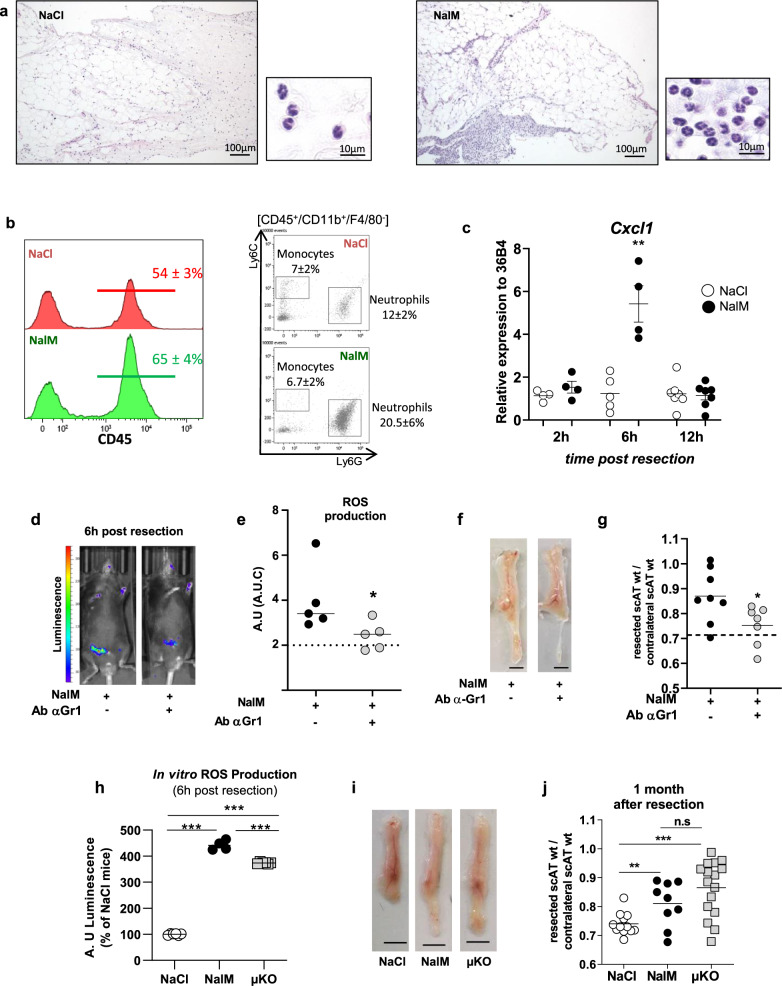
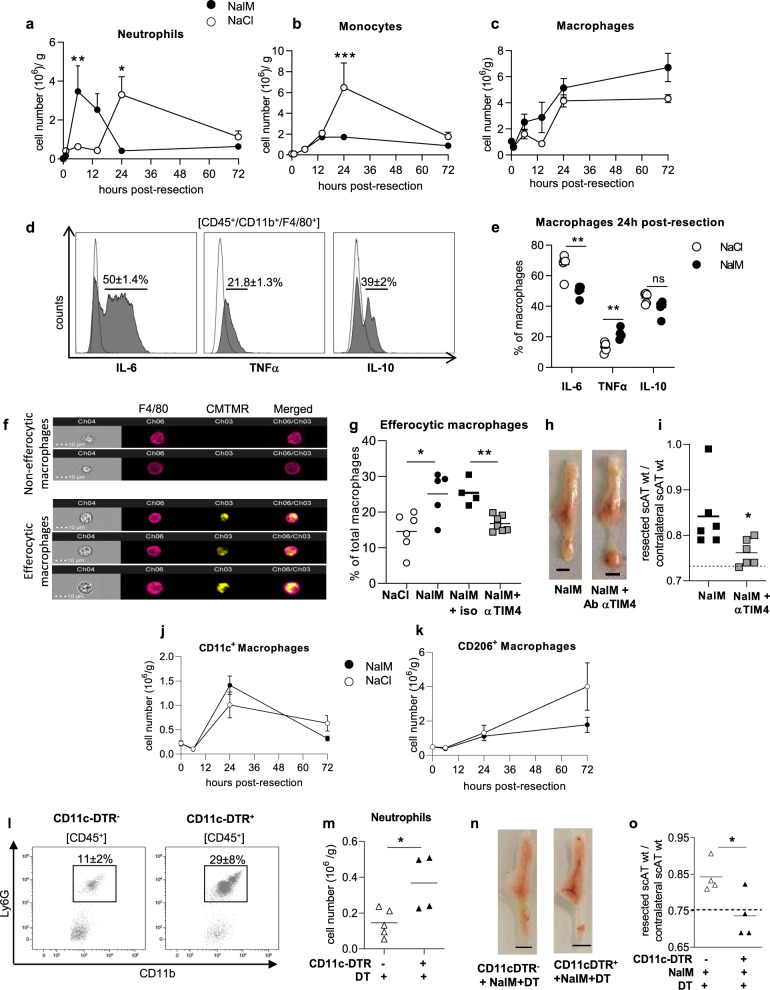
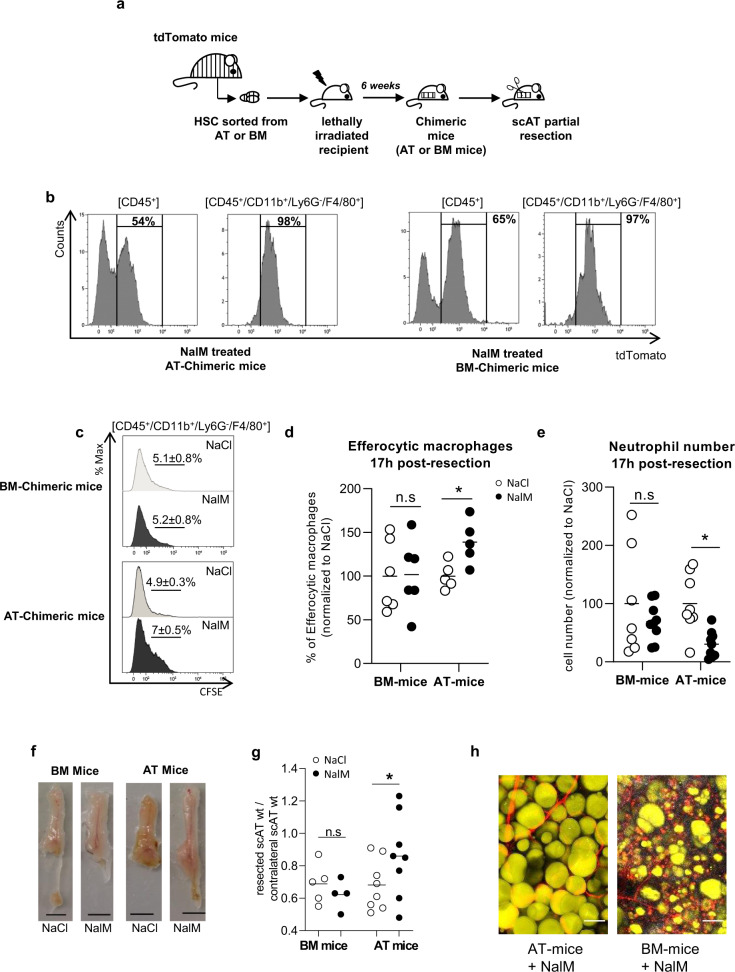
Tissue repair after lesion usually leads to scar healing and thus loss of function in adult mammals. In contrast, other adult vertebrates such as amphibians have the ability to regenerate and restore tissue homeostasis after lesion. Understanding the control of the repair outcome is thus a concerning challenge for regenerative medicine. We recently developed a model of induced tissue regeneration in adult mice allowing the comparison of the early steps of regenerative and scar healing processes. By using studies of gain and loss of function, specific cell depletion approaches, and hematopoietic chimeras we demonstrate here that tissue regeneration in adult mammals depends on an early and transient peak of granulocyte producing reactive oxygen species and an efficient efferocytosis specifically by tissue-resident macrophages. These findings highlight key and early cellular pathways able to drive tissue repair towards regeneration in adult mammals.


Conflict of interest statement

The authors declare no competing interests.

Figures

Fig. 1
Fig. 1. Regenerative healing is characterized by early and transient inflammation.
a Representative pictures of scAT 1 month post-resection and NaCl (scar healing condition) or NalM (regenerative condition) treatment (scale bar: 0.5 cm). b Weight ratio between resected and contralateral scAT 1 month post-resection in NaCl or NalM-treated mice (n = 12–15 per group). c Representative pictures of resection plane area in NaCl and NalM treated mice one month post-resection. Adipocytes (yellow) were stained with Bodipy and vessels (red) with in vivo Lectin injection. Collagen fibers (gray) were imaged using a second harmonic generation (SHG) signal. Images were obtained using maximum intensity projections of 23 stack images. (scale bar: 50 µm). d, e Quantification by RTqPCR at 2 h, 6 h, and 12 h post-resection of mRNA encoding cytokines (Interleukin 1β, 6 (Il1β, Il6), Tumor Necrosis Factor α (Tnfα), Transforming Growth Factor β (Tgfβ) and interleukin 10 (Il10)) (d) and enzymes involved in lipid mediator synthesis (Cyclooxygenase 2 (cox2), Prostaglandin E2 synthase (Pge2 synthase), Prostaglandin D2 synthase (Pgd2 synthase), Arachidonate 5-lipoxygenase (Alox5) and Leukotriene A4 Hydrolase (Lta4h)) (e) in SVF isolated from the injured scAT of NaCl or NalM treated mice (n = 4–6 per group). f Quantification of PGD2 and PGE2 metabolites in the exudate of the resection plane of NaCl or NalM treated mice, 6 and 12 h post-resection. Results are expressed as a ratio between PGD2 and PGE2 metabolites (n = 5–7 per group). g Heatmap performed on 14 standardized gene expressions, 6 h post-resection. The dendrogram performed according to the Ward method was able to cluster between scar and regenerative healing conditions. Principal component analysis performed at 2 h (h) 6 h (i) and 12 h (j) post-resection on standardized gene expression. Individuals with scar healing and regenerative healing signatures were colored in red and green, respectively. Data are represented as mean ± SEM. (*p < 0.05, **p < 0.01, ***p < 0.001 between scar and regenerative healing conditions). NalM naloxone methiodide, scAT subcutaneous adipose tissue, SVF stromal vascular fraction, wt weight.
Fig. 2
Fig. 2. Neutrophils depletion impairs ROS production and inhibits scAT regeneration in NalM-treated mice.
a Representative comparative microscopic aspects of the resection plane of scAT 8 h post-surgery in NaCl and NalM-treated mice (Hemalun & eosin staining). b Representative histograms and dot plot analyses of SVF cells isolated from NaCl (red curve) or NalM (green curve) treated mice 6 h post-resection, showing the percentage of CD45+ cells and granulocytes (neutrophils: CD45+/Ly6G+/Ly6C/CD11b+ and monocytes CD45+/Ly6G/Ly6C+/CD11b+) in the resection plane. c Gene expression quantification by RT-qPCR of the chemokine Cxcl1 in SVF isolated from the resection plane of NaCl-treated or NalM-treated mice 2, 6, and 12 h post-resection (n = 4 per group). d Representative in vivo imaging of ROS production 6 h post-resection in NalM-treated mice, treated or not with anti-Gr1 blocking antibody (Ab α-Gr1). e Quantification of ROS production in vivo from 0 to 72 h post-resection in NalM-treated mice, treated or not with Ab α-Gr1. The dotted lines represent ROS production obtained in NaCl-treated mice (n = 5 per group). f Representative pictures of scAT 1 month post-resection, in NalM-treated mice treated or not with Ab α-Gr1 (scale bar: 0.5 cm). g Weight ratio between resected and contralateral scAT 1 month post-resection in NalM treated mice, treated with isotype or Ab α-Gr1 (n = 7–8 per group). The dotted line show values obtained in scar healing (NaCl) conditions. h In vitro quantification of ROS production by Gr1+ populations sorted from scAT of NaCl, NalM, or µKO mice 6 h post-resection (n = 4-6 per group). i Representative pictures of scAT 1 month post-resection, in NaCl or NalM-treated mice and in NaCl-treated mice knock out for the µ opioid receptor (µKO) (scale bar: 0.5 cm). j Weight ratio between resected and contralateral scAT 1 month post-resection in NaCl, NalM-treated and µKO mice (n = 9–16 per group). Data are represented as mean ± SEM (*p < 0.05, ***p < 0.001 between scar and regenerative healing conditions). AT adipose tissue, AU arbitrary units, AUC area under the curve, NalM naloxone methiodide, scAT subcutaneous adipose tissue, SVF stromal vascular fraction, ROS reactive oxygen species, wt weight.
Fig. 3
Fig. 3. Efficient efferocytosis of apoptotic neutrophils by CD11c+ macrophages is required for regeneration.
Time-course study of the number of neutrophils (CD45+/CD11b+/F4/80/Ly6C/Ly6G+) (a), monocytes (CD45+/CD11b+/F4/80/Ly6C+/Ly6G) (b) and macrophages (CD45+/CD11b+/F4/80+/Ly6G) (c) in the scAT of NaCl and NalM treated mice (n = 5–13 per group). d Representative histogram of flow cytometry of IL-6, TNFα, and IL-10 staining (gray histogram) or isotype (white histogram) on macrophages in resection planes 24 h post-resection. e Percentage of IL-6, TNFα, and IL-10 producing macrophages in NaCl or NalM treated mice 24 h post-resection (n = 5 per group). f Examples of the imaging flow cytometry channels of macrophages stained with F4/80 (pink) and having engulfed (lower panels) or not (upper panels) CMTMR stained apoptotic neutrophils (yellow) in scAT of NaCl-treated mice 17 h post-resection. g Quantification of efferocytic macrophages in the scAT of NaCl and NalM-treated mice with isotype or TIM4 blocking antibody (n = 4–7 per group). h Representative pictures of scAT 1 month post-resection, in mice treated with NalM and with or without blocking TIM4 antibody (scale bar: 0.5 cm). i Weight ratio between resected and contralateral scAT 1 month post-resection in mice treated with NalM and with or without blocking TIM4 antibody (n = 6) The dotted line show values obtained in scar healing (NaCl) conditions. Quantification of macrophages CD11c+ (j) and CD206+ (k) in NaCl and NalM-treated mice 24 h post-resection, (n = 5 per group). l Representative dot plots of flow cytometry analyses showing neutrophils (CD45+/CD11b+/F4/80/Ly6C/Ly6G+) 24 h post-resection in scAT of CD11c-DTR+ and CD11c-DTR mice treated with NalM and diphtheria toxin (DT). m Quantification of neutrophils 24 h post-resection in CD11c-DTR+ and CD11c-DTR- mice treated with DT and NalM (n = 4–5 per group). n Representative pictures of scAT 1 month post-resection in CD11c-DTR+ and CD11c-DTR mice treated with NalM and DT (scale bar: 0.5 cm). o Weight ratio between resected and contralateral scAT in CD11c-DTR+ and CD11c-DTR mice treated with NalM and DT (n = 4). The dotted line shows values obtained in scar healing (NaCl) conditions. Data are represented as mean ± SEM. (*p < 0.05, **p < 0.01 between scar and regenerative healing conditions). Ab Antibody, NalM naloxone methiodide, CMTMR 5-(and-6)-(((4-chloromethyl)benzoyl)amino)tetramethylrhodamine, scAT subcutaneous adipose tissue, wt weight.
Fig. 4
Fig. 4. AT Resident macrophages but not classical BM-derived macrophages are required for tissue regeneration.
a Hematopoietic chimera strategy: 2 × 103 LSK cells sorted from the scAT or the bone marrow (BM) of mTmG mice were co-injected with 2 × 105 total BM cells of C57Bl6 into lethally irradiated C57Bl6 recipients. Two months after hematopoietic reconstitution, scAT resection was performed and chimeric mice were treated with NaCl or NalM. b Representative histograms showing chimerism (tdTomato staining) in total immune cells (CD45+) and macrophages (CD45+/CD11b+/Ly6G-/F4/80+) in NalM-treated AT- and BM-chimeric mice, 24 h post-resection. c Representative histograms of CFSE staining in macrophages 24 h post-resection in NaCl and NalM-treated chimeric mice, corresponding to the percentage of macrophages having engulfed CFSE+ neutrophils. d Quantification of efferocytic macrophages 24 h post-resection in NaCl and NalM-treated chimeric mice (n = 5–6). e Quantification of neutrophil number by flow cytometry 24 h post-resection, in NaCl or NalM, treated mice (n = 7–8 per group). f Representative pictures of scAT 1 month post-resection, in BM- and AT-chimeric mice treated or not with NalM (scale bar: 0.5 cm). g Weight ratio between resected and contralateral scAT in AT- and BM-chimeric mice 1-month post-resection (n = 5–8 per group). h Representative pictures of resection plane area of NalM-treated AT- and BM- chimeric mice, one-month post resection. Adipocytes (yellow) were stained with Bodipy and vessels (red) with in vivo Lectin injection. Collagen fibers (gray) were imaged using second harmonic generation (SHG) signal. Images were obtained using maximum intensity projections of 23 stack images (scale bar: 50 µm). Data are represented as mean ± SEM. (*p < 0.05, **p < 0.01, ***p < 0.001 between scar and regenerative healing conditions). AT adipose tissue, BM bone marrow, LSK Lin/Sca-1+/cKit+ cells, NalM naloxone methiodide, scAT subcutaneous adipose tissue, wt weight.

References

    1. Gurtner GC, Werner S, Barrandon Y, Longaker MT. Wound repair and regeneration. Nature. 2008;453:314–321. doi: 10.1038/nature07039. - DOI - PubMed
    1. Seifert AW, et al. Skin shedding and tissue regeneration in African spiny mice (Acomys) Nature. 2012;489:561–565. doi: 10.1038/nature11499. - DOI - PMC - PubMed
    1. Deng Z, et al. Characterization of articular homeostasis and the mechanism of superior cartilage regeneration of MRL/Mpj mice. FASEB J. 2019;33:8809–8821. doi: 10.1096/fj.201802132RR. - DOI - PubMed
    1. Labit E, et al. Opioids prevent regeneration in adult mammals through inhibition of ROS production. Sci. Rep. 2018;8:12170. doi: 10.1038/s41598-018-29594-1. - DOI - PMC - PubMed
    1. Mittal M, Siddiqui MR, Tran K, Reddy SP, Malik AB. Reactive oxygen species in inflammation and tissue injury. Antioxid. Redox Signal. 2014;20:1126–1167. doi: 10.1089/ars.2012.5149. - DOI - PMC - PubMed