. 2021 Aug 3;11(1):15714.
doi: 10.1038/s41598-021-94615-5.

Macroscale patterns of oceanic zooplankton composition and size structure

Collaborators, Affiliations

Macroscale patterns of oceanic zooplankton composition and size structure

Manoela C Brandão et al. Sci Rep. .

Erratum in

  • Author Correction: Macroscale patterns of oceanic zooplankton composition and size structure.
    Brandão MC, Benedetti F, Martini S, Soviadan YD, Irisson JO, Romagnan JB, Elineau A, Desnos C, Jalabert L, Freire AS, Picheral M, Guidi L, Gorsky G, Bowler C, Karp-Boss L, Henry N, de Vargas C, Sullivan MB; Tara Oceans Consortium Coordinators; Stemmann L, Lombard F. Brandão MC, et al. Sci Rep. 2021 Oct 6;11(1):20226. doi: 10.1038/s41598-021-99772-1. Sci Rep. 2021. PMID: 34615992 Free PMC article. No abstract available.

Abstract

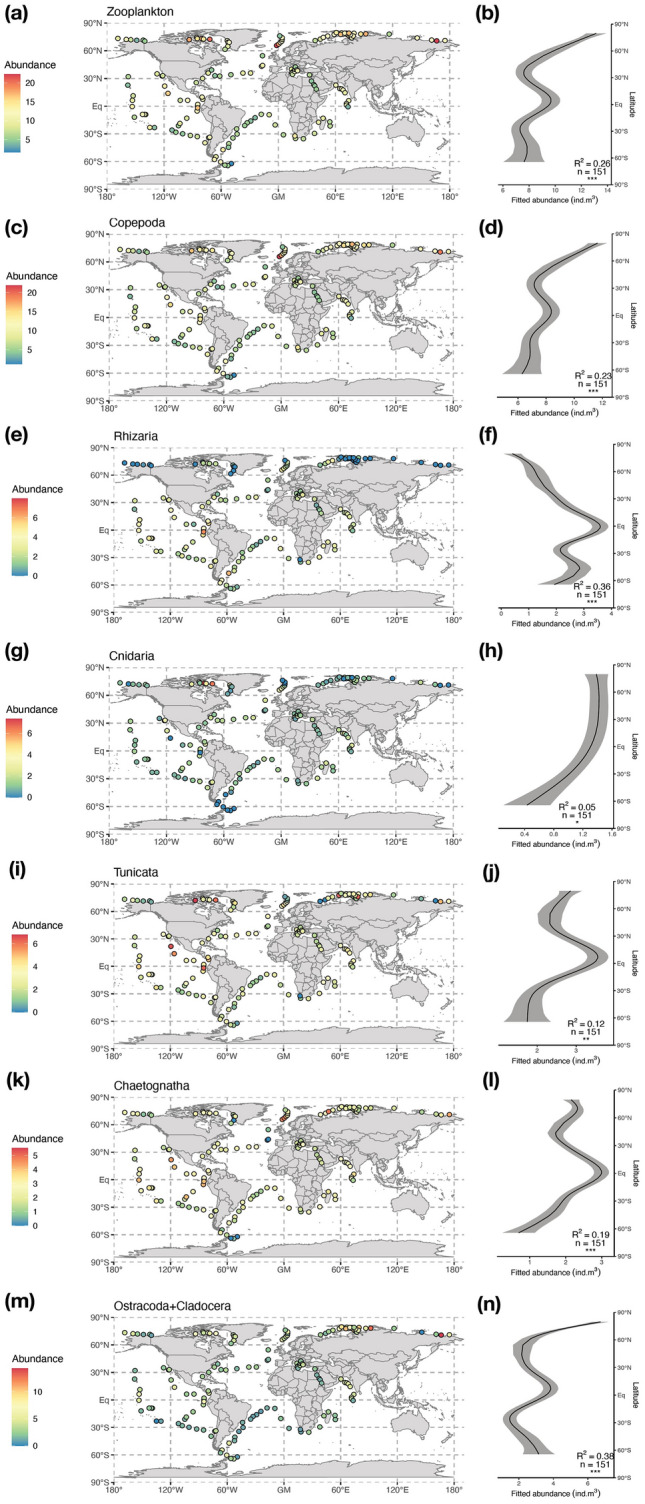
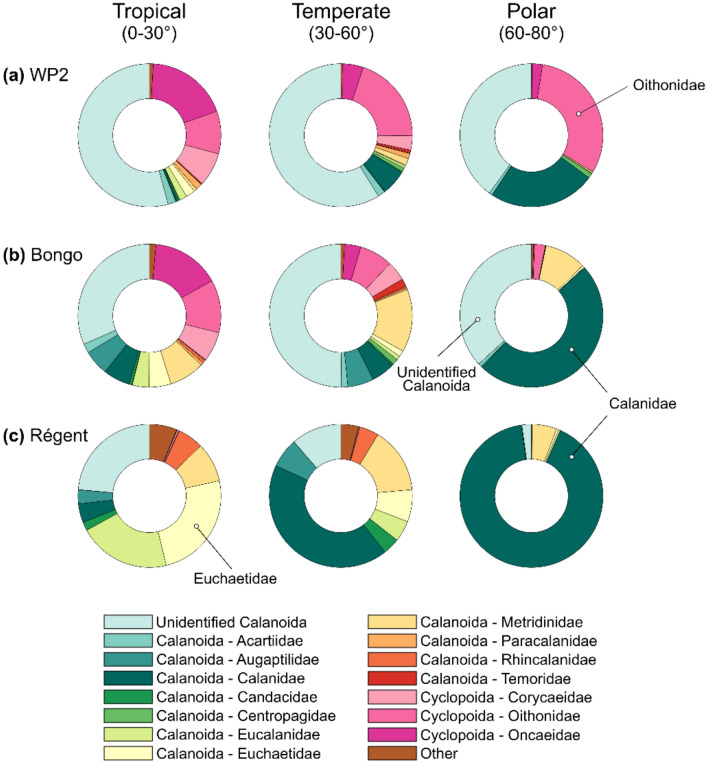
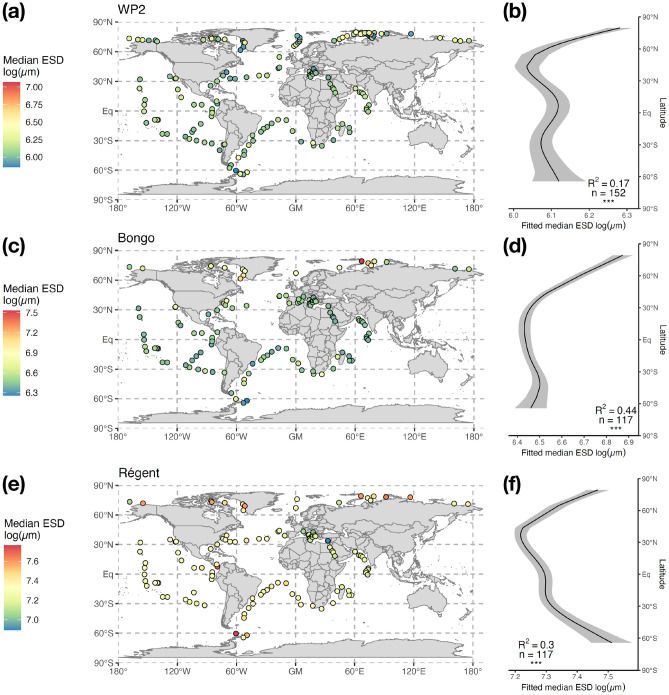
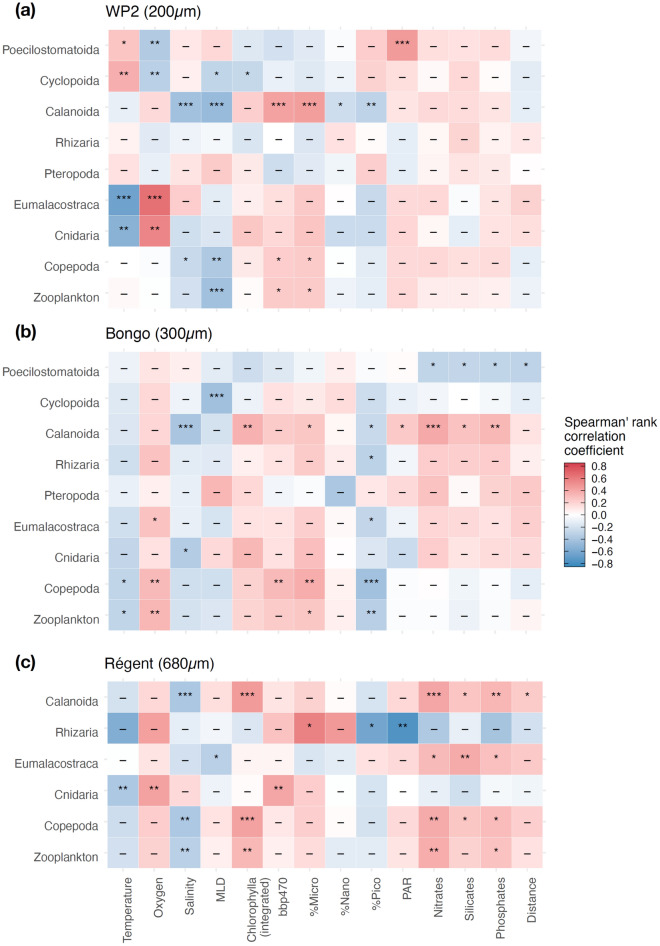
Ocean plankton comprise organisms from viruses to fish larvae that are fundamental to ecosystem functioning and the provision of marine services such as fisheries and CO2 sequestration. The latter services are partly governed by variations in plankton community composition and the expression of traits such as body size at community-level. While community assembly has been thoroughly studied for the smaller end of the plankton size spectrum, the larger end comprises ectotherms that are often studied at the species, or group-level, rather than as communities. The body size of marine ectotherms decreases with temperature, but controls on community-level traits remain elusive, hindering the predictability of marine services provision. Here, we leverage Tara Oceans datasets to determine how zooplankton community composition and size structure varies with latitude, temperature and productivity-related covariates in the global surface ocean. Zooplankton abundance and median size decreased towards warmer and less productive environments, as a result of changes in copepod composition. However, some clades displayed the opposite relationships, which may be ascribed to alternative feeding strategies. Given that climate models predict increasingly warmed and stratified oceans, our findings suggest that zooplankton communities will shift towards smaller organisms which might weaken their contribution to the biological carbon pump.


Conflict of interest statement

The authors declare no competing interests.

Figures

Figure 1
Figure 1
Maps and latitudinal patterns of the abundance (cubic-transformed ind m3) of (a,b) Total zooplankton, (c,d) Copepoda, (e,f) Rhizaria, (g,h) Cnidaria, (i,j) Tunicata, (k,l) Chaetognatha, and (m,n) Ostracoda + Cladocera observed in samples collected by the WP2 net. The solid curves on the right-hand side plots illustrate the prediction from the Generalized Additive Model (GAM) fitting abundance against latitude. The explanatory power of the GAM (adjusted R2), the number of samples used and the significance of the smooth term (p < 0.001 = ***, p < 0.01 = ***, p < 0.05 = *, p > 0.05 = ns) are reported on the plots. The grey ribbon illustrates the standard error of the GAM prediction.
Figure 2
Figure 2
Variations in Copepoda community composition across the tropical (0–30°), temperate (30°–60°) and polar (> 60°) latitudinal bands, depicted through the changes in relative abundances of the copepod Orders (Calanoida, Cyclopoida and Poecilostomatoida) and Families sampled by the (a) Bongo net, (b) WP2 net, and (c) Régent net. Taxa with lower than 1% are not shown. Unidentified categories correspond to those organisms that could be assigned to an Order but not to a Family because of the limited resolution of the imaging system.
Figure 3
Figure 3
Maps and latitudinal patterns of the logged median Equivalent Spherical Diameter (ESD, µm) observed for Copepoda based on (a,b) WP2 samples (200 µm mesh), (c,d) Bongo samples (300 µm mesh) and (e,f) Régent samples (680 µm mesh). The major and minor axes of the best fitting ellipses were measured for each organism to estimate their ESD. Community-level size structure was determined through the median value of the ESD distribution at individual-level. The solid curves in the right-hand side plots illustrate the prediction from the Generalized Additive Model (GAM) fitting median ESD as a function of latitude. The explanatory power of the GAM (adjusted R2), the number of samples used and the significance of the smooth term (p < 0.001 = ***, p < 0.01 = ***, p < 0.05 = *, p > 0.05 = ns) are reported on the plots. The grey ribbon illustrates the standard error of the prediction. Only the stations where ESD was measured for at least 20 individuals were considered.
Figure 4
Figure 4
Heatmaps of the Spearman’s rank correlation coefficients computed between the size structure (i.e., logged median Equivalent Spherical Diameter; ESD) of the main zooplankton groups and the selected 14 covariates depicting the environmental conditions in the global surface ocean as sampled by (a) WP2 net (200 µm mesh), (b) Bongo net (300 µm mesh) and (c) Régent net (680 µm). The significance of the Spearman’s rank correlation tests are reported in the tiles (p < 0.001 = ***, p < 0.01 = ***, p < 0.05 = *, p > 0.05 = ns). Only the zooplankton groups displaying significant correlation coefficients for more than one environmental covariate in at least one net parameter are shown (see Supplementary Fig. S8 for all groups). Only the stations where ESD was measured for at least 20 individuals of a group were considered when computing the correlation coefficients. Distance stands for distance to coast (in km).
Figure 5
Figure 5
Two dimensional metric dimensional scaling (MDS) plot illustrating the similarity between the responses of the groups’ median ESD to the environmental covariates selected. The smoothing curves from the Generalized Additive Models (GAMs) modelling the global gradients in log-transformed median Equivalent Spherical Diameter (ESD, µm) of the zooplankton groups (estimated for various plankton nets) as a function of ten environmental covariates and displaying a deviance explained > 40%. The smoothing curves were combined into a multivariate data series to compute Dynamic Time Warping (DTW) distances and perform partitioning around medoids (PAM) clustering. This way the GAMs were clustered into four clusters representing combinations of zooplankton groups and plankton nets that exhibit similar median ESD-covariate relationships.
Figure 6
Figure 6
Two dimensional metric dimensional scaling (MDS) plot illustrating the similarity between the responses of the groups’ abundances to the environmental covariates selected. The smoothing curves from the Generalized Additive Models (GAMs) modelling the global gradients in cubic-transformed abundances (ind m3) of the zooplankton groups (estimated for various plankton nets) as a function of ten environmental covariates and displaying a deviance explained > 40%. Smoothing curves span a 1–100 scale spanning the range of the covariates measured values. The smoothing curves were combined into a multivariate data series to compute Dynamic Time Warping (DTW) distances and perform partitioning around medoids (PAM) clustering. This way the GAMs were clustered into four clusters that represent combinations of zooplankton groups and plankton nets that exhibit similar abundance-covariate relationships.

References

    1. Litchman E, Ohman MD, Kiørboe T. Trait-based approaches to zooplankton communities. J. Plankton Res. 2013;35:473–484. doi: 10.1093/plankt/fbt019. - DOI
    1. Kiørboe T, Hirst AG. Shifts in mass scaling of respiration, feeding, and growth rates across life-form transitions in marine pelagic organisms. Am. Nat. 2014;183:E118–E130. doi: 10.1086/675241. - DOI - PubMed
    1. Andersen KH, et al. Characteristic sizes of life in the oceans, from bacteria to whales. Annu. Rev. Mar. Sci. 2015;8:1–25. doi: 10.1146/annurev-marine-122414-034144. - DOI - PubMed
    1. Bergmann C. Über die Verhältnisse der Wärmeökonomie der Thiere zu ihrer Grösse. Göttinger Studien. 1847;3:595–708.
    1. Woodson C, Schramski JR, Joye SB. A unifying theory for top-heavy ecosystem structure in the ocean. Nat. Commun. 2018;9:1–8. doi: 10.1038/s41467-017-02450-y. - DOI - PMC - PubMed

Publication types