. 2021 Jun 26;17(11):2703-2717.
doi: 10.7150/ijbs.59404. eCollection 2021.

Tagitinin C induces ferroptosis through PERK-Nrf2-HO-1 signaling pathway in colorectal cancer cells

Affiliations

Tagitinin C induces ferroptosis through PERK-Nrf2-HO-1 signaling pathway in colorectal cancer cells

Ruiran Wei et al. Int J Biol Sci. .

Abstract

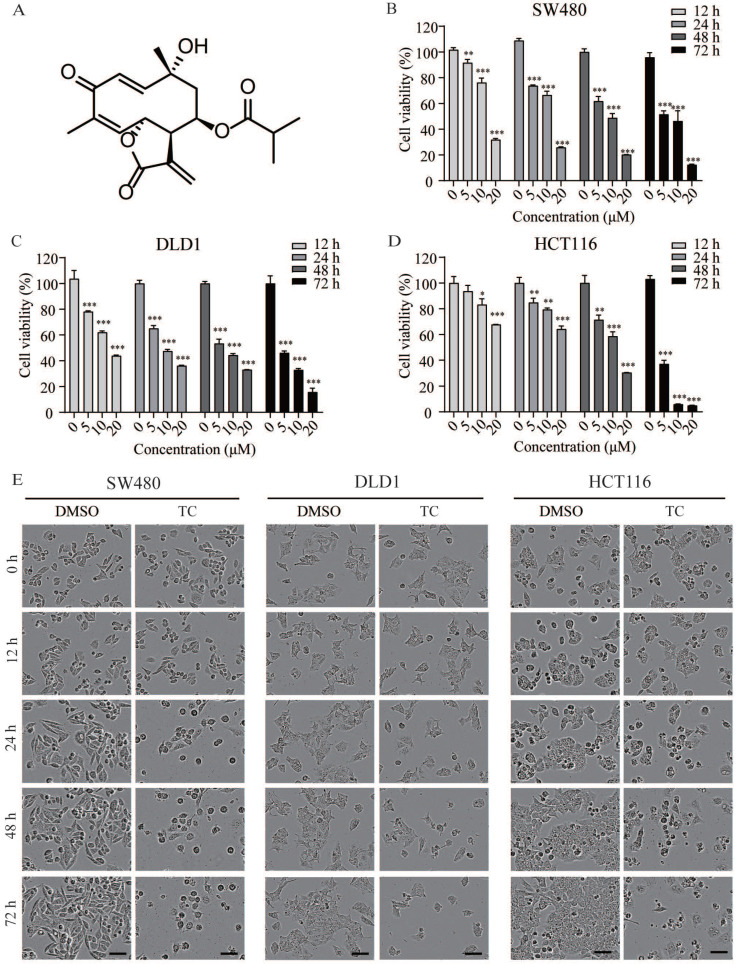
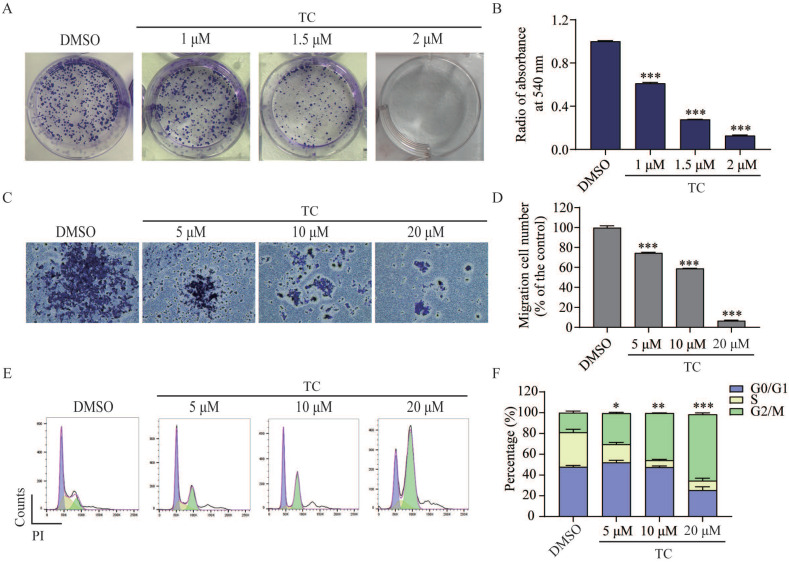
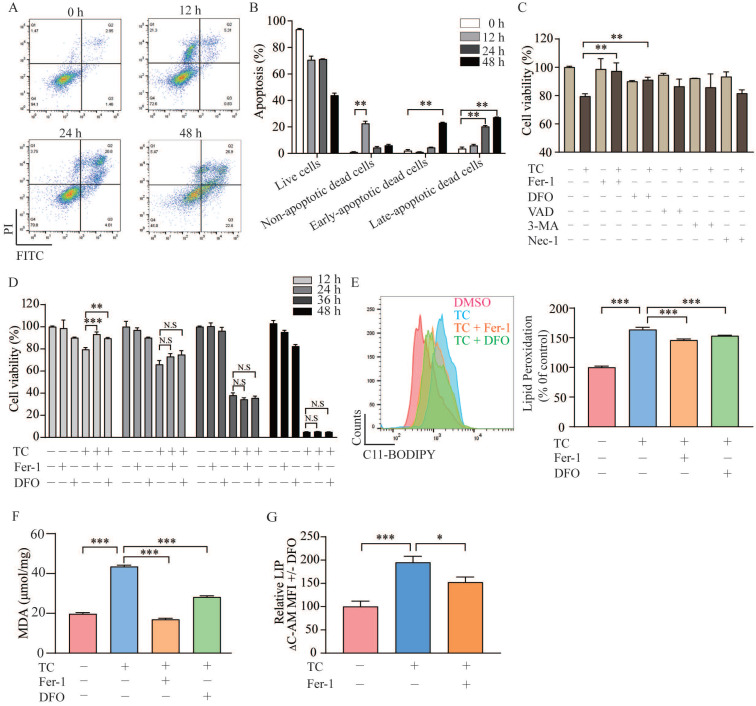
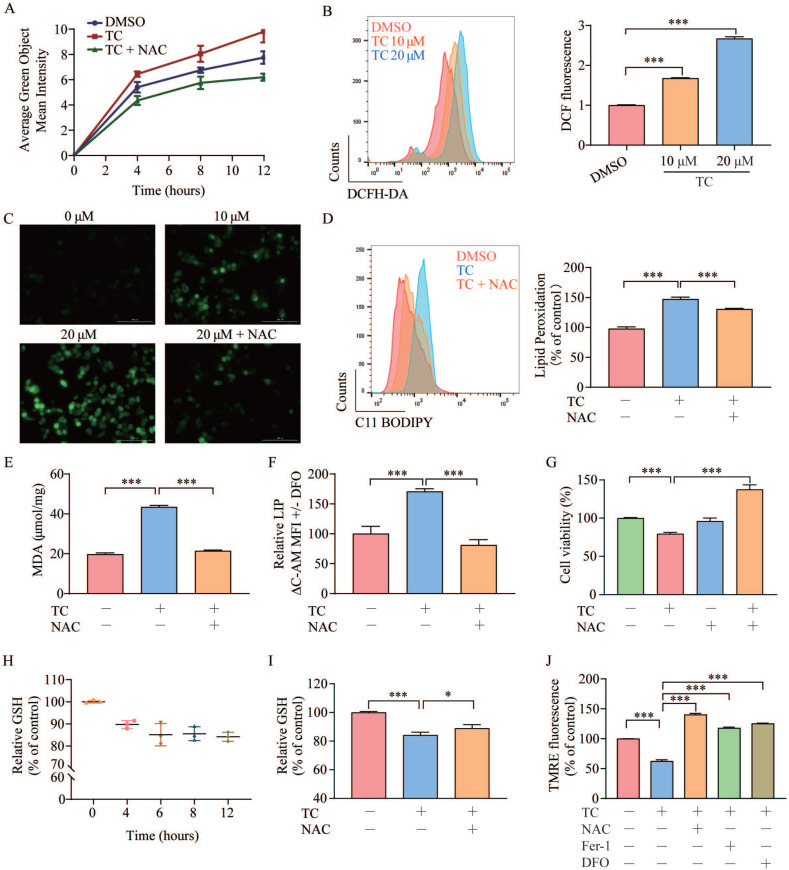
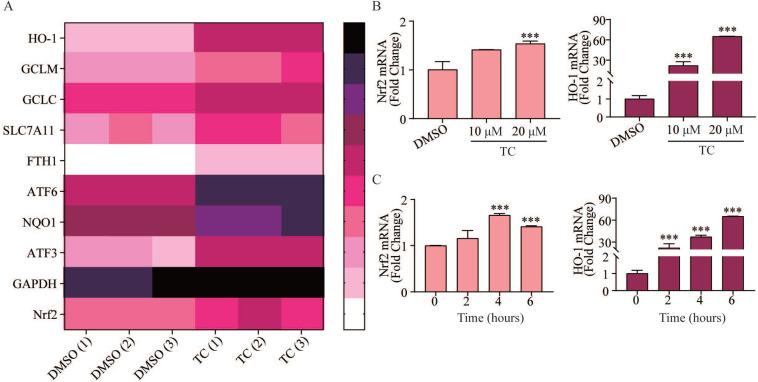
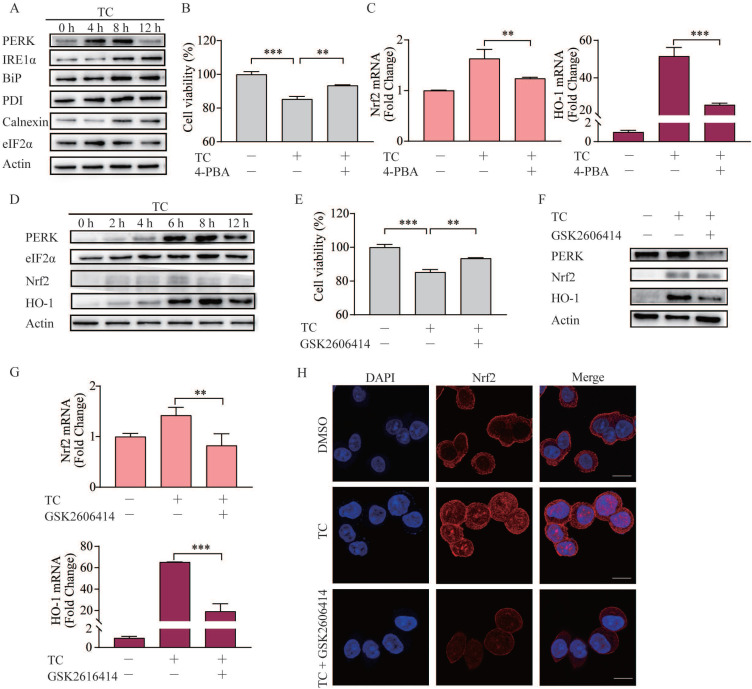
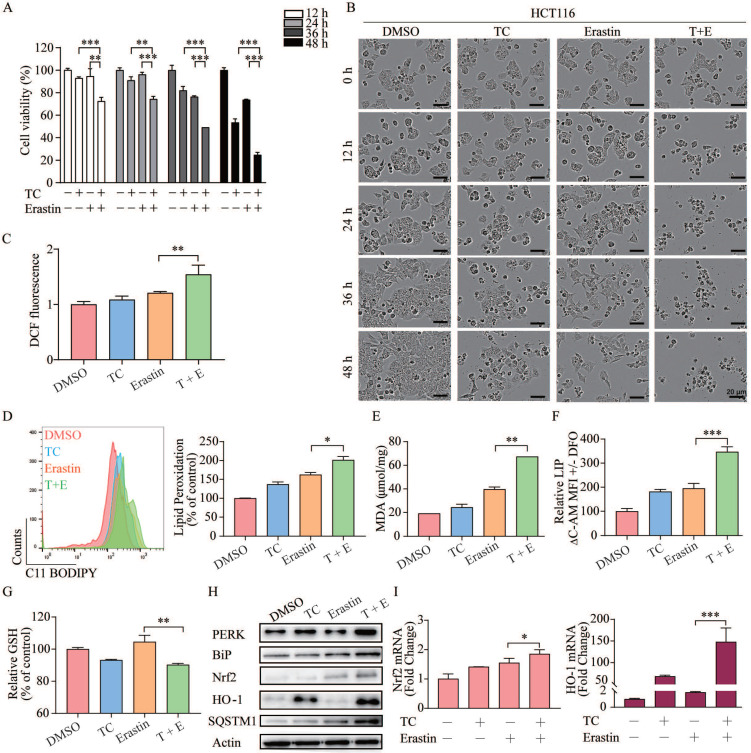
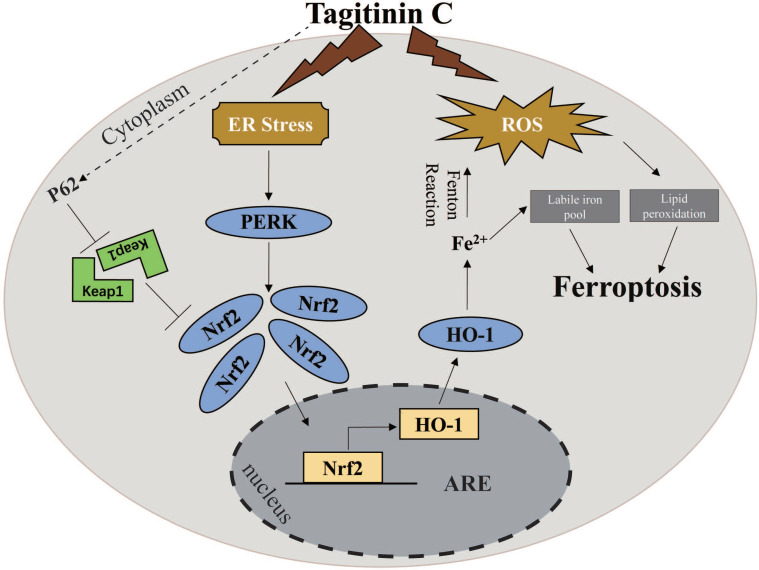
Rationale: Colorectal cancer (CRC) is a common malignant tumor of the digestive system. However, the efficacy of surgery and chemotherapy is limited. Ferroptosis is an iron- and reactive oxygen species (ROS)-dependent form of regulated cell death (RCD) and plays a vital role in tumor suppression. Ferroptosis inducing agents have been studied extensively as a novel promising way to fight against therapy resistant cancers. The aim of this study is to investigate the mechanism of action of tagitinin C (TC), a natural product, as a novel ferroptosis inducer in tumor suppression. Methods: The response of CRC cells to tagitinin C was assessed by cell viability assay, clonogenic assay, transwell migration assay, cell cycle assay and apoptosis assay. Molecular approaches including Western blot, RNA sequencing, quantitative real-time PCR and immunofluorescence were employed as well. Results: Tagitinin C, a sesquiterpene lactone isolated from Tithonia diversifolia, inhibits the growth of colorectal cancer cells including HCT116 cells, and induced an oxidative cellular microenvironment resulting in ferroptosis of HCT116 cells. Tagitinin C-induced ferroptosis was accompanied with the attenuation of glutathione (GSH) levels and increased in lipid peroxidation. Mechanistically, tagitinin C induced endoplasmic reticulum (ER) stress and oxidative stress, thus activating nuclear translocation of nuclear factor erythroid 2-related factor 2 (Nrf2). As a downstream gene (effector) of Nrf2, heme oxygenase-1 (HO-1) expression increased significantly with the treatment of tagitinin C. Upregulated HO-1 led to the increase in the labile iron pool, which promoted lipid peroxidation, meanwhile tagitinin C showed synergistic anti-tumor effect together with erastin. Conclusion: In summary, we provided the evidence that tagitinin C induces ferroptosis in colorectal cancer cells and has synergistic effect together with erastin. Mechanistically, tagitinin C induces ferroptosis through ER stress-mediated activation of PERK-Nrf2-HO-1 signaling pathway. Tagitinin C, identified as a novel ferroptosis inducer, may be effective chemosensitizer that can expand the efficacy and range of chemotherapeutic agents.

Keywords: ER stress; Nrf2-HO-1 pathway; ROS; ferroptosis; tagitinin C.


Conflict of interest statement

Competing Interests: The authors have declared that no competing interest exists.

Figures

Figure 1
Figure 1
Tagitinin C suppresses cell growth and induces cell death. (A) The chemical structure of tagitinin C. (B-D) Cell viability of SW480, DLD1, and HCT116 cells were measured by MTT assay after treatment with indicate concentration of tagitinin C (5, 10, 20 µM) at 12, 24, 48, 72 h. (E) Cell morphology of SW480, DLD1, and HCT116 after treatment with concentration of tagitinin C (20 µM) at 0, 12, 24, 48, and 72 h (magnification, ×10). Data were presented as Mean ± SD. Scale bar indicates 40 µm. Statistical analysis was carried out between tagitinin C-treated group and DMSO group: * p ≤ 0.05, **p ≤ 0.01, *** p ≤ 0.001.
Figure 2
Figure 2
Tagitinin C inhibits the colony formation, cell migration abilities and induces G2/M cell cycle arrest in HCT116 cells. (A-B) Tagitinin C inhibited the colony formation ability of HCT116 cells in a dose-dependent manner. (A) Representative images of cell colonies after 14 days treatment tagitinin C (1, 1.5, 2 µM). (B) Bar graph shows the quantification of colonies numbers by measuring absorbance at 540 nm. (C-D) Tagitinin C inhibited the migration ability of HCT116 cells. (C) Transwell migration assay was performed in HCT116 cells treated with tagitinin C (5, 10, 20 µM) and representative images were shown. (D) Quantitative analysis for number of migrated HCT116 cells. (E-F) Tagitinin C induced G2/M cell cycle arrest in HCT116 cells. Representative images (E) and quantifications of populations of HCT116 cells in the cell cycle (F) after cells were treated with increasing concentration of tagitinin C (5, 10, 20 µM) for 24 h. Data were presented as Mean ± SD. Scale bar indicates 100 µm. Statistical analysis was carried out between tagitinin C-treated group and DMSO group: * p ≤ 0.05, ** p ≤ 0.01, *** p ≤ 0.001.
Figure 3
Figure 3
Tagitinin C induces ferroptosis in HCT116 cells. (A-B) Flow cytometric analysis of apoptosis in the HCT116 cells treated with tagitinin C (20 µM) after 0, 12, 24, 48 h. Image (A) and quantitative analysis for apoptotic cells (B) were presented. (C) Cell viability was measured using CCK-8 assay in control cells and cells treated with tagitinin C (20 µM) with or without Fer-1 (1 µM), DFO (5 µM), Z-VAD-FMK (20 µM), 3-MA (2 mM), and Nec-1 (50 µM) at 12 h. (D) Fer-1 (1 µM) and DFO (5 µM) rescued tagitinin C-induced cell death at 12 h. (E) Fer-1 and DFO blocked tagitinin C-induced lipid peroxidation, quantified using C11-BODIPY lipid probe using flow cytometry in HCT116 cells. (F) Quantification of cellular MDA levels using the TBA method. (G) Quantification of cellular LIP levels using the calcein-AM (C-AM) method. The mean fluorescence intensity (MFI) of C-AM is subtracted from the MFI of C-AM treated with DFO. Data were presented as Mean ± SD. Statistical analysis was carried out between tagitinin C-treated group and DMSO group: * p ≤ 0.05, ** p ≤ 0.01, *** p ≤ 0.001.
Figure 4
Figure 4
Tagitinin C induces ROS generation and contributes to mitochondrial dysfunction. (A-C) DCFH-DA probe was used to detected ROS levels in HCT116 cells by Incucyte S3 (A), flow cytometry (B) and fluorescence microscope (C) (magnification, ×20) respectively. (D-E) Tagitinin C (20 µM) increased the level of lipid peroxidation (D), MDA (E) and LIP (F), which could be blocked by NAC (200 µM). (G) Cell viability was measured using CCK-8 assay in control cells and cells treated with tagitinin C with or without NAC (200 µM) at 12 h. (H) Quantification of the reduced cellular GSH levels using the MCB method. (I) Tagitinin C (20 µM) decreased the level of GSH, which could be blocked by NAC (200 µM). (J) Tagitinin C (20 µM) decreased the TMRE fluorescence in HCT116 cells, which could be blocked by NAC (200 µM), Fer-1 (1µM) and DFO (5 µM). Data were presented as Mean ± SD. Scale bar indicates 100 µm. Statistical analysis was carried out between tagitinin C-treated group and DMSO group: * p ≤ 0.05, ** p ≤ 0.01, *** p ≤ 0.001.
Figure 5
Figure 5
Tagitinin C activates Nrf2-HO-1 signaling pathway. (A) Heat map showed differentially up-regulated genes in response to tagitinin C treatment measured using RNA-seq analysis. Low expression is depicted in white, and high expression is depicted in black. (B-C) Nrf2 and HO-1 mRNA was measured at indicated concentrations or time after treatment of tagitinin C. Data were presented as Mean ± SD. Statistical analysis was carried out between tagitinin C-treated group and DMSO group: * p ≤ 0.05, ** p ≤ 0.01, *** p ≤ 0.001.
Figure 6
Figure 6
Tagitinin C induces ER stress, which mediates Nrf2-HO-1 activation. (A) HCT116 cells stimulated ER stress. HCT116 cells were treated with 20 µM tagitinin C for the indicated time. ER stress-related proteins were determination by Western blot analysis. (B) Cell viability was measured using CCK-8 assay in control cells and cells treated with tagitinin C (20 µM) with/without 4-PBA (20 µM). (C) HCT116 cells were treated with tagitinin C (20 µM) with 4-PBA (20 µM) for 6 h, the cells were collected and used for Nrf2 and HO-1 mRNA determination. (D) HCT116 cells were treated with 20 µM tagitinin C for the indicated time intervals. Cells were collected for PERK, eIF2a, Nrf2, and HO-1 determination by Western blot analysis. (E) Cell viability was measured using CCK-8 assay in control cells and cells treated with tagitinin C (20 µM) with/without GSK2606414 (5 µM). (F) HCT116 cells were treated with 20 µM tagitinin C and/or GSK2606414 for 8 h, the cells were collected and used for Western blot analysis. (G) HCT116 cells were treated with tagitinin C (20 µM) with GSK2606414 for 6 h, the cells were collected and used for Nrf2 and HO-1 mRNA determination. (H) HCT116 cells were grown on coverslips and treated with tagitinin C. Tagitinin C-induced Nrf2 nuclear translocation was observed under confocal microscope by IF. Cells were stained with Nrf2 (red) and DAPI (blue) (magnification, ×100). Data were presented as Mean ± SD. Scale bar indicates 100 µm. Statistical analysis was carried out between tagitinin C-treated group and DMSO group: * p ≤ 0.05, ** p ≤ 0.01, *** p ≤ 0.001.
Figure 7
Figure 7
Combination of erastin and tagitinin C synergistically induces cell death. (A) Cell viability was measured using MTT assay in HCT116 cells treated with tagitinin C with or without erastin at 12, 24, 36 and 48 h. (B) The HCT116 cell morphology after treatment with concentration of tagitinin C (10 µM) and/or erastin (20 µM) at 0, 12, 24, 36, 48 h (magnification, ×10). (C) The contents of the cellular ROS. (D-F) The contents of the cellular lipid peroxidation (D), MDA (E), LIP (F) and GSH (G) in HCT116 cells at 12 h under tagitinin C (10 μM) and/or erastin (20 μM) were determined. (H) HCT116 cells were treated with tagitinin C (10 µM) and/or erastin (20 μM) for 12 h, the cells were collected and used for Western blot analysis. (I) HCT116 cells were treated with tagitinin C (10 µM) and/or erastin (20 µM) for 6 h, the cells were collected and mRNA level of Nrf2 and HO-1 were determination. Data were presented as Mean ± SD. Scale bar indicates 40 µm. Statistical analysis was carried out between tagitinin C-treated group and DMSO group: * p ≤ 0.05, ** p ≤ 0.01, *** p ≤ 0.001.
Figure 8
Figure 8
A proposed model showing that tagitinin C induces ferroptosis in HCT116 cells.

References

    1. Brody H, Grayson M, Miller K, Bender E, Haines N. Colorectal cancer. Nature. 2015;521:S1. - PubMed
    1. Weitz J, Koch M, Debus J, Höhler T, Galle PR, Büchler MW. Colorectal cancer. Lancet. 2005;365:153–165. - PubMed
    1. Ganesh K, Stadler ZK, Cercek A, Mendelsohn RB, Shia J, Segal NH, Diaz LA Jr. Immunotherapy in colorectal cancer: rationale, challenges and potential. Nature Reviews Gastroenterology & Hepatology. 2019;16:361–375. - PMC - PubMed
    1. Kopetz S. New therapies and insights into the changing landscape of colorectal cancer. Nature Reviews Gastroenterology & Hepatology. 2019;16:79–80. - PubMed
    1. Dixon SJ, Lemberg KM, Lamprecht MR, Skouta R, Zaitsev EM, Gleason CE. et al. Ferroptosis: An iron-dependent form of nonapoptotic cell death. Cell. 2012;149:1060–1072. - PMC - PubMed

Publication types

MeSH terms