

Multi-endpoint analysis of human 3D airway epithelium following repeated exposure to whole electronic vapor product aerosol or cigarette smoke
- PMID: 34345855
- PMCID: PMC8320624
- DOI: 10.1016/j.crtox.2021.02.004
Multi-endpoint analysis of human 3D airway epithelium following repeated exposure to whole electronic vapor product aerosol or cigarette smoke
Abstract
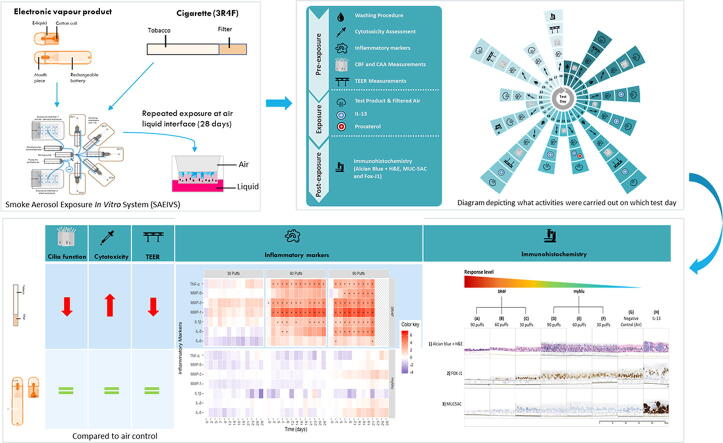
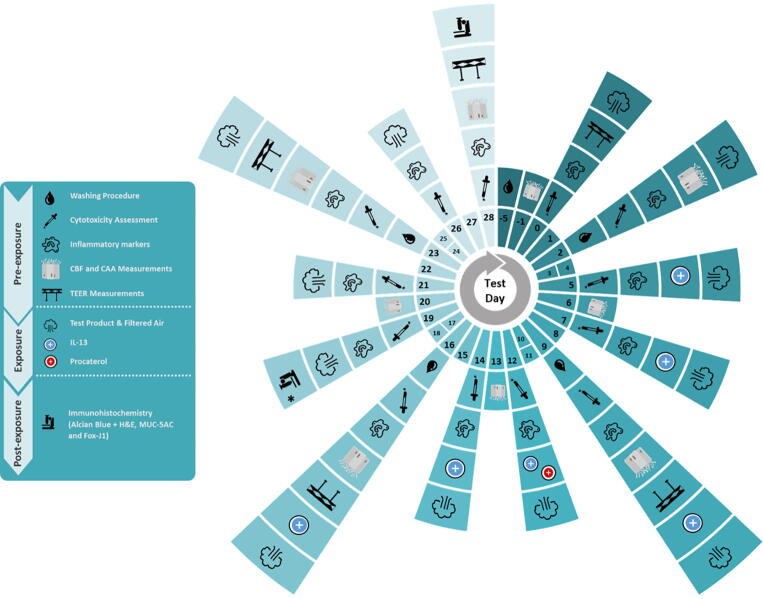
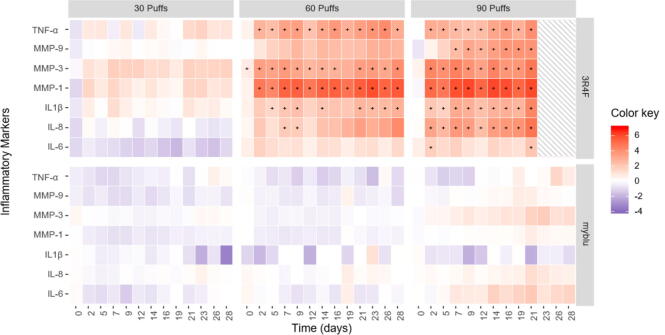
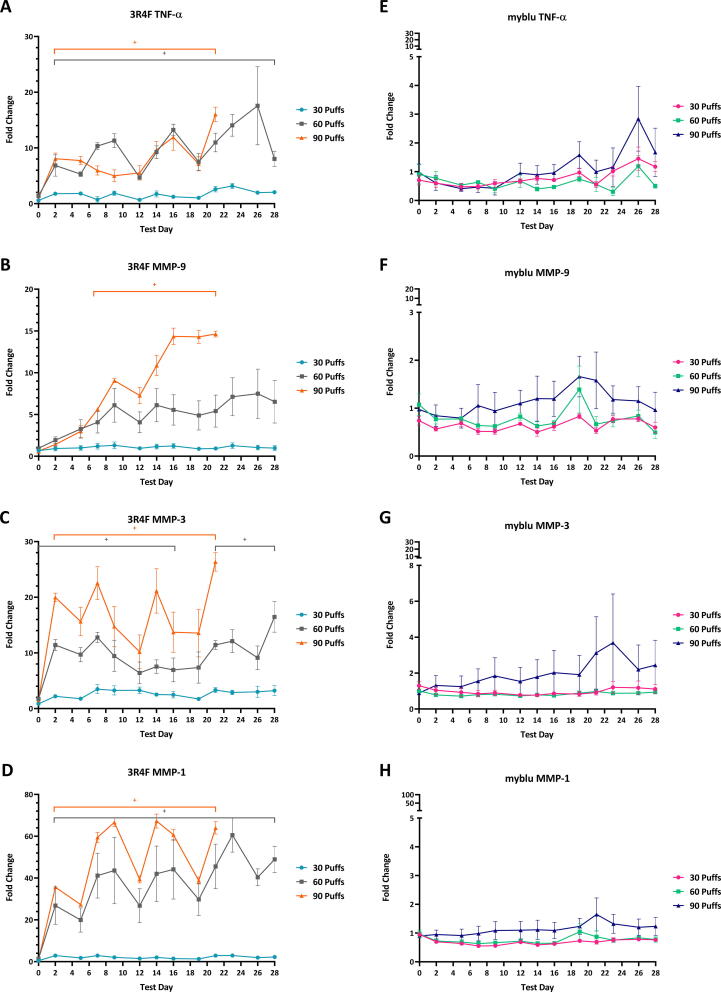
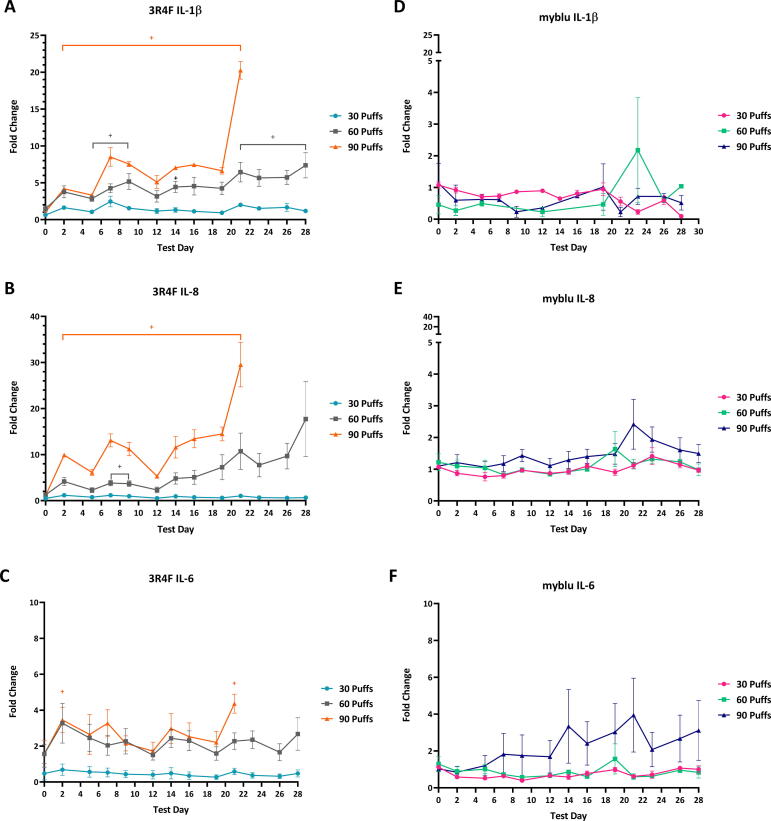
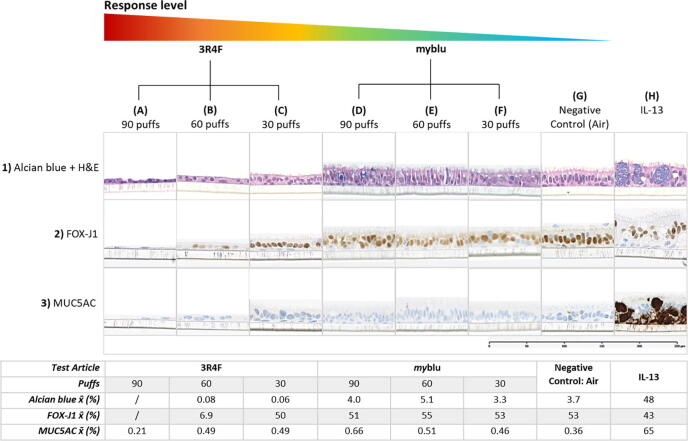
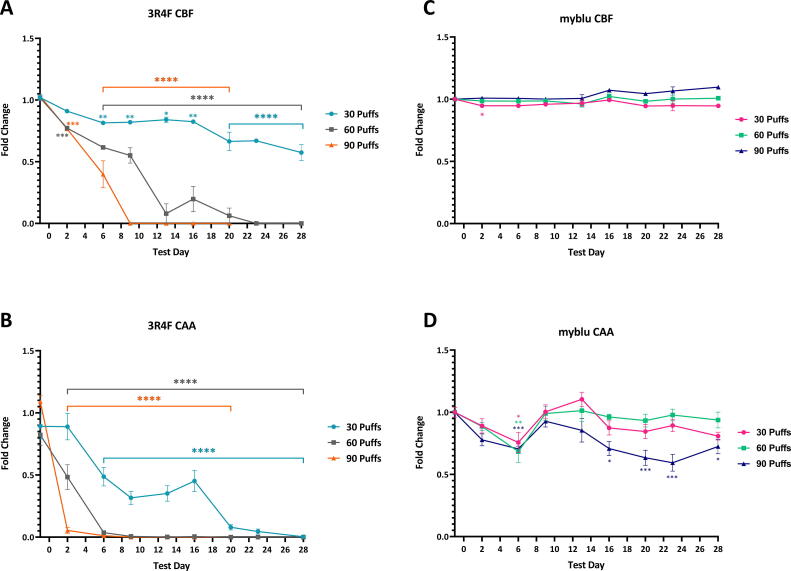
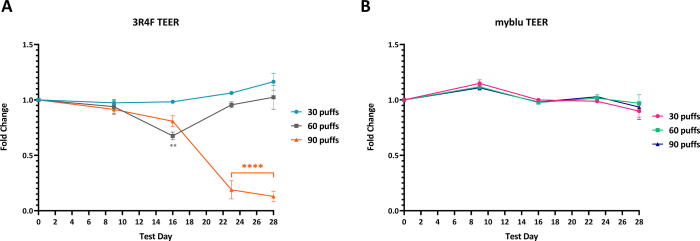
Smoking is a cause of serious diseases in smokers including chronic respiratory diseases. This study aimed to evaluate the tobacco harm reduction (THR) potential of an electronic vapor product (EVP, myblu™) compared to a Kentucky Reference Cigarette (3R4F), and assessed endpoints related to chronic respiratory diseases. Endpoints included: cytotoxicity, barrier integrity (TEER), cilia function, immunohistochemistry, and pro-inflammatory markers. In order to more closely represent the user exposure scenario, we have employed the in vitro 3D organotypic model of human airway epithelium (MucilAir™, Epithelix) for respiratory assessment. The model was repeatedly exposed to either whole aerosol of the EVP, or whole 3R4F smoke, at the air liquid interface (ALI), for 4 weeks to either 30, 60 or 90 puffs on 3-exposure-per-week basis. 3R4F smoke generation used the ISO 20778:2018 regime and EVP aerosol used the ISO 20768:2018 vaping regime. Exposure to undiluted whole EVP aerosol did not trigger any significant changes in the level of pro-inflammatory mediators, cilia beating function, barrier integrity and cytotoxicity when compared with air controls. In contrast, exposure to diluted (1:17) whole cigarette smoke caused significant changes to all the endpoints mentioned above. To our knowledge, this is the first study evaluating the effects of repeated whole cigarette smoke and whole EVP aerosol exposure to a 3D lung model at the ALI. Our results add to the growing body of scientific literature supporting the THR potential of EVPs relative to combustible cigarettes and the applicability of the 3D lung models in human-relevant product risk assessments.
Keywords: 2D, Two Dimensional; 3D, Three Dimensional; 3R4F, Scientific Reference Tobacco Cigarette (University of Kentucky); ALI, Air-Liquid Interface; ANOVA, Analysis of Variance; AOP, Adverse Outcome Pathway; CAA, Cilia Active Area; CBF, Cilia Beat Frequency; COPD, Chronic Obstructive Pulmonary Disease; CYP450, Cytochrome P450; Cigarette; Cilia; DPBS, Dulbecco's phosphate-buffered saline containing Ca2+ and Mg2+; EGFR, Epidermal Growth Factor Receptor; EVP, Electronic Vapor Product; Electronic vapor product; FOX-J1, Forkhead Box J1 protein; H&E, Hematoxylin and Eosin; IIVS, Institute for In Vitro Sciences; IL-13, Interleukin 13; IL-1β, Interleukin 1 Beta; IL-6, Interleukin-6; IL-8, Interleukin-8; ISO, International Organization for Standardization; Immunohistochemistry; KERs, Key Event Relationships; KEs, Key Events; LDH, Lactate Dehydrogenase; MIE, Molecular Initiating Event; MMP-1, Matrix Metalloproteinase-1; MMP-3, Matrix Metalloproteinase-3; MMP-9, Matrix Metalloproteinase-9; MUC5AC, Mucin 5AC Protein; MWP, Multi-Well Plate; NKT, Natural Killer T Cells; Organotypic tissue model; PBS, Phosphate Buffered Saline; PMN, polymorphonuclear; Pro-inflammatory markers; SAEIVS, Smoke Aerosol Exposure In Vitro System; TEER, Transepithelial Electrical Resistance; THR, Tobacco Harm Reduction; TNF-α, Tumor Necrosis Factor Alpha; TPM, Total Particulate Matter.
© 2021 The Authors.
Conflict of interest statement
The authors declare the following financial interests/personal relationships which may be considered as potential competing interests: All authors were employees of Imperial Brands PLC or subsidiaries at the time of this study. Imperial Brands PLC is the sole source of funding and sponsor of this project. Fontem Ventures B.V., the manufacturer of the EVP used in this study, is a wholly owned subsidiary of Imperial Brands PLC.
Figures
Similar articles
-
Twenty-eight day repeated exposure of human 3D bronchial epithelial model to heated tobacco aerosols indicates decreased toxicological responses compared to cigarette smoke.Front Toxicol. 2023 Feb 16;5:1076752. doi: 10.3389/ftox.2023.1076752. eCollection 2023. Front Toxicol. 2023. PMID: 36875887 Free PMC article.
-
The development of an in vitro 3D model of goblet cell hyperplasia using MUC5AC expression and repeated whole aerosol exposures.Toxicol Lett. 2021 Sep 1;347:45-57. doi: 10.1016/j.toxlet.2021.04.012. Epub 2021 Apr 21. Toxicol Lett. 2021. PMID: 33892128
-
Use of a rapid human primary cell-based disease screening model, to compare next generation products to combustible cigarettes.Curr Res Toxicol. 2021 Aug 17;2:309-321. doi: 10.1016/j.crtox.2021.08.003. eCollection 2021. Curr Res Toxicol. 2021. PMID: 34485931 Free PMC article.
-
Health effects and known pathology associated with the use of E-cigarettes.Toxicol Rep. 2022 Jun 16;9:1357-1368. doi: 10.1016/j.toxrep.2022.06.006. eCollection 2022. Toxicol Rep. 2022. PMID: 36561957 Free PMC article. Review.
-
A review of in vitro cigarette smoke exposure systems.Exp Toxicol Pathol. 2013 Nov;65(7-8):1183-93. doi: 10.1016/j.etp.2013.06.001. Epub 2013 Jul 11. Exp Toxicol Pathol. 2013. PMID: 23850067 Review.
Cited by
-
A Novel Bionebulizer Approach to Study the Effects of Natural Mineral Water on a 3D In Vitro Nasal Model from Allergic Rhinitis Patients.Biomedicines. 2024 Feb 9;12(2):408. doi: 10.3390/biomedicines12020408. Biomedicines. 2024. PMID: 38398010 Free PMC article.
-
Applying new approach methodologies to assess next-generation tobacco and nicotine products.Front Toxicol. 2024 Jun 13;6:1376118. doi: 10.3389/ftox.2024.1376118. eCollection 2024. Front Toxicol. 2024. PMID: 38938663 Free PMC article. Review.
-
In Vitro Ciliotoxicity and Cytotoxicity Testing of Repeated Chronic Exposure to Topical Nasal Formulations for Safety Studies.Pharmaceutics. 2021 Oct 20;13(11):1750. doi: 10.3390/pharmaceutics13111750. Pharmaceutics. 2021. PMID: 34834166 Free PMC article.
-
An in vitro toxicological assessment of two electronic cigarettes: E-liquid to aerosolisation.Curr Res Toxicol. 2024 Jan 12;6:100150. doi: 10.1016/j.crtox.2024.100150. eCollection 2024. Curr Res Toxicol. 2024. PMID: 38298371 Free PMC article.
-
Twenty-eight day repeated exposure of human 3D bronchial epithelial model to heated tobacco aerosols indicates decreased toxicological responses compared to cigarette smoke.Front Toxicol. 2023 Feb 16;5:1076752. doi: 10.3389/ftox.2023.1076752. eCollection 2023. Front Toxicol. 2023. PMID: 36875887 Free PMC article.
References
-
- Aghapour M. Airway epithelial barrier dysfunction in chronic obstructive pulmonary disease: role of cigarette smoke exposure. Am. J. Respir. Cell. Mol. Biol. 2018;58(2):157–169. - PubMed
-
- Balharry D., Sexton K., BéruBé K.A. An in vitro approach to assess the toxicity of inhaled tobacco smoke components: Nicotine, cadmium, formaldehyde and urethane. Toxicology. 2008;244(1):66–76. - PubMed
-
- Banerjee A. Differential gene expression using RNA sequencing profiling in a reconstituted airway epithelium exposed to conventional cigarette smoke or electronic cigarette aerosols. Appl. In Vitro Toxicol. 2017;3(1):84–98.
-
- Barnes P.J. The cytokine network in chronic obstructive pulmonary disease. Am. J. Respirat. Cell Mol. Biol. 2009;41(6):631–638. - PubMed
LinkOut - more resources
Full Text Sources
Research Materials
Miscellaneous
