

Ciliary chemosensitivity is enhanced by cilium geometry and motility
- PMID: 34346311
- PMCID: PMC8387018
- DOI: 10.7554/eLife.66322
Ciliary chemosensitivity is enhanced by cilium geometry and motility
Abstract
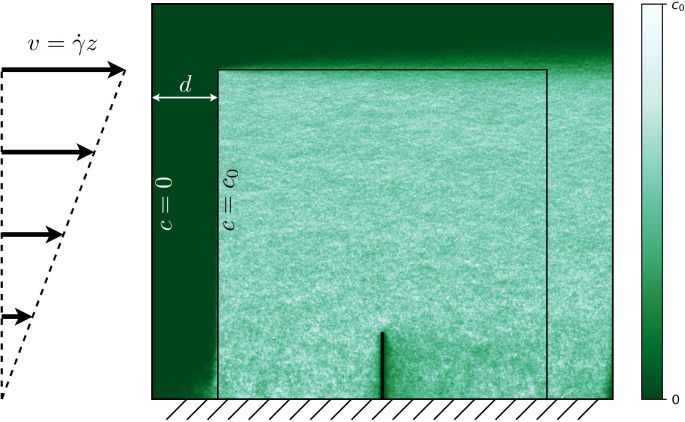
Cilia are hairlike organelles involved in both sensory functions and motility. We discuss the question of whether the location of chemical receptors on cilia provides an advantage in terms of sensitivity and whether motile sensory cilia have a further advantage. Using a simple advection-diffusion model, we compute the capture rates of diffusive molecules on a cilium. Because of its geometry, a non-motile cilium in a quiescent fluid has a capture rate equivalent to a circular absorbing region with ∼4× its surface area. When the cilium is exposed to an external shear flow, the equivalent surface area increases to ∼6×. Alternatively, if the cilium beats in a non-reciprocal way in an otherwise quiescent fluid, its capture rate increases with the beating frequency to the power of 1/3. Altogether, our results show that the protruding geometry of a cilium could be one of the reasons why so many receptors are located on cilia. They also point to the advantage of combining motility with chemical reception.
Keywords: chemical receptors; cilia; none; olfaction; physics of living systems; receptor sensitivity.
© 2021, Hickey et al.
Conflict of interest statement
DH, AV, RG No competing interests declared
Figures


Similar articles
-
Live cell imaging of dynamic behaviors of motile cilia and primary cilium.Microscopy (Oxf). 2019 Apr 1;68(2):99-110. doi: 10.1093/jmicro/dfy147. Microscopy (Oxf). 2019. PMID: 30715429 Review.
-
Survey of the Ciliary Motility Machinery of Drosophila Sperm and Ciliated Mechanosensory Neurons Reveals Unexpected Cell-Type Specific Variations: A Model for Motile Ciliopathies.Front Genet. 2019 Feb 1;10:24. doi: 10.3389/fgene.2019.00024. eCollection 2019. Front Genet. 2019. PMID: 30774648 Free PMC article.
-
Primary cilium mechanotransduction of tensile strain in 3D culture: Finite element analyses of strain amplification caused by tensile strain applied to a primary cilium embedded in a collagen matrix.J Biomech. 2014 Jun 27;47(9):2211-7. doi: 10.1016/j.jbiomech.2014.04.004. Epub 2014 Apr 24. J Biomech. 2014. PMID: 24831236 Free PMC article.
-
An integrative computational model of multiciliary beating.Bull Math Biol. 2008 May;70(4):1192-215. doi: 10.1007/s11538-008-9296-3. Epub 2008 Jan 31. Bull Math Biol. 2008. PMID: 18236120
-
Cilia multifunctional organelles at the center of vertebrate left-right asymmetry.Curr Top Dev Biol. 2008;85:151-74. doi: 10.1016/S0070-2153(08)00806-5. Curr Top Dev Biol. 2008. PMID: 19147005 Review.
Cited by
-
Regulation of the length of neuronal primary cilia and its potential effects on signalling.Trends Cell Biol. 2023 Nov;33(11):979-990. doi: 10.1016/j.tcb.2023.05.005. Epub 2023 Jun 10. Trends Cell Biol. 2023. PMID: 37302961 Free PMC article. Review.
-
Paracrine Signaling by Pancreatic Islet Cilia.Curr Opin Endocr Metab Res. 2024 Jun;35:100505. doi: 10.1016/j.coemr.2024.100505. Epub 2024 Feb 20. Curr Opin Endocr Metab Res. 2024. PMID: 38524256 Free PMC article.
-
GPRC5C regulates the composition of cilia in the olfactory system.BMC Biol. 2023 Dec 18;21(1):292. doi: 10.1186/s12915-023-01790-0. BMC Biol. 2023. PMID: 38110903 Free PMC article.
-
Theoretical efficiency limits and speed-efficiency trade-off in myosin motors.PLoS Comput Biol. 2023 Jul 21;19(7):e1011310. doi: 10.1371/journal.pcbi.1011310. eCollection 2023 Jul. PLoS Comput Biol. 2023. PMID: 37478158 Free PMC article.
-
Nonreciprocal interactions give rise to fast cilium synchronization in finite systems.Proc Natl Acad Sci U S A. 2023 Oct 3;120(40):e2307279120. doi: 10.1073/pnas.2307279120. Epub 2023 Sep 27. Proc Natl Acad Sci U S A. 2023. PMID: 37756336 Free PMC article.
References
-
- Adam G, Delbruck M. Reduction of dimensionality in biological diffusion processes. In: Rich A, Davidson N, editors. Structural Chemistry and Molecular Biology. San Francisco: W.H. Freeman; 1968. pp. 198–215.
Publication types
MeSH terms
Substances
LinkOut - more resources
Full Text Sources
