. 2021 Sep 3;9(1):e0034121.
doi: 10.1128/Spectrum.00341-21. Epub 2021 Aug 4.

Differential Antibody Response to mRNA COVID-19 Vaccines in Healthy Subjects

Affiliations

Differential Antibody Response to mRNA COVID-19 Vaccines in Healthy Subjects

Sarah E Wheeler et al. Microbiol Spectr. .

Abstract

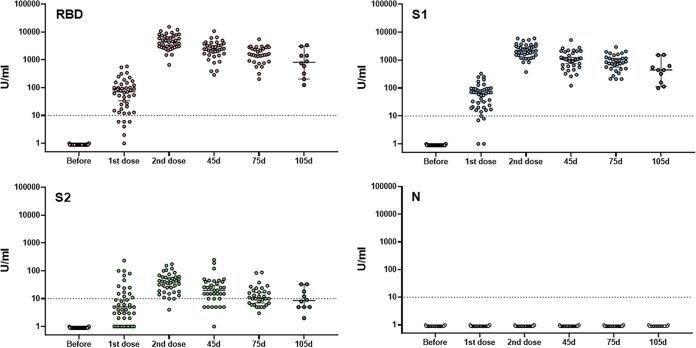
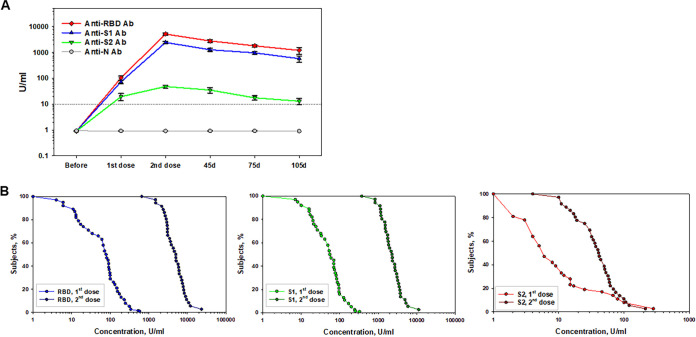
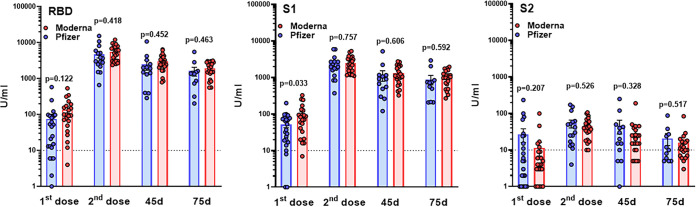
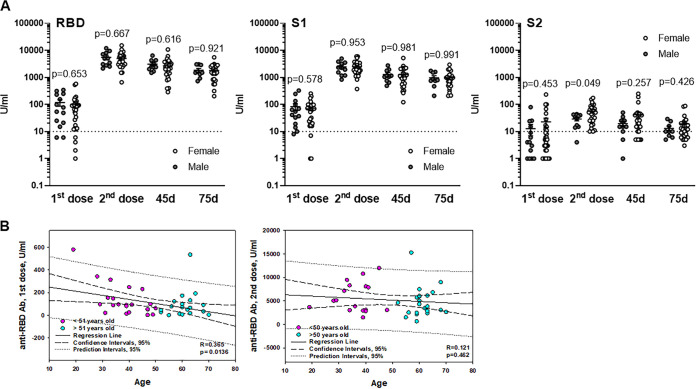
Knowledge about development and duration of virus-specific antibodies after COVID-19 vaccination is important for understanding how to limit the pandemic via vaccination in different populations and societies. However, the clinical utility of postvaccination testing of antibody response and selection of targeted SARS-CoV-2 antigen(s) has not been established. The results of such testing from clinical teams independent from vaccine manufacturers are also limited. Here, we report the initial results of an ongoing clinical study on evaluation of antibody response to four different SARS-CoV-2 antigens after first and second dose of Pfizer and Moderna mRNA vaccines and at later time points. We revealed a peak of antibody induction after the vaccine boosting dose with a gradual decline of antibody levels at later time. Anti-nucleocapsid antibody was not induced by spike protein-encoding vaccines and this may continue to serve as a marker of previous SARS-CoV-2 infection. No differences between the two vaccines in terms of antibody response were revealed. Age and gender dependencies were determined to be minimal within the healthy adult (but not aged) population. Our results suggest that postvaccination testing of antibody response is an important and feasible tool for following people after vaccination and selecting individuals who might require a third dose of vaccine at an earlier time point or persons who may not need a second dose due to previous SARS-CoV-2 infection. IMPORTANCE Now that authorized vaccines for COVID-19 have been widely used, it is important to understand how they induce antivirus antibodies, which antigens are targeted, how long antibodies circulate, and how personal health conditions and age may affect this humoral immunity. Here, we report induction and time course of multiple anti-SARS-CoV-2 antibody responses in healthy individuals immunized with Pfizer and Moderna mRNA vaccines. We also determined the age and gender dependence of the antibody response and compared antibody levels to responses seen in those who have recovered from COVID-19. Our results suggest the importance of screening for antibody response to multiple antigens after vaccination in order to reveal individuals who require early and late additional boosting and those who may not need second dose due to prior SARS-CoV-2 infection.

Keywords: COVID-19; SARS-CoV-2; antibody; humoral immunity; vaccination.


Figures

FIG 1
FIG 1
Individual antibody responses to two doses of mRNA vaccines. Blood specimens were collected from healthy individuals before and after the first and second doses of the Pfizer or Moderna vaccines and then every month. IgG antibodies binding to RBD, S1, S2, and nucleocapsid SARS-CoV-2 structural proteins were screened and differentiated by the BioPlex 2200 SARS-CoV-2 IgG multiplex panel as described in Materials and Methods. Each time point represents individual values with the mean and SEM. 10 U/ml is the negative cutoff concentration.
FIG 2
FIG 2
Time-course of antibody response to vaccination with mRNA vaccines. Antibody responses to two doses of Pfizer and Moderna vaccination were assessed for RBD, S1, S2, and nucleocapsid. (A) Summation of two-dose vaccine-induced antibody development to different SARS-CoV-2 antigens in healthy volunteers. The x axis shows time points before and after two doses of vaccine administration and 45 and 75 days after a completed vaccination; the y axis shows the logarithmic antibody concentrations shown as means ± the SEM. Significant differences with corresponding P values for each antigen are presented in the text. 10 U/ml is the negative cutoff concentration. (B) RCDCs of antibody response in healthy volunteers postvaccination for each of the three antigens. The x axis represents the antibody concentration values in log scale; the y axis is the proportion of subjects having at least that antibody level. The curve begins at 100% and then descends from left to right. When the RCD curves overlap, the two doses of vaccines induced comparable immune responses. If one curve is above another one, it indicates the higher immune response.
FIG 3
FIG 3
Comparative analysis of antibody response to two mRNA vaccines. Antibody responses to two doses of Pfizer and Moderna vaccination of healthy volunteers were assessed by the BioPlex 2200 SARS-CoV-2 IgG multiplex panel. Results represent individual values (dots) and means ± the SEM (bars) for IgG antibodies recognizing RBD, S1, and S2 SARS-CoV-2 antigens. P values were determined using an unpaired t test. 10 U/ml (dotted line) is the negative cutoff concentration.
FIG 4
FIG 4
Gender and age differences in antibody responses to mRNA vaccination. Antibody responses to two doses of Pfizer and Moderna vaccinations of healthy volunteers were assessed by the BioPlex 2200 SARS-CoV-2 IgG multiplex assay. (A) Results represent individual values (dots) and means ± the SEM of IgG antibodies recognizing RBD, S1, and S2 SARS-CoV-2 antigens in males and females 2 weeks after the first and second doses and 45 and 75 days after the second shot. The y axis represents antibody levels in U/ml in logarithmic scale. P values were calculated using an unpaired t test. (B) Pearson correlation analysis of antibody responses versus age of healthy volunteers. Two age cohorts separated based on the median age (50) are shown for clarity. Induction of anti-RBD antibody after first (left panel) and second (right panel) doses of a vaccine are shown in the y axis. Regression lines and correlation coefficients with the corresponding P values are shown. CIs (95%) and prediction intervals (95%) are also indicated.
FIG 5
FIG 5
Serum anti-SARS-CoV-2 antibody levels in COVID-19 recovered individuals. Antibody levels were assessed by using the BioPlex 2200 SARS-CoV-2 IgG multiplex panel (A) and the EuroImmun IgG ELISA (B) in 59 COVID-19-recovered persons 3 to 8 months after disease. Antibody levels are expressed in U/ml in logarithmic scale (A) and index values (B), as described in Materials and Methods. 10 U/ml (dotted line) is the negative cutoff concentration for panel A. A, index value of 1 (dotted line) is the negative cutoff concentration for panel B. Results from a representative cohort of patients are shown.
FIG 6
FIG 6
Vignettes to compare healthy to previously infected volunteers. Examples of anti-SARS-CoV-2 antibody levels in a vaccinated healthy volunteer (A and B), a mild COVID-19 recovered person (C and D), and a previously SARS-CoV-2-infected individual receiving a two-dose mRNA vaccine (E and F) are shown. Antibody levels were assessed by using a BioPlex 2200 SARS-CoV-2 IgG multiplex panel. Results are expressed as antibody levels in U/ml (y axis) in the linear (B, D, and F) and logarithmic (A, C, and E) scales for comparison. The x axis indicates time points before, 2 weeks after the first and second vaccine doses, and 45, 75, and 105 days after the second shot (A, B, E, and F) or days after natural disease (C and D). 10 U/ml (dotted line) is the negative cutoff concentration.
FIG 7
FIG 7
Anti-SARS-CoV-2 antibody levels in a vaccinated healthy volunteer with a delayed boosting vaccination. Antibody levels were assessed by using the Siemens SARS-CoV-2 total assay (A) and the BioPlex 2200 SARS-CoV-2 IgG multiplex panel (B). The results are shown with linear (lower panels) and logarithmic (upper panels) scales (y axis) in index values (A) and U/ml (B). The x axis indicates the days after the first dose of a vaccine administration. An index unit of 1 (dotted line) is the negative cutoff concentration for panel A. 10 U/ml (dotted line) is the negative cutoff concentration for panel B.

Similar articles

Cited by

References

    1. Dan JM, Mateus J, Kato Y, Hastie KM, Yu ED, Faliti CE, Grifoni A, Ramirez SI, Haupt S, Frazier A, Nakao C, Rayaprolu V, Rawlings SA, Peters B, Krammer F, Simon V, Saphire EO, Smith DM, Weiskopf D, Sette A, Crotty S. 2021. Immunological memory to SARS-CoV-2 assessed for up to 8 months after infection. Science 371:eabf4063. doi:10.1126/science.abf4063. - DOI - PMC - PubMed
    1. Shurin MR, Morris A, Wells A, Wheeler SE. 2020. Assessing immune response to SARS-CoV-2 infection. Immunotargets Ther 9:111–114. doi:10.2147/ITT.S264138. - DOI - PMC - PubMed
    1. Food and Drug Administration. 2020. Pfizer COVID-19 vaccine emergency use authorization. U.S. Food and Drug Administration, Silver Spring, MD.
    1. Food and Drug Administration. 2020. Moderna COVID-19 vaccine emergency use authorization. U.S. Food and Drug Administration, Silver Spring, MD.
    1. Barnes CO, Jette CA, Abernathy ME, Dam KA, Esswein SR, Gristick HB, Malyutin AG, Sharaf NG, Huey-Tubman KE, Lee YE, Robbiani DF, Nussenzweig MC, West AP, Jr, Bjorkman PJ. 2020. SARS-CoV-2 neutralizing antibody structures inform therapeutic strategies. Nature 588:682–687. doi:10.1038/s41586-020-2852-1. - DOI - PMC - PubMed

MeSH terms