

Google Trends correlation and sensitivity for outbreaks of dengue and yellow fever in the state of São Paulo
- PMID: 34346987
- PMCID: PMC8302225
- DOI: 10.31744/einstein_journal/2021AO5969
Google Trends correlation and sensitivity for outbreaks of dengue and yellow fever in the state of São Paulo
Abstract
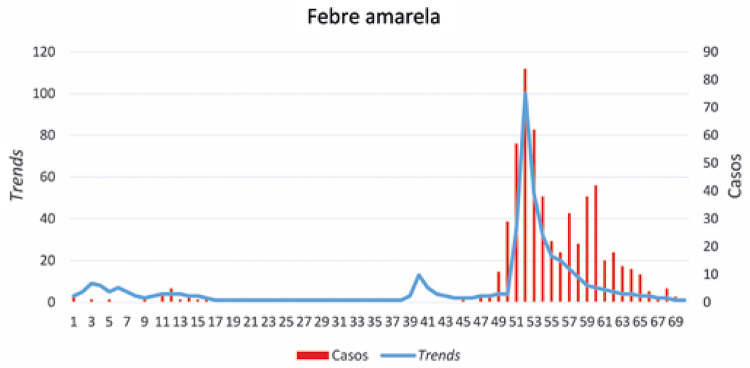
Objective: To assess Google Trends accuracy for epidemiological surveillance of dengue and yellow fever, and to compare the incidence of these diseases with the popularity of its terms in the state of São Paulo.
Methods: Retrospective cohort. Google Trends survey results were compared to the actual incidence of diseases, obtained from Centro de Vigilância Epidemiológica "Prof. Alexandre Vranjac", in São Paulo, Brazil, in periods between 2017 and 2019. The correlation was calculated by Pearson's coefficient and cross-correlation function. The accuracy was analyzed by sensitivity and specificity values.
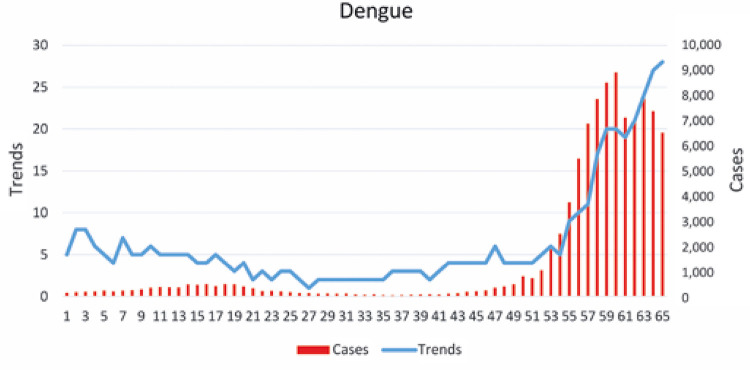
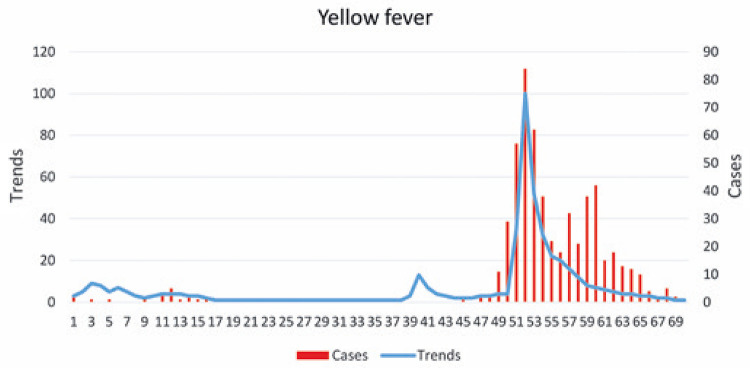
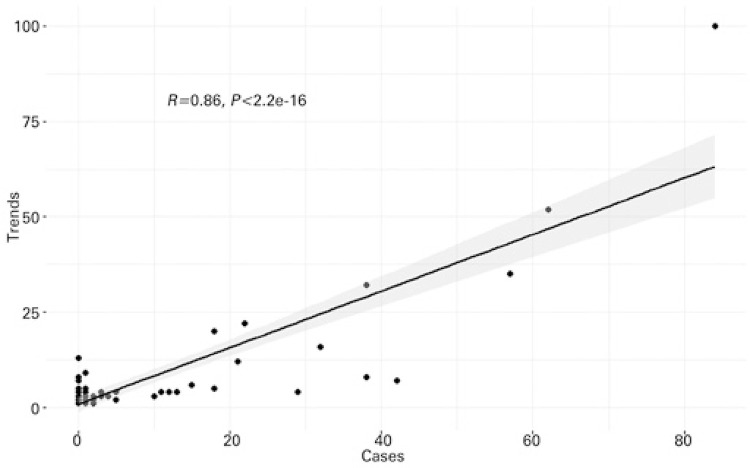
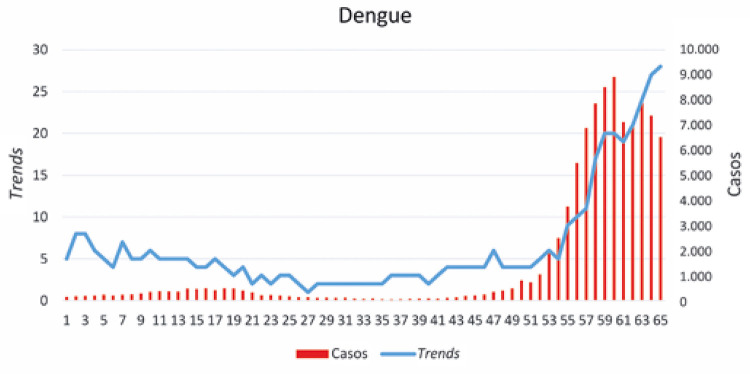
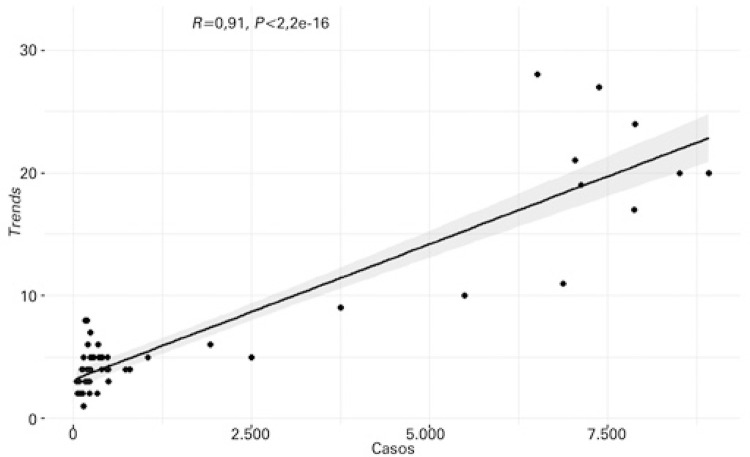
Results: There was a statistically significant correlation between the variables studied for both diseases, Pearson coefficient of 0.91 for dengue and 0.86 for yellow fever. Correlation with up to 4 weeks of anticipation for time series was identified. Sensitivity was 87% and 90%, and specificity 69% and 78% for dengue and yellow fever, respectively.
Conclusion: The incidence of dengue and yellow fever in the State of São Paulo showed a strong correlation with the popularity of its terms measured by Google Trends in weekly periods. Google Trends tool provided early warning, with high sensitivity, for the detection of outbreaks of these diseases.
Objetivo: Avaliar a acurácia do Google Trends para vigilância epidemiológica de dengue e febre amarela e comparar a incidência dessas doenças com a popularidade de seus termos no estado de São Paulo.
Métodos: Coorte retrospectiva. Os resultados da pesquisa Google Trends foram comparados com a incidência real de doenças, obtida do Centro de Vigilância Epidemiológica “Prof. Alexandre Vranjac”, do estado de São Paulo, nos períodos entre 2017 e 2019. A correlação foi calculada pelo coeficiente de Pearson e pela função de correlação cruzada. A acurácia foi analisada por valores de sensibilidade e especificidade.
Resultados: Houve correlação estatisticamente significante entre as variáveis estudadas para ambas as doenças, com coeficiente de Pearson de 0,91 para dengue e 0,86 para febre amarela. Foi identificada correlação com até 4 semanas de antecipação para séries temporais. A sensibilidade foi de 87% e 90% e a especificidade de 69% e 78% para dengue e febre amarela, respectivamente.
Conclusão: A incidência de dengue e febre amarela no estado de São Paulo apresentou forte correlação com a popularidade de seus termos medidos pelo Google Trends em períodos semanais. A ferramenta Google Trends forneceu alerta precoce, com alta sensibilidade, para a detecção de surtos dessas doenças.
Conflict of interest statement
Figures


Similar articles
-
Dengue and the risk of urban yellow fever reintroduction in São Paulo State, Brazil.Rev Saude Publica. 2003 Aug;37(4):477-84. doi: 10.1590/s0034-89102003000400013. Epub 2003 Aug 20. Rev Saude Publica. 2003. PMID: 12937709
-
The risk of yellow fever in a dengue-infested area.Trans R Soc Trop Med Hyg. 2001 Jul-Aug;95(4):370-4. doi: 10.1016/s0035-9203(01)90184-1. Trans R Soc Trop Med Hyg. 2001. PMID: 11579875
-
Yellow fever outbreaks in São Paulo State, Brazil, 2000-2010.Epidemiol Serv Saude. 2016 Jul-Sep;25(3):531-540. doi: 10.5123/S1679-49742016000300009. Epidemiol Serv Saude. 2016. PMID: 27869924 English, Portuguese.
-
[The risk of urban yellow fever outbreaks in Brazil by dengue vectors. Aedes aegypti and Aedes albopictus].Bull Soc Pathol Exot. 1996;89(2):107-13; discussion 114. Bull Soc Pathol Exot. 1996. PMID: 8924767 Review. French.
-
The Brazilian flaviviruses.Microbes Infect. 2000 Nov;2(13):1643-9. doi: 10.1016/s1286-4579(00)01320-4. Microbes Infect. 2000. PMID: 11113383 Review.
Cited by
-
What does Google Trends reveal about the proportion of waterpipe users in the Brazilian population?Epidemiol Serv Saude. 2023 Dec 18;32(4):e2023708. doi: 10.1590/S2237-96222023000400004.en. eCollection 2023. Epidemiol Serv Saude. 2023. PMID: 38126544 Free PMC article.
-
Pandemic and precocious puberty - a Google trends study.World J Methodol. 2023 Jan 20;13(1):1-9. doi: 10.5662/wjm.v13.i1.1. eCollection 2023 Jan 20. World J Methodol. 2023. PMID: 36684480 Free PMC article.
-
Use of Digital Tools in Arbovirus Surveillance: Scoping Review.J Med Internet Res. 2024 Nov 18;26:e57476. doi: 10.2196/57476. J Med Internet Res. 2024. PMID: 39556803 Free PMC article.
-
Trending ticks: using Google Trends data to understand tickborne disease prevention.Front Public Health. 2024 Jun 13;12:1410713. doi: 10.3389/fpubh.2024.1410713. eCollection 2024. Front Public Health. 2024. PMID: 38939559 Free PMC article.
-
COVID-19 and thyroid disease: An infodemiological pilot study.World J Methodol. 2022 May 20;12(3):99-106. doi: 10.5662/wjm.v12.i3.99. eCollection 2022 May 20. World J Methodol. 2022. PMID: 35721248 Free PMC article.
References
-
- 1. Boutayeb A. The double burden of communicable and non-communicable diseases in developing countries. Trans R Soc Trop Med Hyg. 2006;100(3):191-9. Review. - PubMed
- Boutayeb A. The double burden of communicable and non-communicable diseases in developing countries. Trans R Soc Trop Med Hyg. 2006;100(3):191–199. Review. - PubMed
-
- 2. Waldman EA, Sato AP. Path of infectious diseases in Brazil in the last 50 years: an ongoing challenge. Rev Saude Publica. 2016;22;50:68. Review. - PMC - PubMed
- Waldman EA, Sato AP. Path of infectious diseases in Brazil in the last 50 years: an ongoing challenge. 68Rev Saude Publica. 2016;22(50) Review. - PMC - PubMed
-
- 3. Ellwanger JH, Kaminski VL, Chies JA. Emerging infectious disease prevention: Where should we invest our resources and efforts? J Infect Public Health. 2019;12(3):313-6. Review. - PubMed
- Ellwanger JH, Kaminski VL, Chies JA. Emerging infectious disease prevention: Where should we invest our resources and efforts? J Infect Public Health. 2019;12(3):313–316. Review. - PubMed
-
- 5. Louis VR, Phalkey R, Horstick O, Ratanawong P, Wilder-Smith A, Tozan Y, et al. Modeling tools for dengue risk mapping - a systematic review. Int J Health Geogr. 2014;13:50. Review. - PMC - PubMed
- Louis VR, Phalkey R, Horstick O, Ratanawong P, Wilder-Smith A, Tozan Y, et al. Modeling tools for dengue risk mapping - a systematic review. 50Int J Health Geogr. 2014;13 Review. - PMC - PubMed
MeSH terms
LinkOut - more resources
Full Text Sources
Medical
