Multicenter Study
. 2021 Oct 4;218(10):e20210469.
doi: 10.1084/jem.20210469. Epub 2021 Aug 4.

Eosinophils are part of the granulocyte response in tuberculosis and promote host resistance in mice

Affiliations
Multicenter Study

Eosinophils are part of the granulocyte response in tuberculosis and promote host resistance in mice

Andrea C Bohrer et al. J Exp Med. .

Abstract

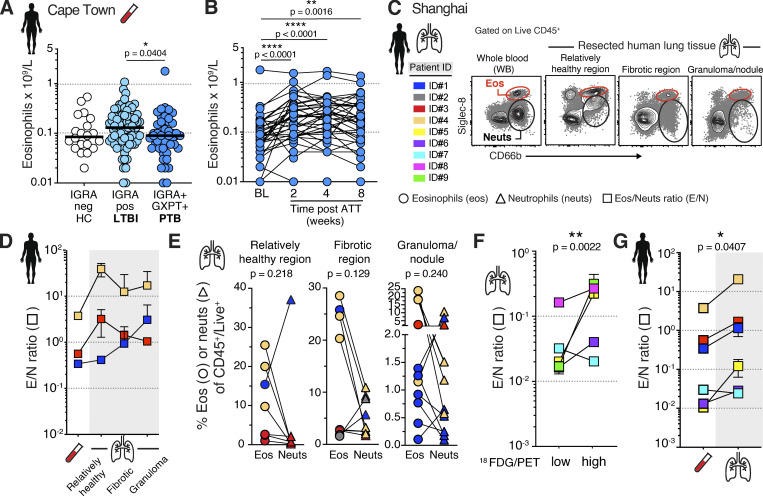
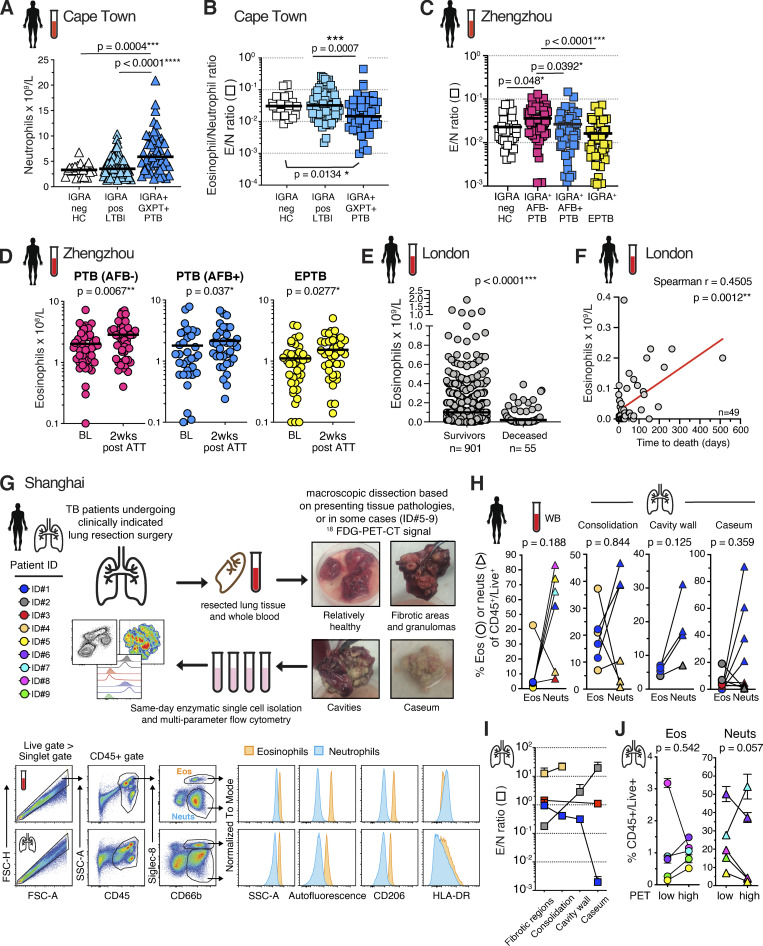
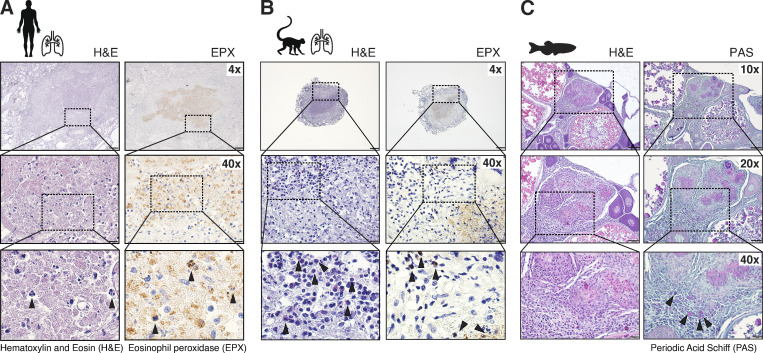
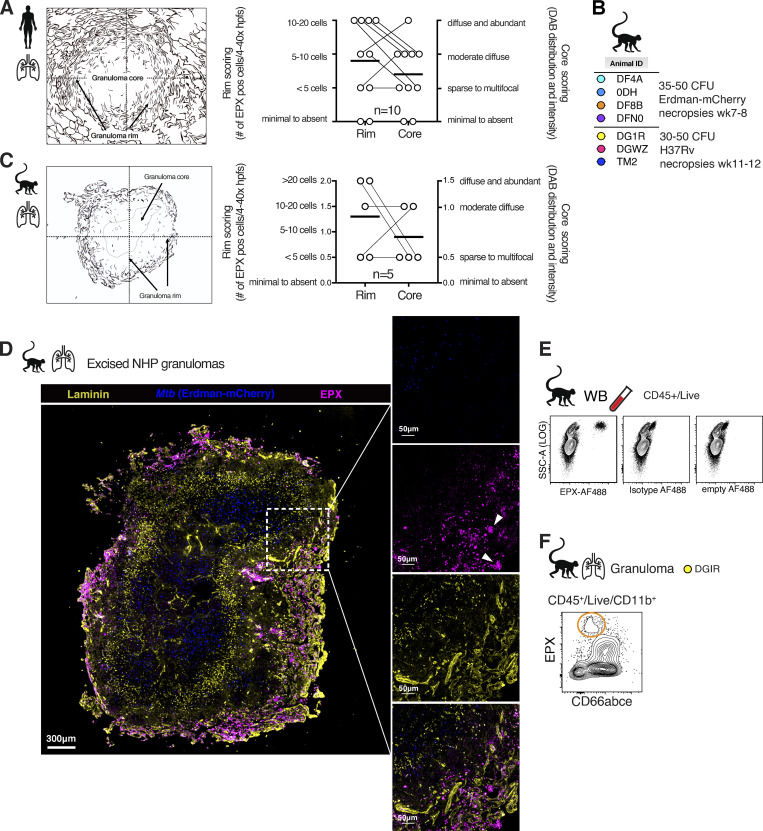
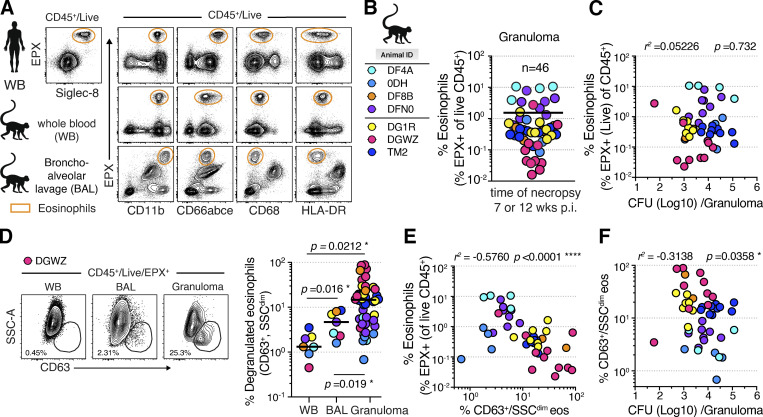
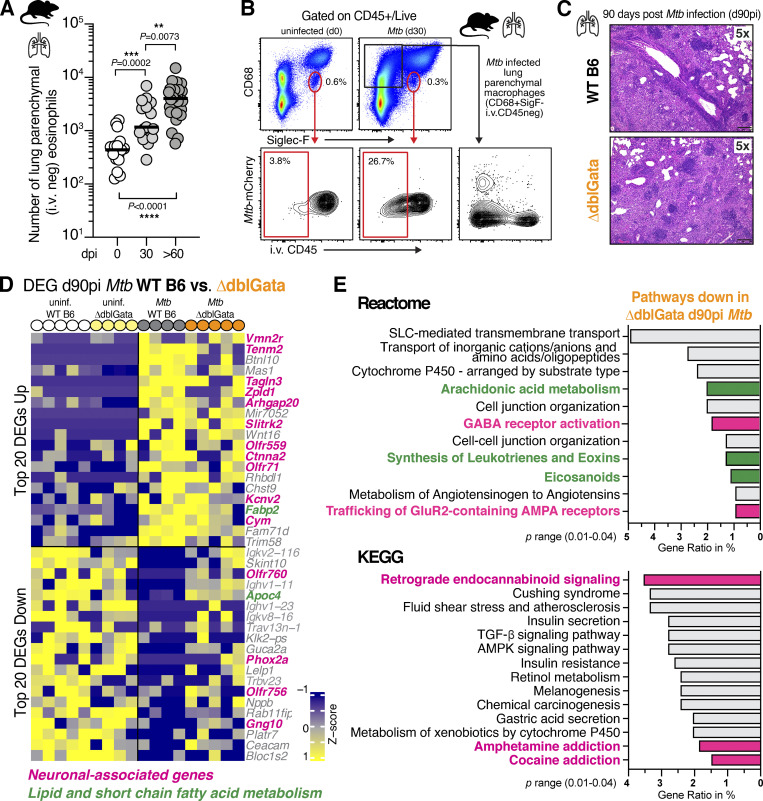
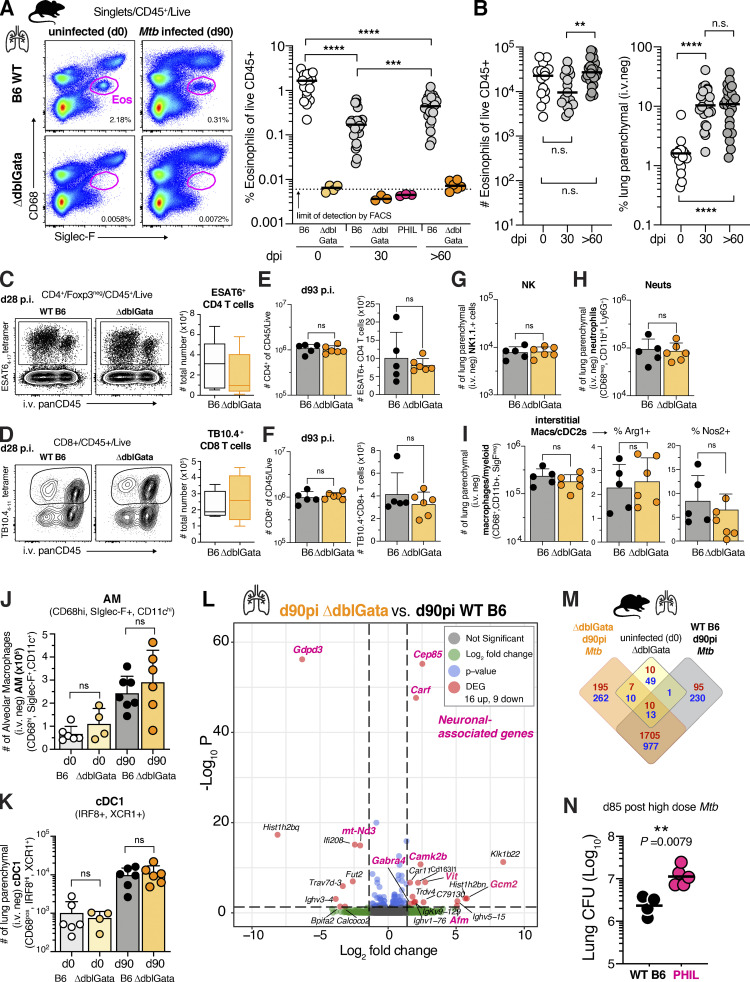
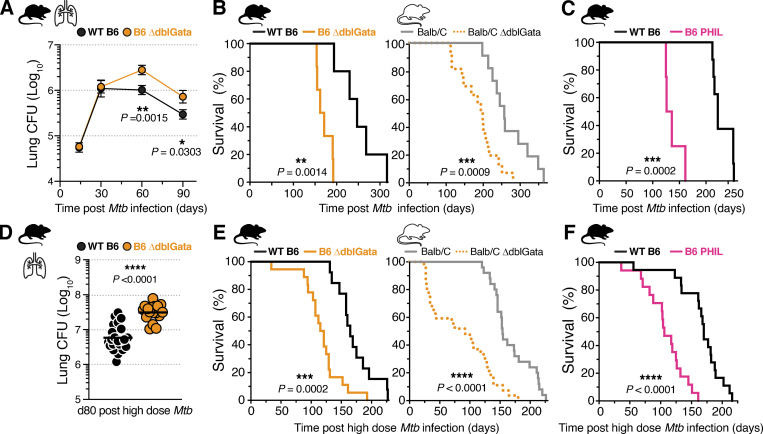
Host resistance to Mycobacterium tuberculosis (Mtb) infection requires the activities of multiple leukocyte subsets, yet the roles of the different innate effector cells during tuberculosis are incompletely understood. Here we uncover an unexpected association between eosinophils and Mtb infection. In humans, eosinophils are decreased in the blood but enriched in resected human tuberculosis lung lesions and autopsy granulomas. An influx of eosinophils is also evident in infected zebrafish, mice, and nonhuman primate granulomas, where they are functionally activated and degranulate. Importantly, using complementary genetic models of eosinophil deficiency, we demonstrate that in mice, eosinophils are required for optimal pulmonary bacterial control and host survival after Mtb infection. Collectively, our findings uncover an unexpected recruitment of eosinophils to the infected lung tissue and a protective role for these cells in the control of Mtb infection in mice.


Conflict of interest statement

Disclosures: D.M. Lowe reported personal fees from Merck, non-financial support from CSL Behring, and non-financial support from Fujifilm Chemical Co. outside the submitted work. No other disclosures were reported.

Figures

Figure 1.
Figure 1.
Eosinophils are decreased in circulation and enriched in human lung lesions during TB. (A) Cape Town cohort: Circulating eosinophil and neutrophil numbers in HC (n = 20), IGRA-positive individuals with LTBI (n = 77) and IGRA-positive and GXPT-positive PTB (n = 48; Kruskal–Wallis test with Dunn’s correction). (B) Cape Town cohort: Circulating eosinophil numbers at baseline (BL) and after ATT (n = 37; two-tailed Wilcoxon matched pairs test). (C) Shanghai cohort: Representative FACS plots (from participant ID#1) of granulocytes in WB and resected human TB lesions (n = 9; color coded). (D) Shanghai cohort: Summary E/N ratios in resected human lung lesions (connecting line according to color-coded patient ID; tissues are depicted as mean and SEM of n = 1–6 samples per tissue type and patient). (E) Shanghai cohort: Eosinophil and neutrophil proportions of CD45+ cells depicting individual samples per patient (connecting line according to color-coded patient ID, two-tailed Wilcoxon matched pairs test). (F) Shanghai cohort: E/N ratios in 18FDG PET/CT low- or high-signal intensity (SUVmax >5.0) lung lesions (connecting line according to color-coded patient ID, n = 5, two-tailed ratio paired t test). (G) Shanghai cohort: Summary E/N ratios in combined resected human lung lesions (n = 3–22) per patient (n = 6) compared with patients’ blood eosinophils (connecting line according to color-coded patient ID, two-tailed ratio paired t test).
Figure S1.
Figure S1.
Peripheral blood eosinophils in clinical cohorts and granulocyte isolation from human TB lung lesions. (A and B) Cape Town cohort: Circulating neutrophil numbers and E/N ratio in IGRA-negative HC (n = 20), IGRA-positive individuals with LTBI (n = 77), and GXPT-positive individuals with PTB (n = 49; Kruskal–Wallis test with Dunn’s correction). (C) Zhengzhou cohort: E/N ratio in HC (n = 30), AFB staining (sputum negative) in PTB (n = 64, pink), AFB+ staining (sputum positive) in PTB (n = 48, blue), and EPTB (n = 50, yellow; Kruskal–Wallis test with Dunn’s correction). (D) Zhengzhou cohort: Circulating eosinophil numbers at baseline (BL) and 2 wk after ATT (Wilcoxon matched pairs test) from color-coded clinical groups (pink: IGRA + AFB PTB, n = 47 pairs; blue: IGRA + AFB+ PTB, n = 34 pairs; yellow: EPTB, n = 30 pairs). (E) London cohort: Circulating eosinophil numbers in survivor (n = 901) or deceased (n = 55) TB patients (Mann–Whitney test). (F) London cohort: Circulating eosinophil numbers correlated with time to death (n = 49, Spearman correlation test). (G) Schematic study overview and examples of human lung TB lesions after resection surgery (n = 9) and flow cytometric gating strategy of human lung TB lesions for eosinophil and neutrophil quantification in Shanghai cohort. (H) Shanghai cohort: Eosinophil (circles) and neutrophil (triangles) proportions of CD45+ cells depicting individual samples per patient (connecting line according to color-coded patient ID, Wilcoxon matched pairs test, two tailed). (I) Shanghai cohort: Summary E/N in resected human lung lesions (connecting line according to color-coded patient ID; tissues depicted as mean and SEM of n = 1–6 samples per tissue type and patient). (J) Shanghai cohort: Eosinophil and neutrophil proportions of CD45+ cells in 18FDG PET/CT low- or high-signal intensity (SUVmax >5.0) lung lesions (connecting line according to color-coded patient ID, n = 5, two-tailed Wilcoxon matched pairs test). Eos, eosinophils; FSC, forward scatter; Neuts, neutrophils; SSC, side scatter.
Figure 2.
Figure 2.
The presence of eosinophils in mycobacterial granulomas is evolutionarily conserved. (A) Rome cohort: H&E and EPX immunostaining of paraffin-embedded human Mtb lung lesions; arrowheads indicate eosinophils. (B) H&E and EPX immunostaining of paraffin-embedded rhesus macaque Mtb granulomas; arrowheads indicate eosinophils. (C) Organized core of a multifocal granuloma in the ovary of an M. marinum–infected zebrafish; arrowheads indicate individual eosinophils stained by PAS in the rim of the granuloma. Scale bars = 200 μm (4×), 100 μm (10×), 50 μm (20×), and 20 μm (40×).
Figure S2.
Figure S2.
Human and NHP TB lesions assessed by H&E and EPX immunohistological and flow cytometric staining. (A) Rome cohort: Histological scoring of eosinophil distribution in human TB lesion on blinded specimens (n = 10). (B) Animal IDs and infection dose and strains for NHP Mtb infections (male and female, n = 7, two independent experiments). (C) Granuloma outline and legend for histological scoring of NHP granulomas on blinded specimens (n = 5). (D) EPX immunofluorescence staining on thin sections from paraffin-embedded granulomas after Erdman-mCherry (blue) Mtb infection. (E) Isotype and fluorescence minus one (empty) control of EPX–AF488 staining in NHP WB. (F) Example EPX FACS staining in granulomas from rhesus macaques. DAB, 3,3′-diaminobenzidine; hpfs, high-power fields; SSC, side scatter.
Figure 3.
Figure 3.
Eosinophils infiltrate and degranulate in Mtb granulomas of rhesus macaques. (A) Representative FACS plots of EPX staining of eosinophils in WB from healthy donors and uninfected rhesus macaques WB and BAL. (B) Animal ID list and corresponding color code of Mtb infections in the present study (two independent studies, n = 3–4, male and female) and percentage of eosinophils in pulmonary Mtb granulomas (n = 46). (C) Correlation plot of eosinophil frequency and granuloma Mtb CFU (Spearman correlation test). (D) Left: Representative FACS plots of eosinophil CD63 surface expression to quantify degranulation in indicated tissues. Right: Summary data on frequency of degranulated eosinophils per individual granuloma (n = 46; Wilcoxon matched pairs test for WB and BAL comparison and two-tailed ratio matched paired t test for granuloma comparisons). (E) Correlation plot of frequency of CD63+ eosinophils and eosinophil abundance (Spearman correlation test). (F) Correlation plot of frequency of CD63+ eosinophils and granuloma Mtb CFU (Spearman correlation test). eos, eosinophil; p.i., postinfection; SSC, side scatter.
Figure 4.
Figure 4.
Pulmonary transcriptional profiling of Mtb-infected eosinophil-deficient mice reveals perturbations in lung neuronal-associated pathways. (A) Cell number of lung parenchymal (CD45 i.v.neg) eosinophils over time after standard low-dose (100–300 CFU aerosol Mtb H37Rv infection in B6 mice, male and female, n = 12–25 per time point, three to four independent experiments, Mann–Whitney test). (B) Representative FACS plots of i.v. staining and Mtb–mCherry quantification of eosinophils in the lungs of B6 WT mice after Mtb aerosol infection at d30 (three to four independent experiments). (C) Representative sections of H&E staining from paraffin-embedded lungs of Mtb-infected (d90) WT or B6 ΔdblGata mice (male and female, n = 5–6, two independent experiments). Scale bars = 250 μm (5×). (D) Heatmap of top 20 upregulated and top 20 downregulated DEGs of d90 WT compared with d90 B6 ΔdblGata normalized to uninfected (uninf.) WT mice (female, n = 4–5, one experiment). Neuronal-associated genes are highlighted in pink; lipid and short-chain fatty acid metabolism are highlighted in green. (E) GSEA based on Reactome and Kyoto Encyclopedia of Genes and Genomes (KEGG) of key pathways that are selectively downregulated in d90 B6 ΔdblGata mice. Neuronal-associated pathways are highlighted in pink; lipid and short-chain fatty acid metabolism pathways are highlighted in green. AMPA, α-amino-3-hydroxy-5-methyl-4-isoxazolepropionic acid; AMPK, AMP-activated protein kinase; GABA, γ-aminobutyric acid; SLC, solute carrier.
Figure S3.
Figure S3.
Transcriptional changes and immune profiling in eosinophil-deficient mice after Mtb infection. (A) Example flow cytometry of eosinophils in B6 WT and ΔdblGata mice and lung eosinophil frequency in naive and Mtb-infected (100–300 CFU) B6 WT and eosinophil-deficient mice (male and female, n = 3–28, one to four independent experiments per time point, Mann–Whitney test). (B) Numbers of total and lung parenchymal (i.v.neg) eosinophils at indicated time points after Mtb infection (male and female, n = 12–25, three to four independent experiments per time point, Mann–Whitney test). (C and D) Representative flow cytometry for intravascular stain and ESAT64-17 CD4 tetramer with quantification of Mtb-specific CD4+ T cells and Mtb-specific CD8+ T cells 4 wk after infection (male and female, n = 8–10, two experiments, Mann–Whitney test). (E and F) Quantification of total CD4+ cells and ESAT64-17 CD4 tetramer-positive CD4+ T cells and total CD8+ and TB10.44–11-specific CD8 tetramer-positive cells 3 mo after infection (male and female, n = 5–6, two experiments, Mann–Whitney test). (G–I) Quantification at 3 mo after infection of Nk1.1+ cells, neutrophils, and interstitial macrophages (Macs)/DC2 and their corresponding frequency of arginase (Arg1) or inducible nitric oxide synthase (Nos2) expression (male and female, n = 5–6, two experiments, Mann–Whitney test). (J and K) Quantification at baseline and 3 mo after infection of alveolar macrophages (AM) and XCR1+ conventional DC1 (cDC1; female, n = 4–6, one experiment, Mann–Whitney test). (L) Volcano plot of DEGs (red) between lungs of d90 WT (n = 4) or B6 ΔdblGata (n = 5) Mtb-infected mice. Green represents genes with log2 fold change ±1.4, blue represents genes with a P value and FDR <0.05, and gray represents genes that are not significant. The changes in gene expression levels were considered significant when statistical test values (FDR-adjusted P value) were <0.05 and the fold change/difference higher than ±1.4. Neuronal-associated genes are annotated in pink (n = 4–5 per group, one experiment). (M) Venn diagram of DEGs in lungs from 3-mo (d90)–infected WT B6 (n = 4) or B6 ΔdblGata mice (n = 5) and uninfected (d0) B6 ΔdblGata (n = 4) compared with lungs from uninfected (d0) WT B6 mice (n = 5). Upregulated DEGs are shown in red and downregulated DEGs in blue (n = 4–5 per group, one experiment). (N) Lung bacterial loads 85 d after high-dose Mtb infection in eosinophil-deficient B6 PHIL mice (male, n = 4–5, one experiment, Mann–Whitney test).
Figure 5.
Figure 5.
Eosinophil deficiency in mice results in increased susceptibility to Mtb infection. (A) CFU over time in lungs of WT B6 or B6 ΔdblGata mice infected with standard low-dose Mtb H37Rv (100–300 CFU; male and female, n = 11–21, two to three experiments per time point, Mann–Whitney test). (B) Survival of WT Balb/C or B6 or ΔdblGata infected with low-dose Mtb (100–300 CFU; male and female, n = 5–12, two to three experiments each, Mantel–Cox test). (C) Survival of WT B6 or PHIL mice after infection with 100–300 CFU Mtb (male and female, n = 4–8, two experiments each, Mantel–Cox test). (D) Lung CFU 80 d after high-dose (1,000–1,500 CFU) Mtb infection of WT B6 or B6 ΔdblGata mice (male and female, n = 11–21, three experiments, Mann-Whitney test). (E) Survival of WT Balb/C or B6 or ΔdblGata with 1,000–1,500 CFU Mtb infection (n = 13–27, three to four experiments each, Mantel–Cox test). (F) Survival of WT B6 or PHIL mice after infection with 1,000–1,500 CFU Mtb (male and female, n = 17–18, three experiments, Mantel–Cox test).

References

    1. Abate, E., Belayneh M., Idh J., Diro E., Elias D., Britton S., Aseffa A., Stendahl O., and Schön T.. 2015. Asymptomatic helminth infection in active tuberculosis is associated with increased regulatory and Th-2 responses and a lower sputum smear positivity. PLoS Negl. Trop. Dis. 9:e0003994. 10.1371/journal.pntd.0003994 - DOI - PMC - PubMed
    1. Acharya, K.R., and Ackerman S.J.. 2014. Eosinophil granule proteins: Form and function. J. Biol. Chem. 289:17406–17415. 10.1074/jbc.R113.546218 - DOI - PMC - PubMed
    1. Anderson, K.G., Mayer-Barber K., Sung H., Beura L., James B.R., Taylor J.J., Qunaj L., Griffith T.S., Vezys V., Barber D.L., and Masopust D.. 2014. Intravascular staining for discrimination of vascular and tissue leukocytes. Nat. Protoc. 9:209–222. 10.1038/nprot.2014.005 - DOI - PMC - PubMed
    1. Arnold, I.C., Artola-Borán M., Tallón de Lara P., Kyburz A., Taube C., Ottemann K., van den Broek M., Yousefi S., Simon H.U., and Müller A.. 2018. Eosinophils suppress Th1 responses and restrict bacterially induced gastrointestinal inflammation. J. Exp. Med. 215:2055–2072. 10.1084/jem.20172049 - DOI - PMC - PubMed
    1. Babu, S., and Nutman T.B.. 2016. Helminth-tuberculosis co-infection: An immunologic perspective. Trends Immunol. 37:597–607. 10.1016/j.it.2016.07.005 - DOI - PMC - PubMed

Publication types

MeSH terms