

Comparison of ARIMA, ETS, NNAR, TBATS and hybrid models to forecast the second wave of COVID-19 hospitalizations in Italy
- PMID: 34347175
- PMCID: PMC8332000
- DOI: 10.1007/s10198-021-01347-4
Comparison of ARIMA, ETS, NNAR, TBATS and hybrid models to forecast the second wave of COVID-19 hospitalizations in Italy
Abstract
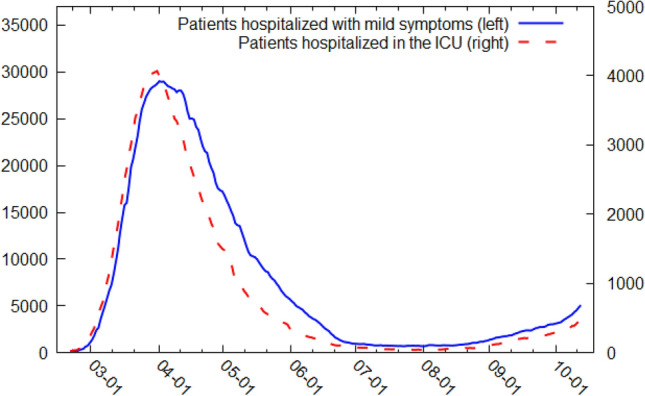
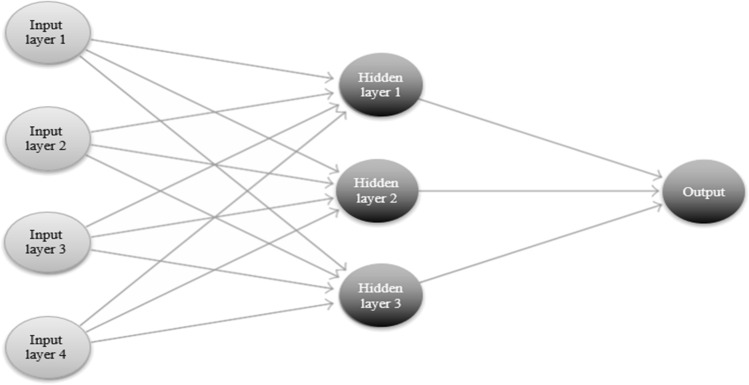
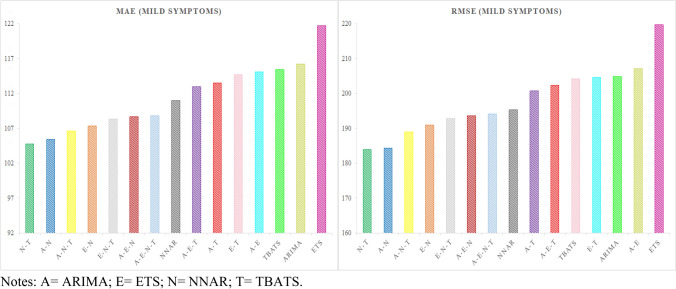
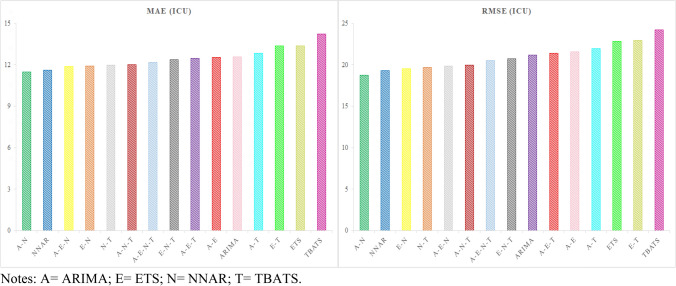
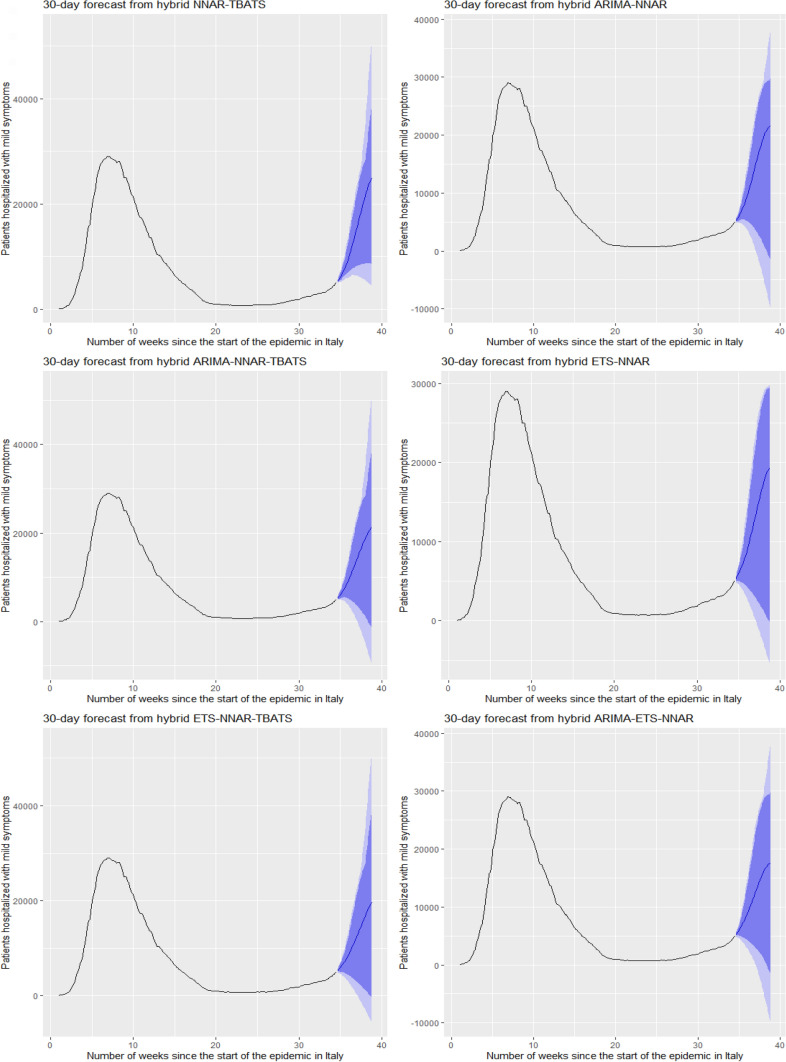
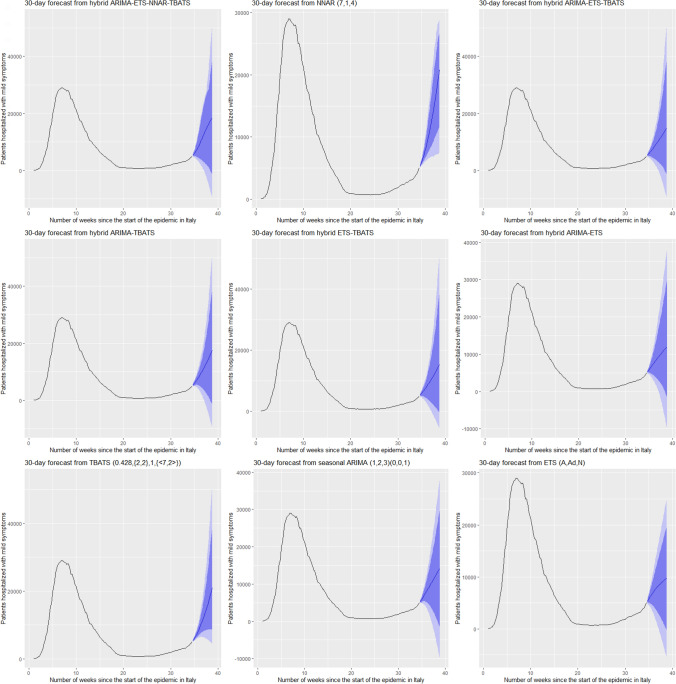
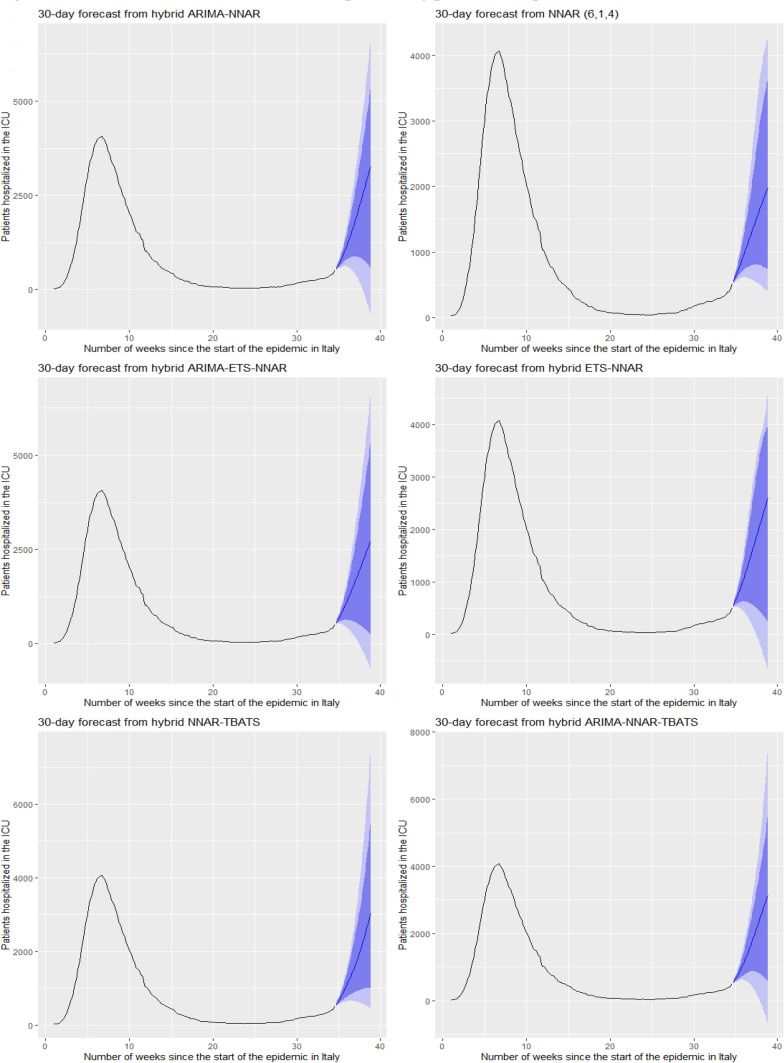
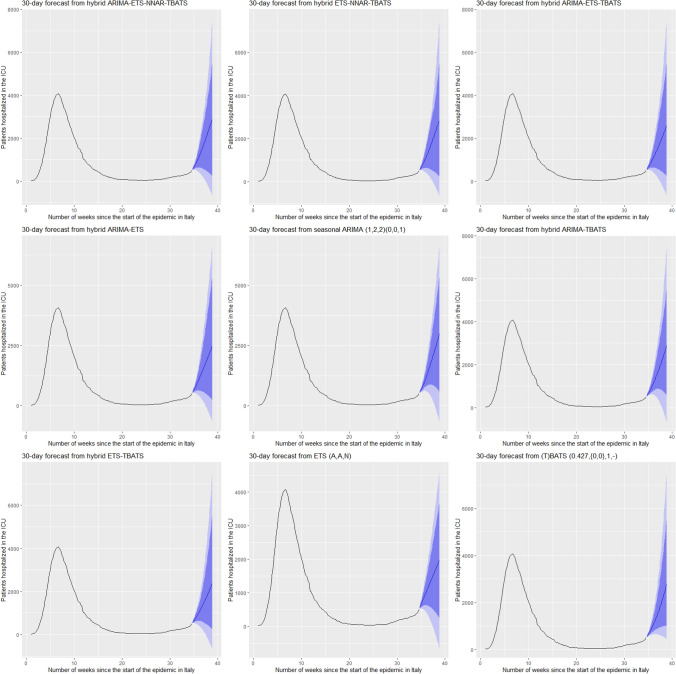
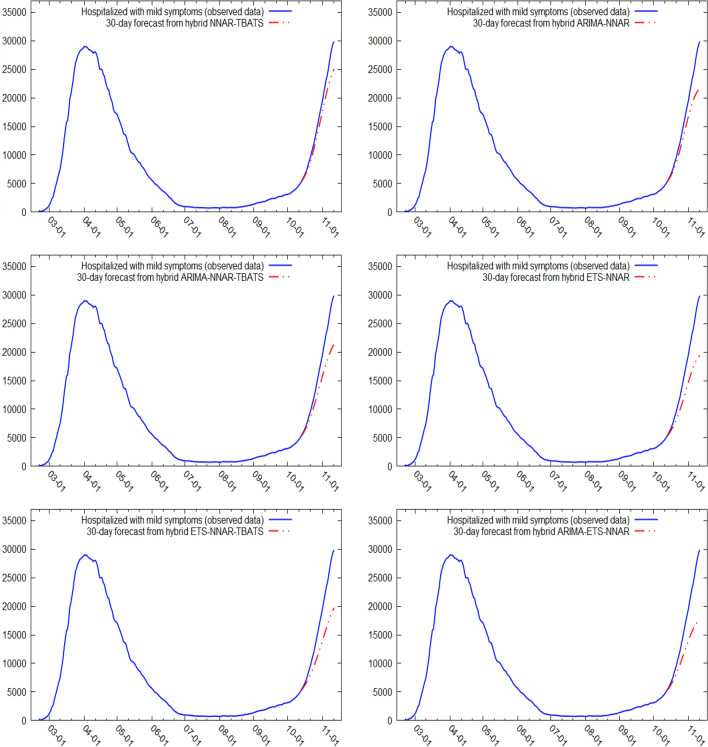
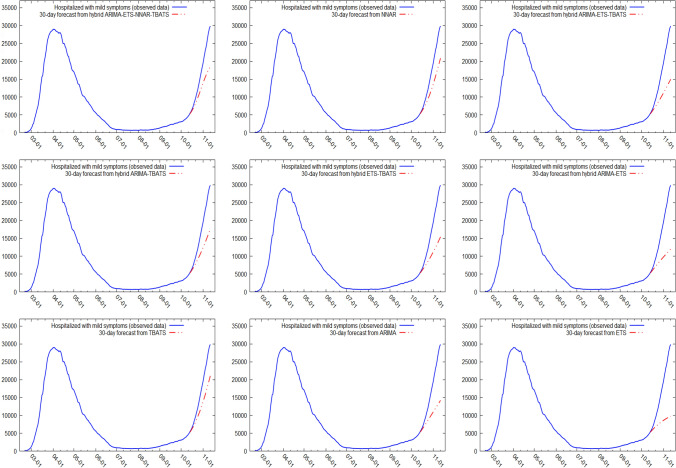
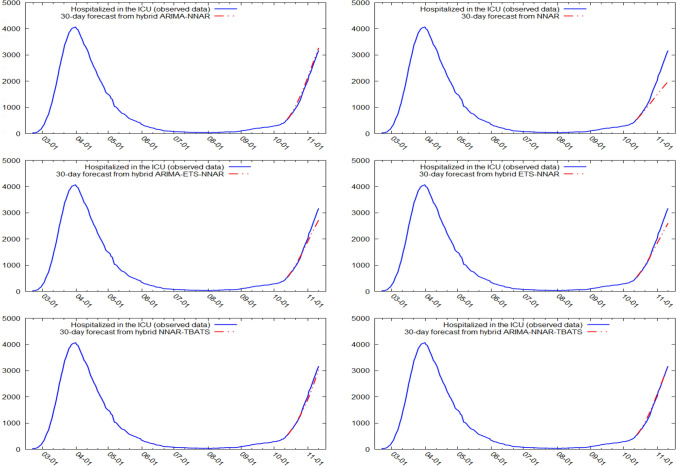
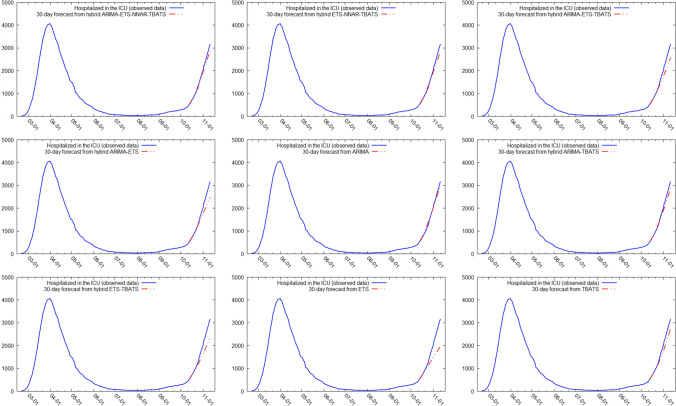
The coronavirus disease (COVID-19) is a severe, ongoing, novel pandemic that emerged in Wuhan, China, in December 2019. As of January 21, 2021, the virus had infected approximately 100 million people, causing over 2 million deaths. This article analyzed several time series forecasting methods to predict the spread of COVID-19 during the pandemic's second wave in Italy (the period after October 13, 2020). The autoregressive moving average (ARIMA) model, innovations state space models for exponential smoothing (ETS), the neural network autoregression (NNAR) model, the trigonometric exponential smoothing state space model with Box-Cox transformation, ARMA errors, and trend and seasonal components (TBATS), and all of their feasible hybrid combinations were employed to forecast the number of patients hospitalized with mild symptoms and the number of patients hospitalized in the intensive care units (ICU). The data for the period February 21, 2020-October 13, 2020 were extracted from the website of the Italian Ministry of Health ( www.salute.gov.it ). The results showed that (i) hybrid models were better at capturing the linear, nonlinear, and seasonal pandemic patterns, significantly outperforming the respective single models for both time series, and (ii) the numbers of COVID-19-related hospitalizations of patients with mild symptoms and in the ICU were projected to increase rapidly from October 2020 to mid-November 2020. According to the estimations, the necessary ordinary and intensive care beds were expected to double in 10 days and to triple in approximately 20 days. These predictions were consistent with the observed trend, demonstrating that hybrid models may facilitate public health authorities' decision-making, especially in the short-term.
Keywords: ARIMA; COVID-19; Hybrid forecasting models; Italy; NNAR; Outbreak; TBATS.
© 2021. The Author(s).
Conflict of interest statement
The author declares that he has no known competing financial interests or personal relationships that could have appeared to influence the work reported in this paper.
Figures
Similar articles
-
Time-Series Analysis for the Number of Foot and Mouth Disease Outbreak Episodes in Cattle Farms in Thailand Using Data from 2010-2020.Viruses. 2022 Jun 23;14(7):1367. doi: 10.3390/v14071367. Viruses. 2022. PMID: 35891349 Free PMC article.
-
Forecasting COVID-19 confirmed cases, deaths and recoveries: Revisiting established time series modeling through novel applications for the USA and Italy.PLoS One. 2021 Jan 7;16(1):e0244173. doi: 10.1371/journal.pone.0244173. eCollection 2021. PLoS One. 2021. PMID: 33411744 Free PMC article.
-
Using meta-learning to recommend an appropriate time-series forecasting model.BMC Public Health. 2024 Jan 10;24(1):148. doi: 10.1186/s12889-023-17627-y. BMC Public Health. 2024. PMID: 38200512 Free PMC article.
-
Empirical Evaluation of Alternative Time-Series Models for COVID-19 Forecasting in Saudi Arabia.Int J Environ Res Public Health. 2021 Aug 16;18(16):8660. doi: 10.3390/ijerph18168660. Int J Environ Res Public Health. 2021. PMID: 34444409 Free PMC article.
-
Developing a seasonal-adjusted machine-learning-based hybrid time‑series model to forecast heatwave warning.Sci Rep. 2025 Mar 13;15(1):8699. doi: 10.1038/s41598-025-93227-7. Sci Rep. 2025. PMID: 40082574 Free PMC article.
Cited by
-
Automatic Forecast of Intensive Care Unit Admissions: The Experience During the COVID-19 Pandemic in Italy.J Med Syst. 2023 Aug 5;47(1):84. doi: 10.1007/s10916-023-01982-9. J Med Syst. 2023. PMID: 37542644 Free PMC article.
-
Forecasting cardiovascular disease mortality using artificial neural networks in Sindh, Pakistan.BMC Public Health. 2025 Jan 4;25(1):34. doi: 10.1186/s12889-024-21187-0. BMC Public Health. 2025. PMID: 39754102 Free PMC article.
-
Navigating Samarinda's climate: A comparative analysis of rainfall forecasting models.MethodsX. 2024 Dec 4;14:103080. doi: 10.1016/j.mex.2024.103080. eCollection 2025 Jun. MethodsX. 2024. PMID: 39741895 Free PMC article.
-
Exploring different modelling approaches to forecast the community acute respiratory infections burden in children: an Italian epidemiological time series study.BMC Public Health. 2025 Feb 28;25(1):810. doi: 10.1186/s12889-025-21984-1. BMC Public Health. 2025. PMID: 40022071 Free PMC article.
-
Forecasting ICU Census by Combining Time Series and Survival Models.Crit Care Explor. 2023 May 5;5(5):e0912. doi: 10.1097/CCE.0000000000000912. eCollection 2023 May. Crit Care Explor. 2023. PMID: 37168689 Free PMC article.
References
-
- Abotaleb MSA. Predicting COVID-19 cases using some statistical models: an application to the cases reported in China Italy and USA. Acad. J. Appl. Math. Sci. 2020;6(4):32–40.
MeSH terms
LinkOut - more resources
Full Text Sources
Medical
Research Materials
