. 2021 Nov;51(11):2568-2575.
doi: 10.1002/eji.202149209. Epub 2021 Aug 19.

Granzyme A and CD160 expression delineates ILC1 with graded functions in the mouse liver

Affiliations

Granzyme A and CD160 expression delineates ILC1 with graded functions in the mouse liver

Chiara Di Censo et al. Eur J Immunol. 2021 Nov.

Abstract

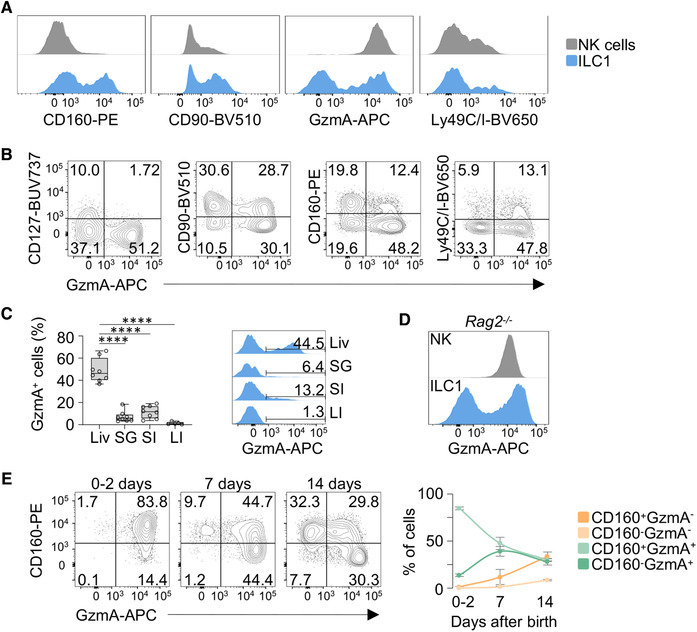
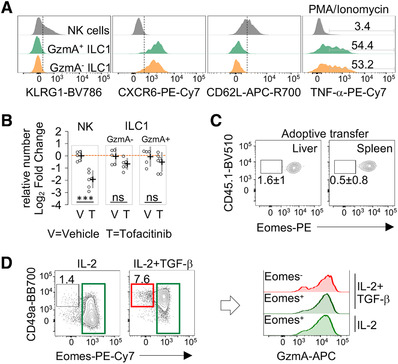
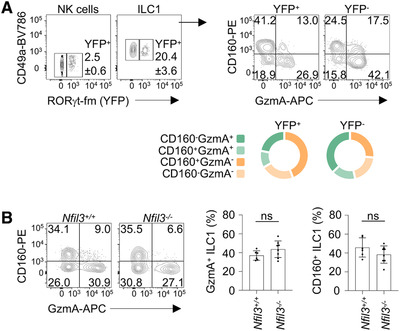
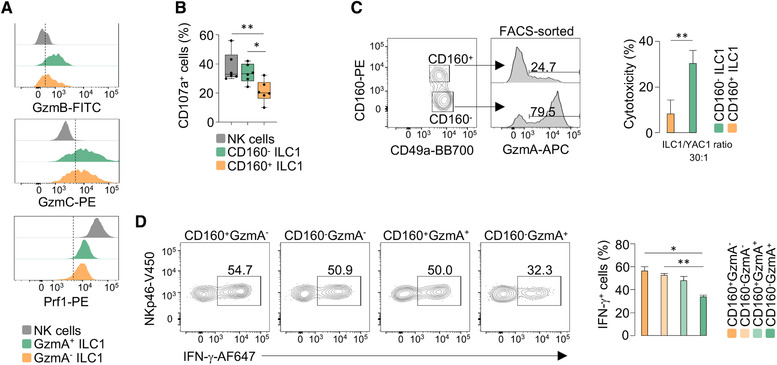
Type 1 innate lymphoid cells (ILC1) are tissue-resident lymphocytes that provide early protection against bacterial and viral infections. Discrete transcriptional states of ILC1 have been identified in homeostatic and pathological contexts. However, whether these states delineate ILC1 with different functional properties is not completely understood. Here, we show that liver ILC1 are heterogeneous for the expression of distinct effector molecules and surface receptors, including granzyme A (GzmA) and CD160, in mice. ILC1 expressing high levels of GzmA are enriched in the liver of adult mice, and represent the main hepatic ILC1 population at birth. However, the heterogeneity of GzmA and CD160 expression in hepatic ILC1 begins perinatally and increases with age. GzmA+ ILC1 differ from NK cells for the limited homeostatic requirements of JAK/STAT signals and the transcription factor Nfil3. Moreover, by employing Rorc(γt)-fate map (fm) reporter mice, we established that ILC3-ILC1 plasticity contributes to delineate the heterogeneity of liver ILC1, with RORγt-fm+ cells skewed toward a GzmA- CD160+ phenotype. Finally, we showed that ILC1 defined by the expression of GzmA and CD160 are characterized by graded cytotoxic potential and ability to produce IFN-γ. In conclusion, our findings help deconvoluting ILC1 heterogeneity and provide evidence for functional diversification of liver ILC1.

Keywords: CD160; Nfil3; granzyme A; innate lymphoid cells; natural killer.


Conflict of interest statement

The authors declare no conflict of interest.

Figures

Figure 1
Figure 1
GzmA+ ILC1 accumulate in the mouse liver. (A) Histogram plots for the indicated markers are shown for liver NK cells (gray) and ILC1 (blue). Each marker was assessed by flow cytometry in at least 3 mice in three independent experiments. See Supporting Information S1A. (B) Representative contour plots show the expression of indicated markers versus GzmA in liver ILC1. (C) Box plot and histogram plot showing the percentage of GzmA+ cells among ILC1 isolated from liver (Li), salivary glands (SG), small intestine (SI) and large intestine (LI). Three independent experiments (2–3 mice per group) were performed (one‐way ANOVA was applied; ****P < 0.0001). (D) Histogram plot depicts GzmA expression in NK cells (gray) and ILC1 (blue) isolated from the liver of Rag2–/– mice. Data are representative of at least three independent experiments (n = 6). (E) Representative contour plots of CD160 and GzmA expression in ILC1 isolated from the liver of 0–2 days, 7 days and 14 days old mice. Scatter plot shows the percentage of the indicated populations at different ages. Data are shown as mean ± SD. Two independent experiments, with at least three mice per group, were performed.
Figure 2
Figure 2
NK cells have limited potential to give rise to GzmA+ ILC1. (A) Flow cytometry stacked histogram plots for KLRG1, CXCR6, and CD62L in freshly isolated hepatic NK cells (gray), GzmA+ ILC1 (green) and GzmA ILC1 (orange); and TNF‐α expression after PMA/Ionomycin stimulation. A representative experiment (3 mice per group), of at least three performed, is shown. (B) Scatter plot displays the relative number of NK cells, GzmA+ and GzmA ILC1 in tofacitinib‐ (n = 6) and vehicle‐treated (n = 5) mice (as log2 fold change, FC relative to control mice). Mean with 95% CI is shown. Each dot represents an individual mouse. Two independent experiments were combined (one‐way ANOVA was applied; ***P < 0.001; ns, not significant). (C) Contour plots show percentage of donor CD45.1+Eomes NK cells, isolated from the spleen and liver of recipient mice, 2 weeks post‐injection. Data represent one experiment of out of four performed (n = 4). (D) Representative contour plots of CD49a and Eomes expression in splenic NK cells cultured with IL‐2 or IL‐2/TGF‐β for 5–7 days (left). Histogram plots (right) display GzmA expression in the indicated conditions. Data shown are representative of three independent experiments (n = 3).
Figure 3
Figure 3
Contribution of ILC3‐ILC1 plasticity and Nfil3 in the establishment of liver ILC1 heterogeneity. (A) Contour plots depict the percentage of YFP+ cells among NK cells and ILC1 isolated from livers of RORγt‐fm mice (left). Contour plots and donut charts (right) show the proportions of ILC1 discriminated by CD160 and GzmA expression, within YFP+ and YFP cells. Two independent experiments were performed (n = 6). (B) Representative contour plots of CD160 and GzmA expression in ILC1 isolated from liver of Nfil3+/+ (n = 6) and Nfil3–/– (n = 8) mice. Histograms show the percentages of total GzmA+ and CD160+ ILC1 in Nfil3+/+ and Nfil3–/‐ mice. Data are shown as mean ± SD (two‐tailed Student's t‐test was applied; ns, not significant). Three independent experiments were combined.
Figure 4
Figure 4
Graded functionality of liver ILC1. (A) Stacked histogram plots display the expression of the indicated markers for liver NK cells (gray), GzmA+ ILC1 (green) and GzmA ILC1 (orange). Each marker was assessed by flow cytometry in at least three mice in three independent experiments. (B) Box plot shows the percentage of CD107a+ cells in NK cells, CD160 ILC1 and CD160+ ILC1, stimulated with plate bound anti‐NKR‐P1C. Data are presented as mean ± SD (one‐way ANOVA was applied; *P < 0.05; **P < 0.01). Three independent experiments were combined (n = 7). (C) FACS plots of GzmA expression of FACS‐sorted CD160+ and CD160 hepatic ILC1. Histogram plot displays the percentage of cytotoxicity of CD160+ and CD160 ILC1 against YAC‐1 cells, at an effector:target ratio of 30:1. Data are shown as mean ± SD of four independent experiments (two‐tailed Student's t‐test was applied; **P < 0.01). (D) Flow cytometry contour plots depict IFN‐γ expression in indicated ILC1 populations stimulated with IL‐12 plus IL‐18 for 6 h. Histogram plot shows percentage of IFN‐γ in ILC1 subsets. Data are presented as mean ± SD (one‐way ANOVA was applied; *P < 0.05; **P < 0.01) (n = 3). Four independent experiments were performed.

References

    1. Takeda, K. , Cretney, E. , Hayakawa, Y. , Ota, T. , Akiba, H. , Ogasawara, K. , Yagita, H. , et al., TRAIL identifies immature natural killer cells in newborn mice and adult mouse liver. Blood. 2005. 105: 2082–2089. - PubMed
    1. Vivier, E. , Artis, D. , Colonna, M. , Diefenbach, A. , Di Santo, J. P. , Eberl, G. , Koyasu, S. , et al., Innate Lymphoid Cells: 10 Years On. Cell. 2018. 174: 1054–1066. - PubMed
    1. Seillet, C. , Brossay, L. and Vivier, E. , Natural killers or ILC1s? That is the question. Curr. Opin. Immunol. 2021. 68: 48–53. - PMC - PubMed
    1. Riggan, L. , Freud, A. G. and O'Sullivan, T. E. , True Detective: Unraveling Group 1 Innate Lymphocyte Heterogeneity. Trends Immunol. 2019. 40: 909–921. - PMC - PubMed
    1. Gordon, S. M. , Chaix, J. , Rupp, L. J. , Wu, J. , Madera, S. , Sun, J. C. , Lindsten, T. et al., The transcription factors T‐bet and Eomes control key checkpoints of natural killer cell maturation. Immunity. 2012. 36: 55–67. - PMC - PubMed

Publication types

Grants and funding