. 2021 Sep 28;87(20):e0129921.
doi: 10.1128/AEM.01299-21. Epub 2021 Aug 4.

A New Dose-Response Model for Estimating the Infection Probability of Campylobacter jejuni Based on the Key Events Dose-Response Framework

Affiliations

A New Dose-Response Model for Estimating the Infection Probability of Campylobacter jejuni Based on the Key Events Dose-Response Framework

Hiroki Abe et al. Appl Environ Microbiol. .

Abstract

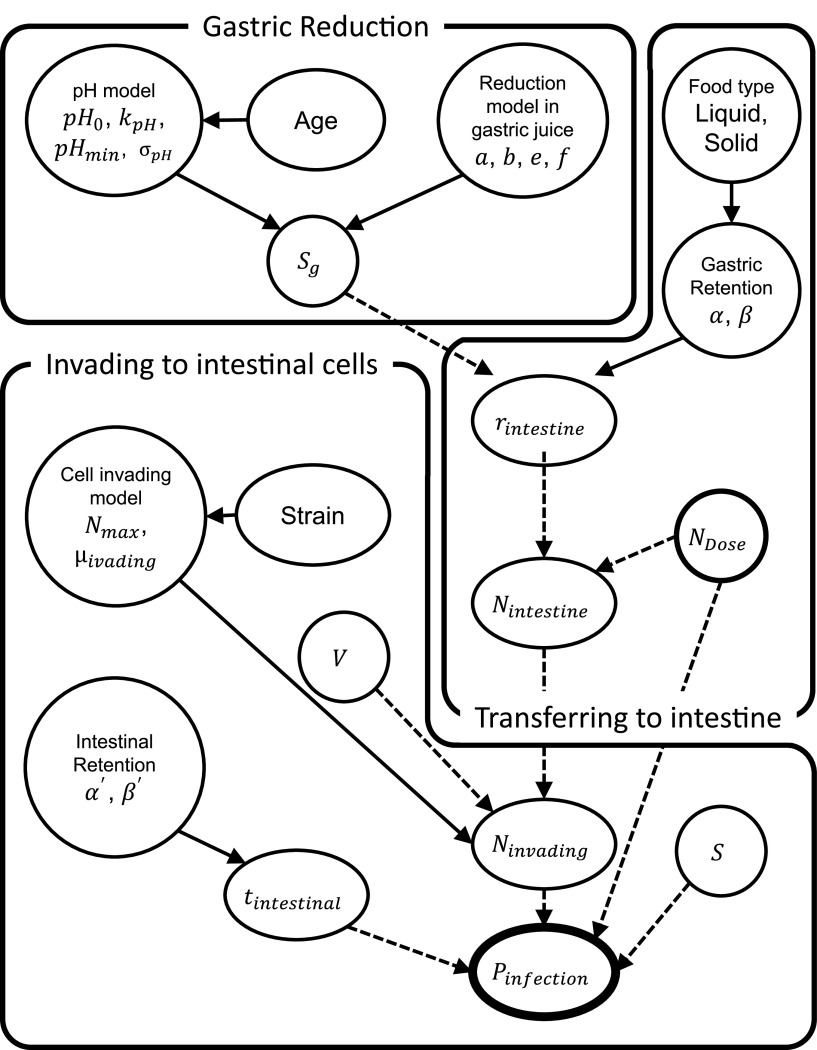
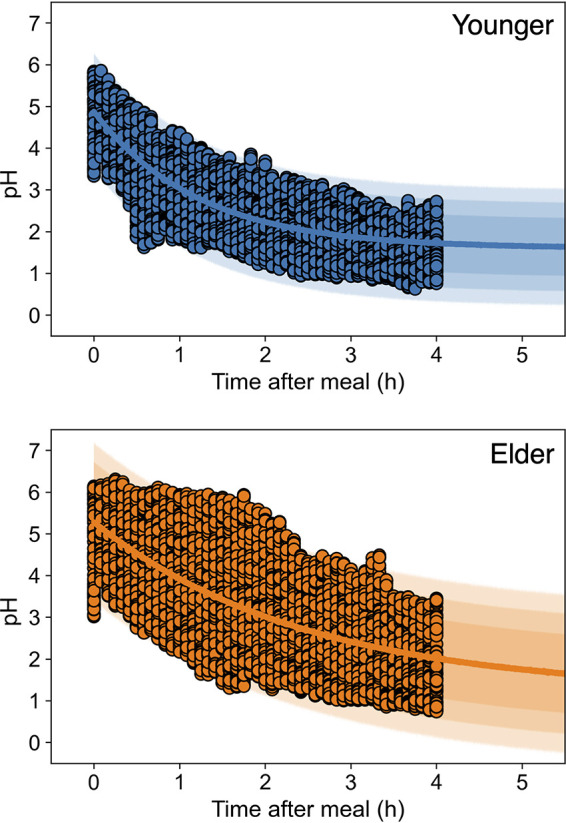
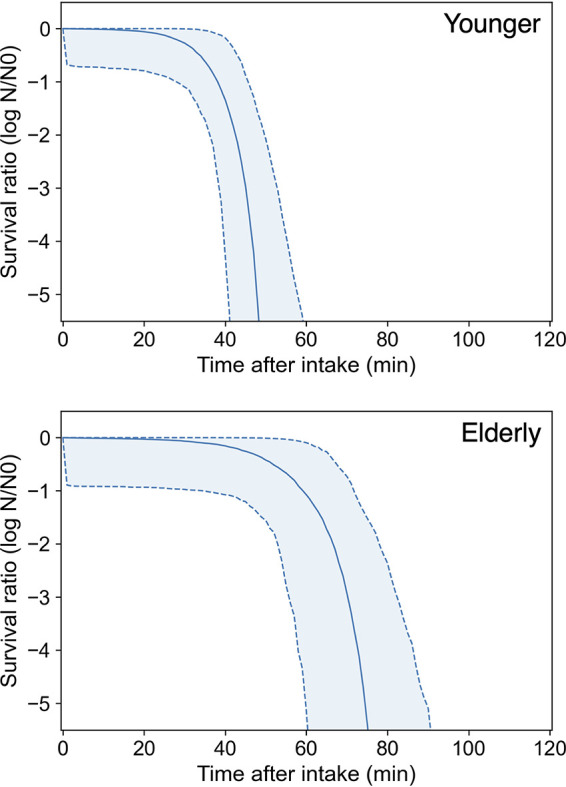
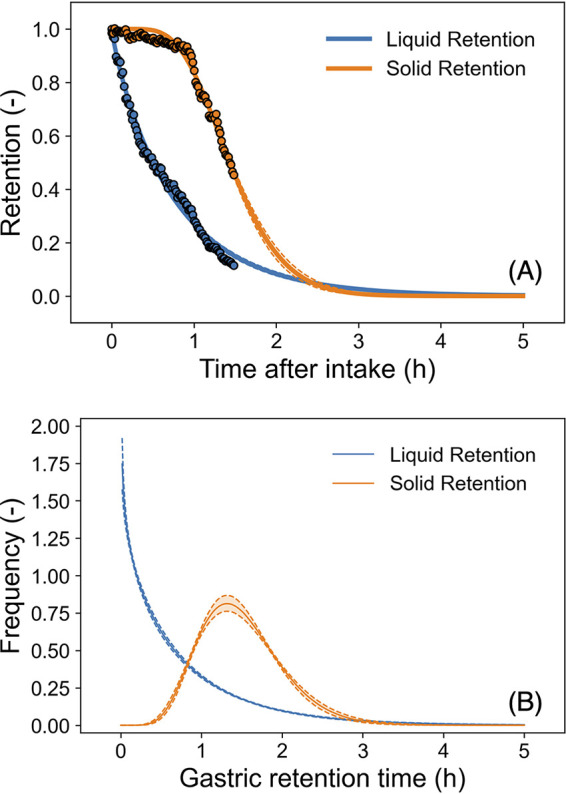
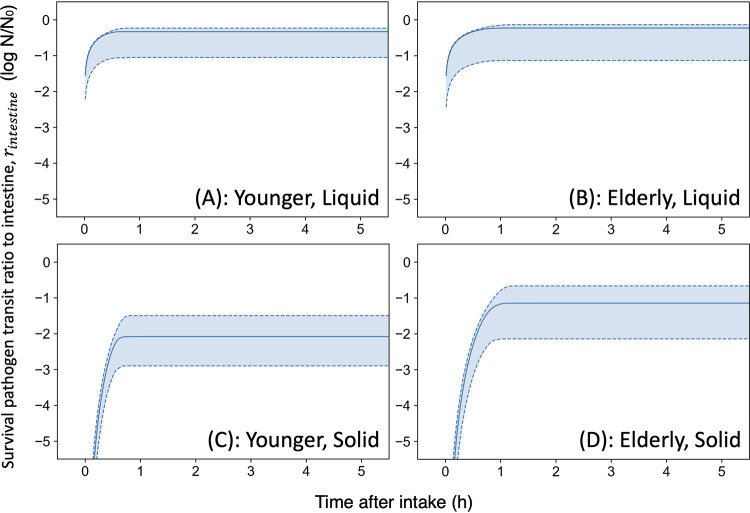
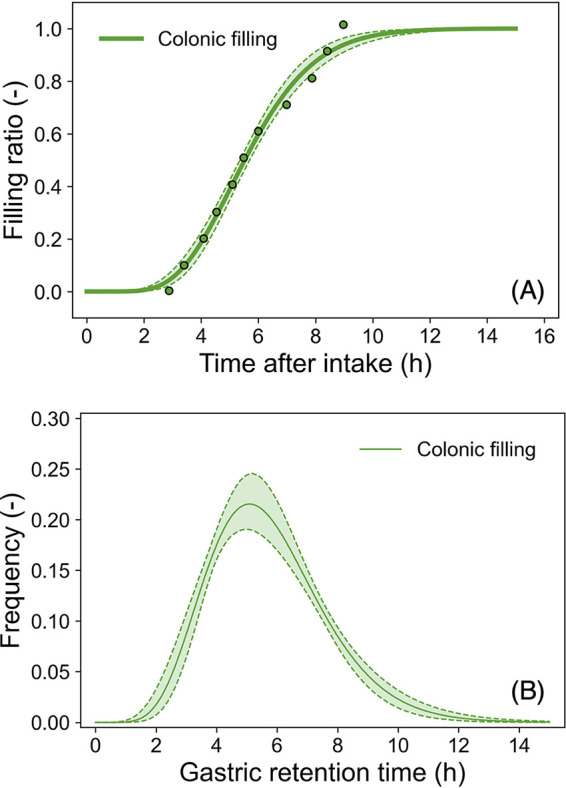
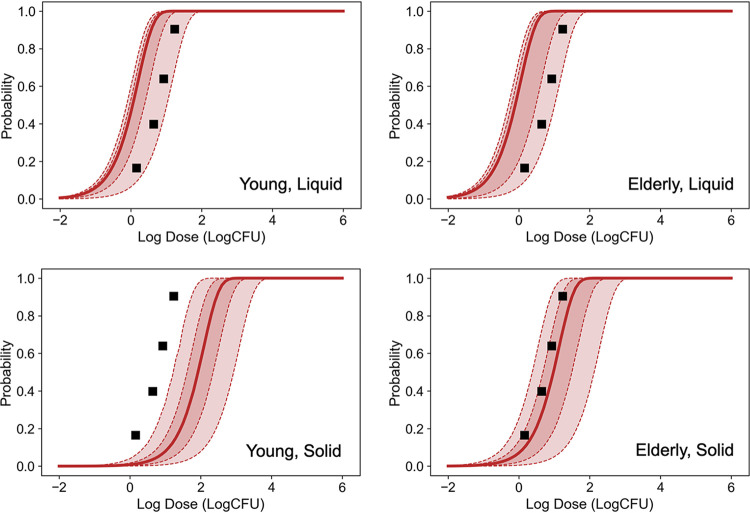
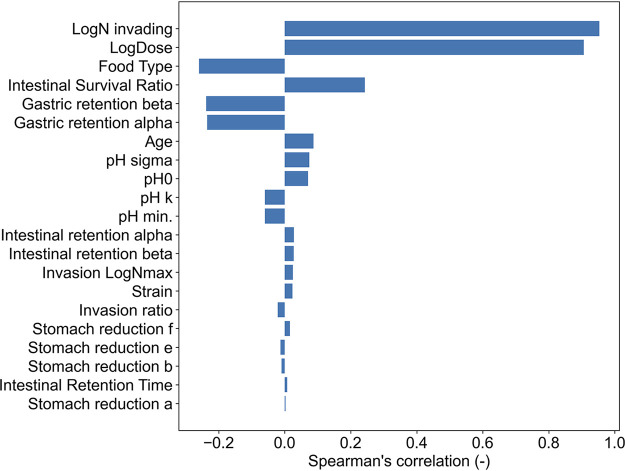
Understanding the dose-response relationship between ingested pathogenic bacteria and infection probability is a key factor for appropriate risk assessment of foodborne pathogens. The objectives of this study were to develop and validate a novel mechanistic dose-response model for Campylobacter jejuni and simulate the underlying mechanism of foodborne illness during digestion. Bacterial behavior in the human gastrointestinal environment, including survival at low pH in the gastric environment after meals, transition to intestines, and invasion to intestinal tissues, was described using a Bayesian statistical model based on the reported experimental results of each process while considering physical food types (liquid versus solid) and host age (young adult versus elderly). Combining the models in each process, the relationship between pathogen intake and the infection probability of C. jejuni was estimated and compared with reported epidemiological dose-response relationships. Taking food types and host age into account, the prediction range of the infection probability of C. jejuni successfully covered the reported dose-response relationships from actual C. jejuni outbreaks. According to sensitivity analysis of predicted infection probabilities, the host age factor and the food type factor have relatively higher relevance than other factors. Thus, the developed "key events dose-response framework" can derive novel information for quantitative microbiological risk assessment in addition to dose-response relationship. The framework is potentially applicable to other pathogens to quantify the dose-response relationship from experimental data obtained from digestion. IMPORTANCE Based on the mechanistic approach called the key events dose-response framework (KEDRF), an alternative to previous nonmechanistic approaches, the dose-response models for infection probability of C. jejuni were developed considering with age of people who ingest pathogen and food type. The developed predictive framework illustrates highly accurate prediction of dose (minimum difference 0.21 log CFU) for a certain infection probability compared with the previously reported dose-response relationship. In addition, the developed prediction procedure revealed that the dose-response relationship strongly depends on food type as well as host age. The implementation of the key events dose-response framework will mechanistically and logically reveal the dose-response relationship and provide useful information with quantitative microbiological risk assessment of C. jejuni on foods.

Keywords: Bayesian predictive model; foodborne pathogen; infection mechanism; quantitative microbial risk assessment.


Figures

FIG 1
FIG 1
Directed acyclic graph of the model parameters and factors. Solid arrows indicate distributions, dashed arrows deterministic functions. The abbreviations and details of components are summarized in Table 1.
FIG 2
FIG 2
Changes in the observed pH in human stomach after-meal pH data (points) of young adult (12) (upper) and elderly (13) (lower) people, and the prediction band derived from the exponential model. The estimated parameter traceplots and distributions of Bayesian MCMC can be found in Fig. S2 of the supplemental material.
FIG 3
FIG 3
Predicted after-meal survival curves (solid curve indicates the median; dashed curve and covered range indicate the 90% prediction band) of C. jejuni in the stomach of young adult (upper) and elderly (lower) people derived from a predictive model for C. jejuni reduction in gastric juice (36).
FIG 4
FIG 4
Estimated gastric retention ratio models (A and B). The reported retention ratio (14) (points in panel A) and the predicted gastric retention models based on the cumulative gamma distribution (curves in panel A); the predicted gamma densities for gastric retention time (B). The solid curve indicates the median; the dashed curve and covered range indicate the 90% prediction band. The estimated parameter traceplots and distributions of Bayesian MCMC can be found in Fig. S3 of the supplemental material.
FIG 5
FIG 5
Calculated transferred survival ratio (solid curve indicates the median; dashed curve and covered range indicate the 90% prediction band) in intestine under each condition. (A to D) Young adult and liquid food (A), elderly and liquid food (B), young adult and liquid food (C), elderly and solid food (D).
FIG 6
FIG 6
Estimated colonic (large intestine) filling ratio models (A and B). The reported colonic filling ratio (points in A) (15) and the predicted colonic filling model based on the cumulative gamma distribution (curves in panel A); the predicted gamma densities for the time for food to move from the small intestine to the large intestine after a meal (solid curve indicates the median; dashed curve and covered range indicate the 95% prediction band). The estimated parameter traceplots and distributions of Bayesian MCMC can be found in Fig. S4 of the supplemental material.
FIG 7
FIG 7
Predicted infection probability (solid curves indicate the median; dashed curve and covered ranges indicate the 60% and 95% prediction bands) of C. jejuni (total of all three strains) under each condition and the reported probability of illness (16) in an outbreak among children (8 to 13 years old) with milk (squares).
FIG 8
FIG 8
Spearman’s ranked correlation coefficients of parameter and computable factors against the predicted infection probability. Factors located at the upper position of this figure have a stronger relevance to infection probability. Log dose, logarithm of pathogen dose; pH 0, pH immediately after meal; pH k, Rate of decrease in pH; pH min, minimum pH value; pH sigma, SD of pH prediction; Stomach reduction a, secondary parameter of δ; Stomach reduction b, secondary parameter of δ; Stomach reduction c, secondary parameter of p; Stomach reduction d, secondary parameter of p; Gastric retention alpha, shape parameter of gamma distribution for gastric retention; Gastric retention beta, rate parameter of gamma distribution for gastric retention; Intestinal retention alpha, shape parameter of gamma distribution for intestinal retention; Intestinal retention beta, rate parameter of gamma distribution for intestinal retention; Intestinal survival ratio, survival pathogen transit ratio to intestine; Invasion rate, cell-invading rate of C. jejuni; Invasion N max, maximum invading counts to 1 cm2 of cell layer; Strain, strain indicator (RIMD 0366027: 1; RIMD 0366042: 2; RIMD 0366048: 3); Food type, food type indicator (liquid: 0; solid: 1); Age, mean age of individuals subjected to the pH test (young adult: 25; elderly: 71).

References

    1. Zwietering MH. 2009. Quantitative risk assessment: is more complex always better? Simple is not stupid and complex is not always more correct. Int J Food Microbiol 134:57–62. 10.1016/j.ijfoodmicro.2008.12.025. - DOI - PubMed
    1. Julien E, Boobis AR, Olin SS, ILSI Research Foundation Threshold Working Group. 2009. The Key Events Dose-Response Framework: a cross-disciplinary mode-of-action based approach to examining dose-response and thresholds. Crit Rev Food Sci Nutr 49:682–689. 10.1080/10408390903110692. - DOI - PMC - PubMed
    1. Buchanan RL, Havelaar AH, Smith MA, Whiting RC, Julien E. 2009. The Key Events Dose-Response Framework: its potential for application to foodborne pathogenic microorganisms. Crit Rev Food Sci Nutr 49:718–728. 10.1080/10408390903116764. - DOI - PMC - PubMed
    1. Koseki S, Mizuno Y, Sotome I. 2011. Modeling of pathogen survival during simulated gastric digestion. Appl Environ Microbiol 77:1021–1032. 10.1128/AEM.02139-10. - DOI - PMC - PubMed
    1. Koyama K, Ranta J, Takeoka K, Abe H, Koseki S. 2021. Evaluation of strain variability in inactivation of Campylobacter jejuni in simulated gastric fluid by using hierarchical Bayesian modeling. Appl Environ Microbiol 87:e00918-21. 10.1128/AEM.00918-21. - DOI - PMC - PubMed

Publication types