. 2021 Sep 28;87(20):e0129321.
doi: 10.1128/AEM.01293-21. Epub 2021 Aug 4.

Vibrio cholerae Motility in Aquatic and Mucus-Mimicking Environments

Affiliations

Vibrio cholerae Motility in Aquatic and Mucus-Mimicking Environments

Marianne Grognot et al. Appl Environ Microbiol. .

Abstract

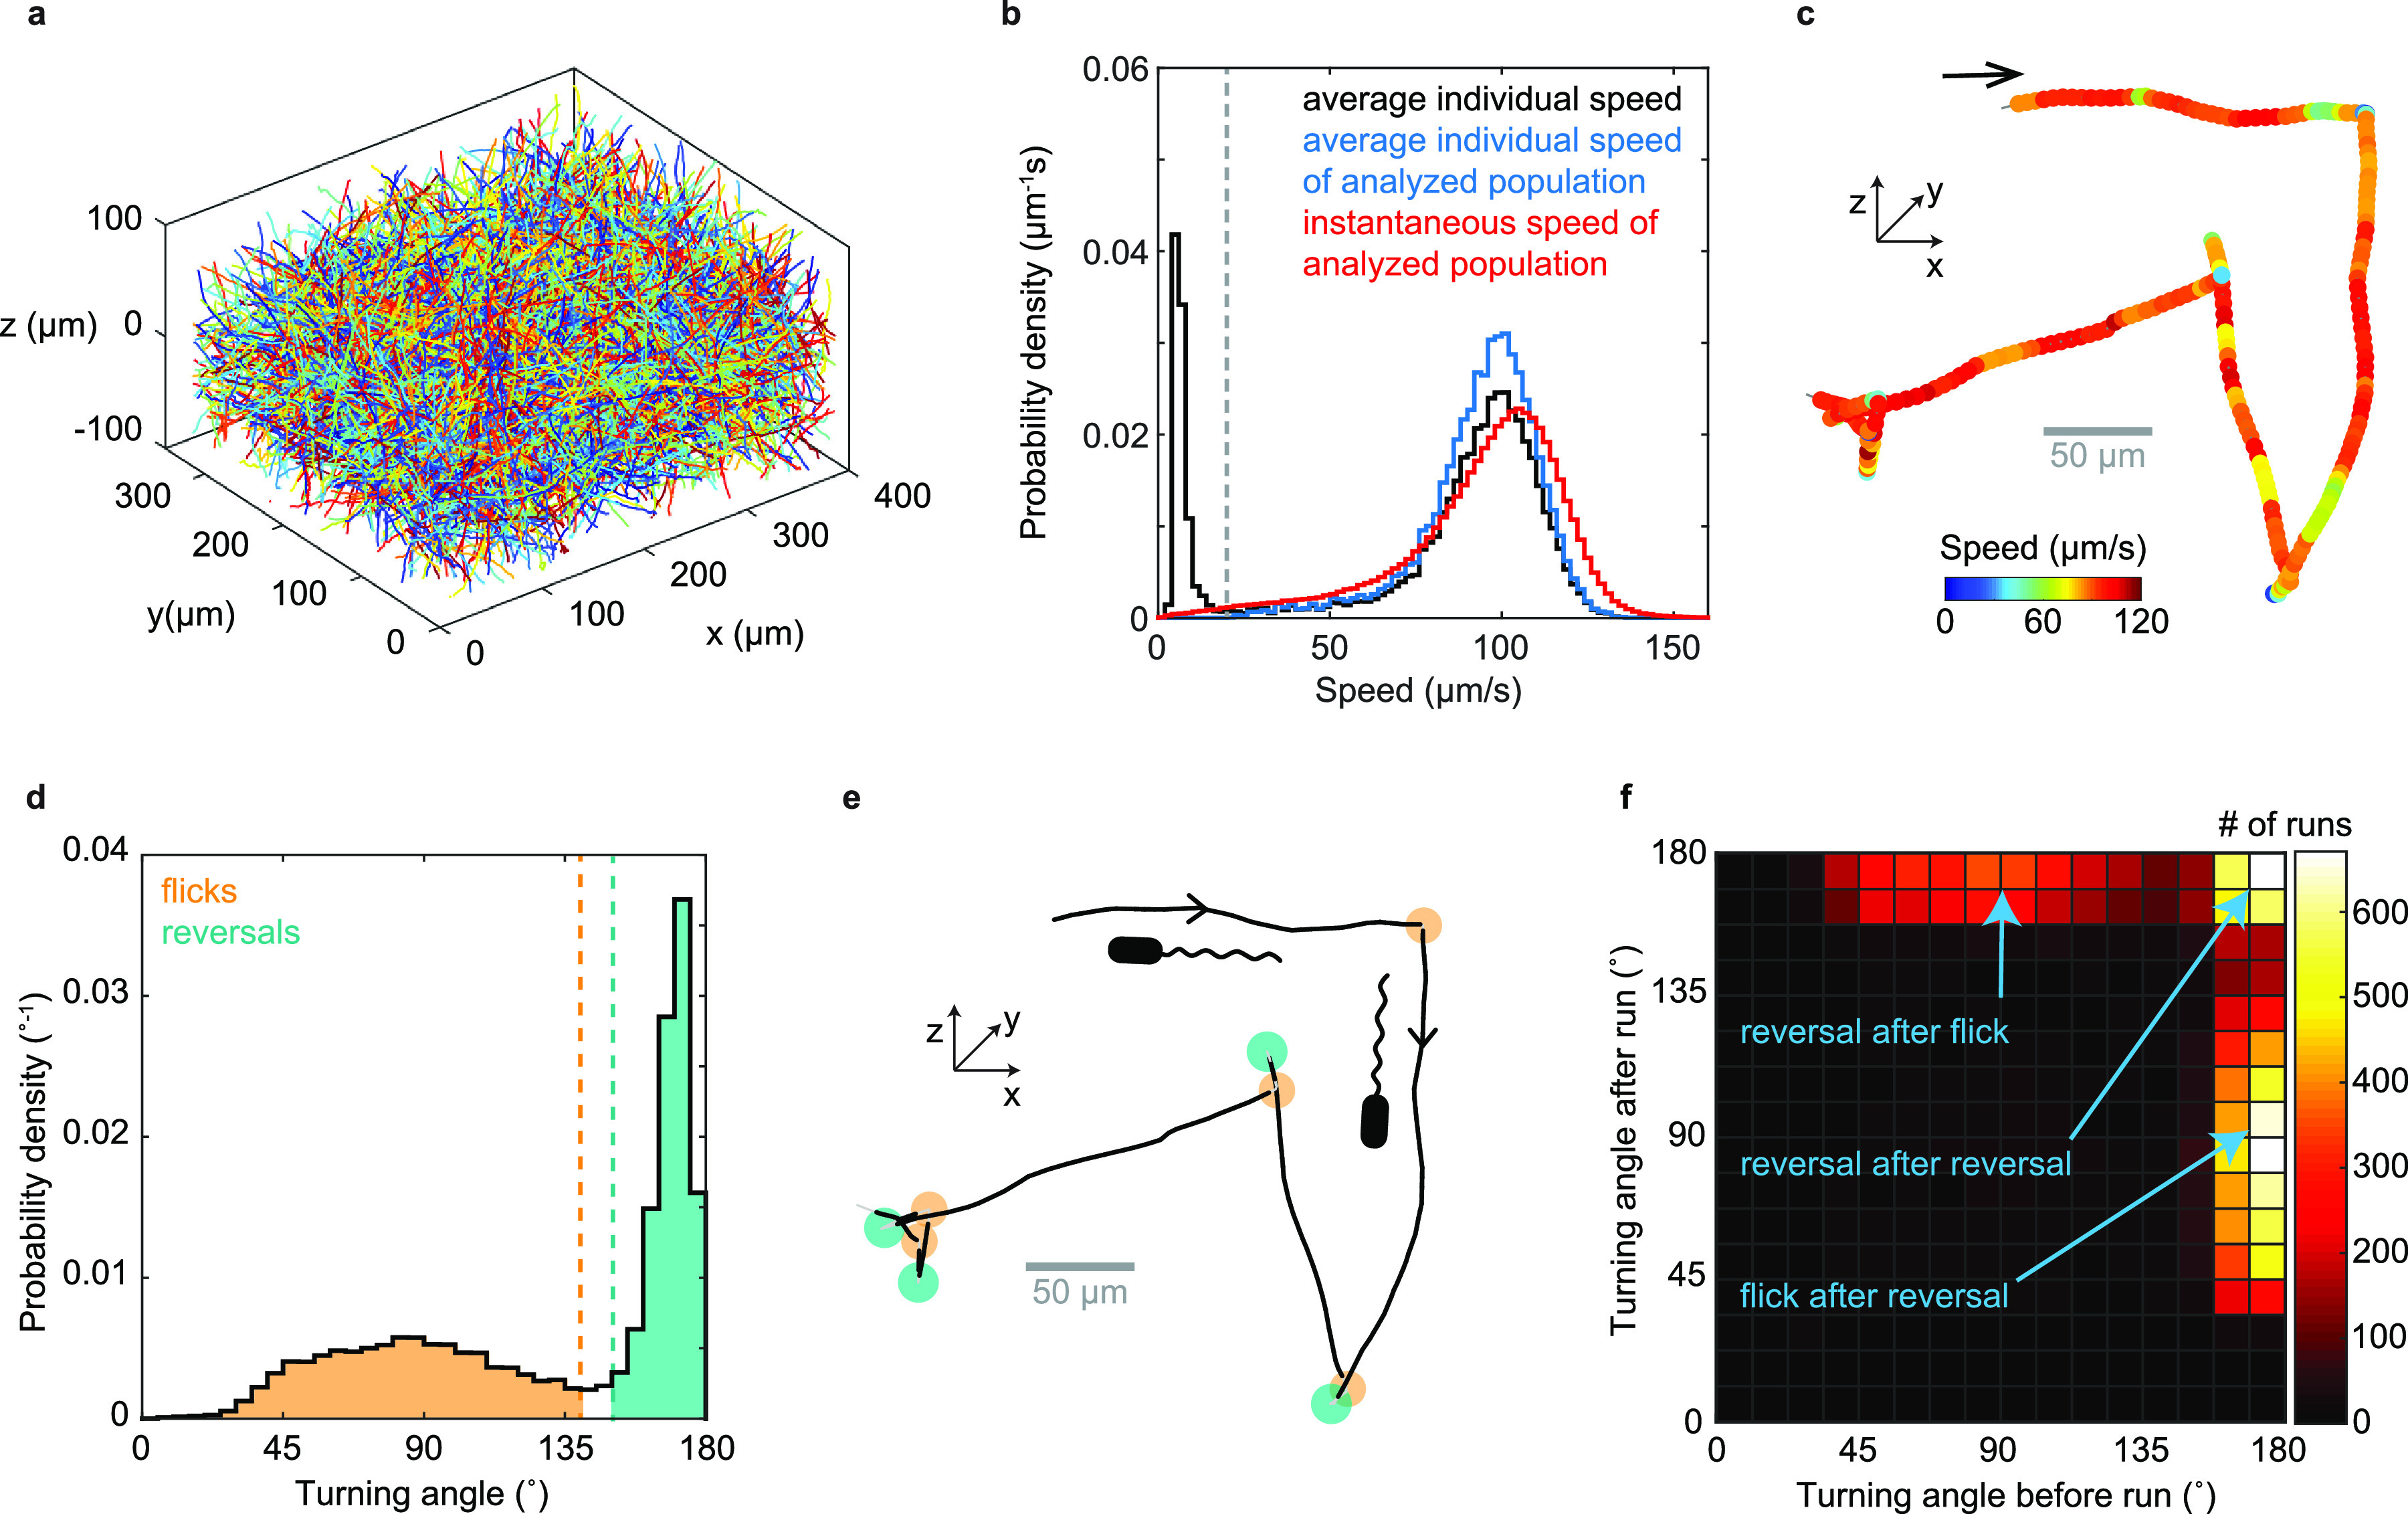
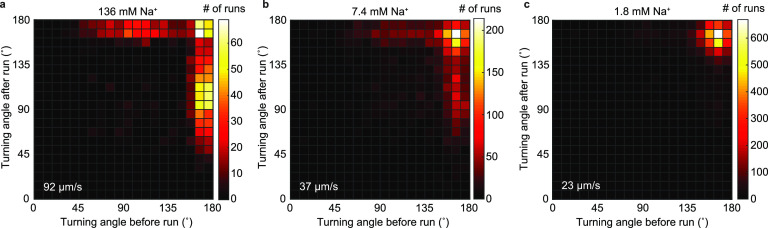
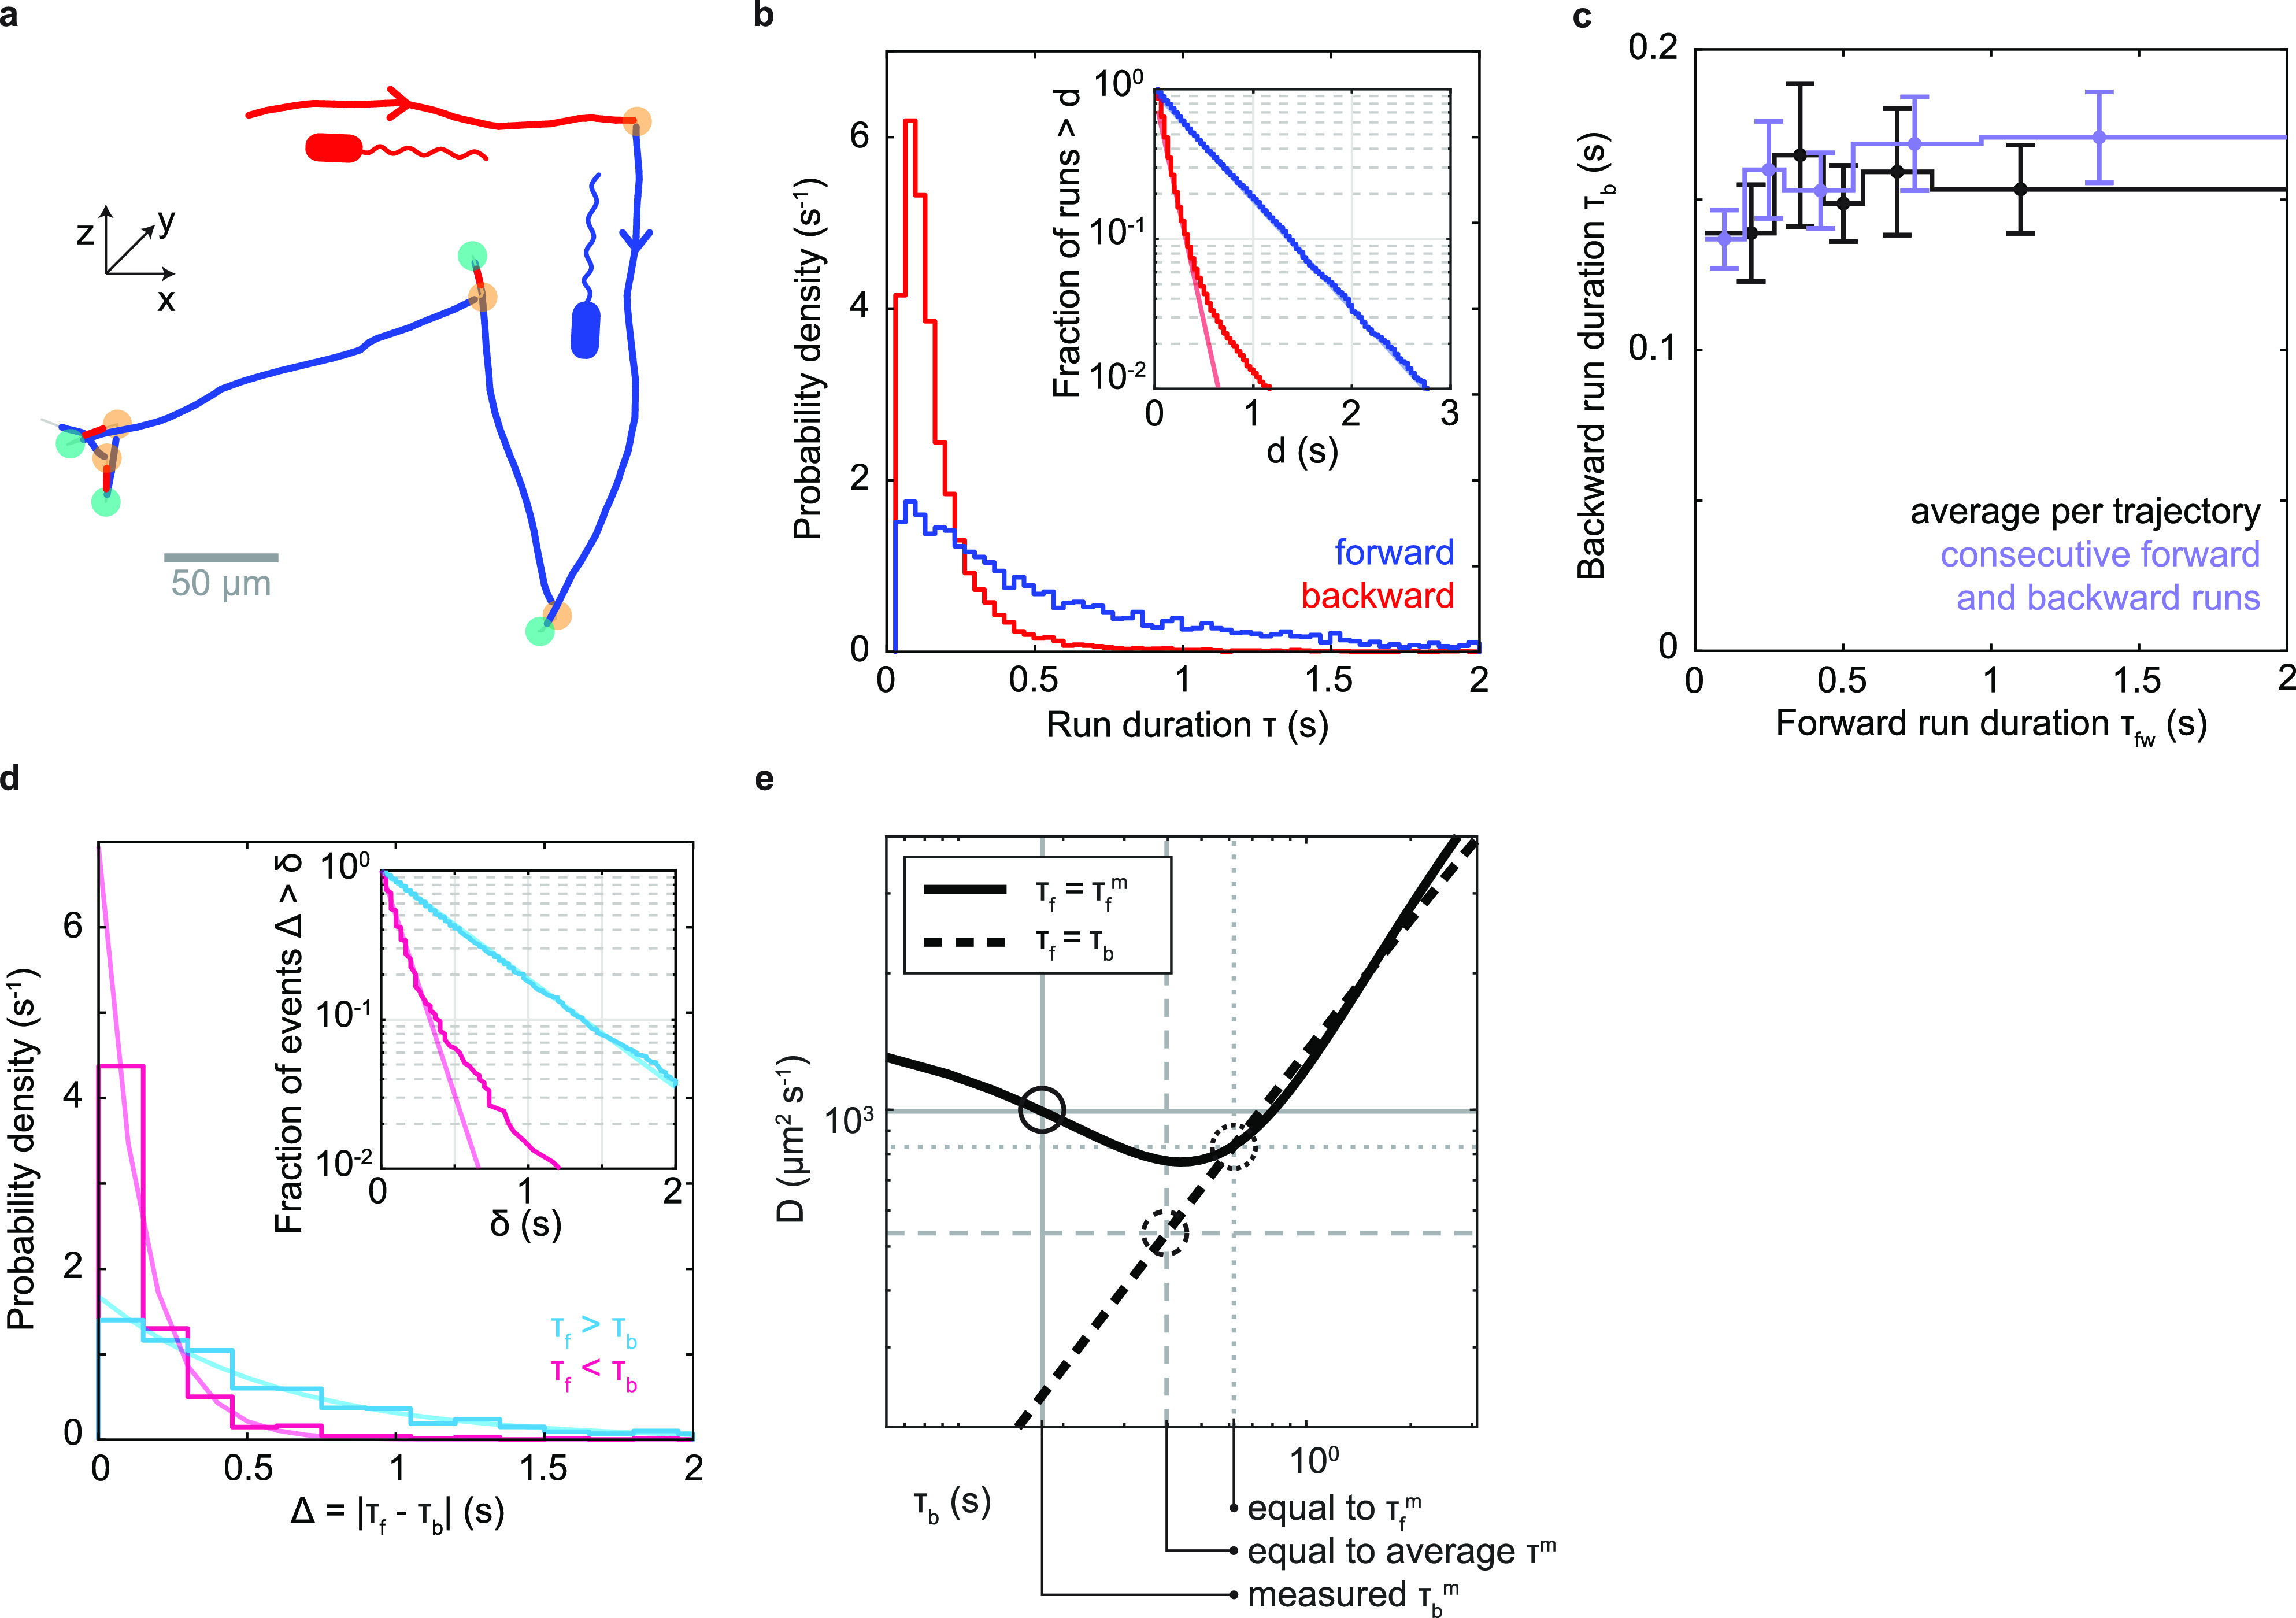
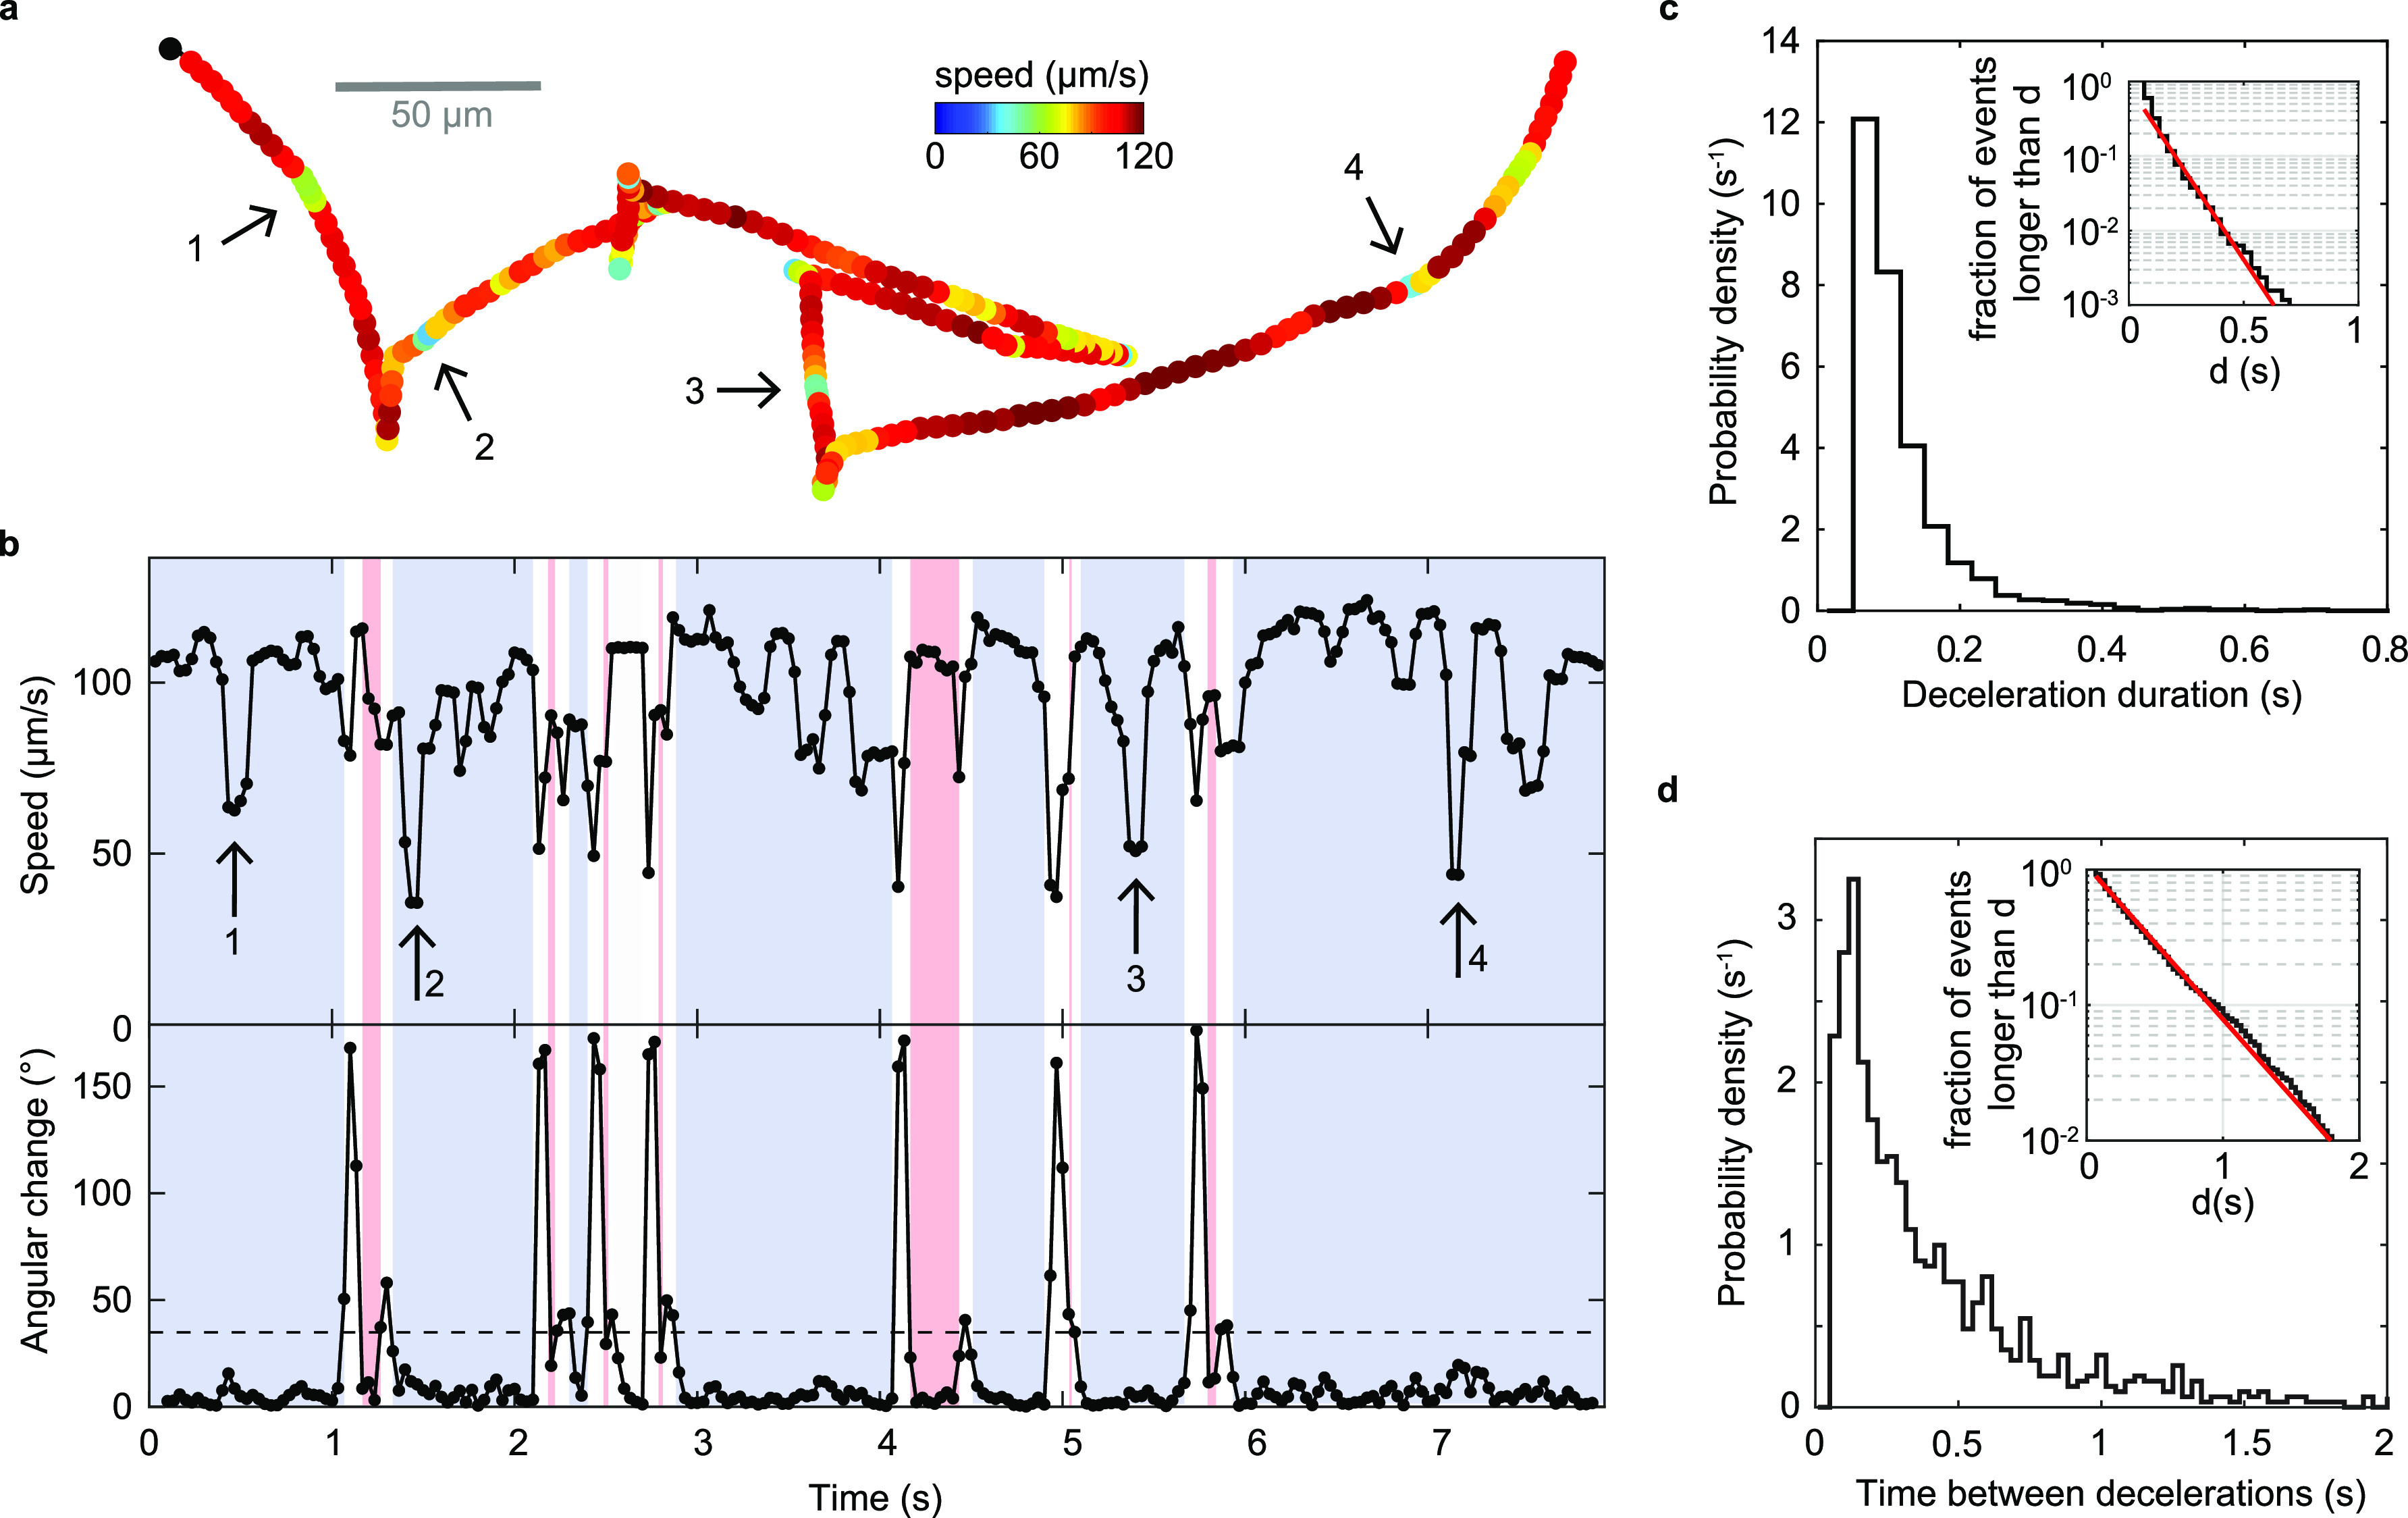
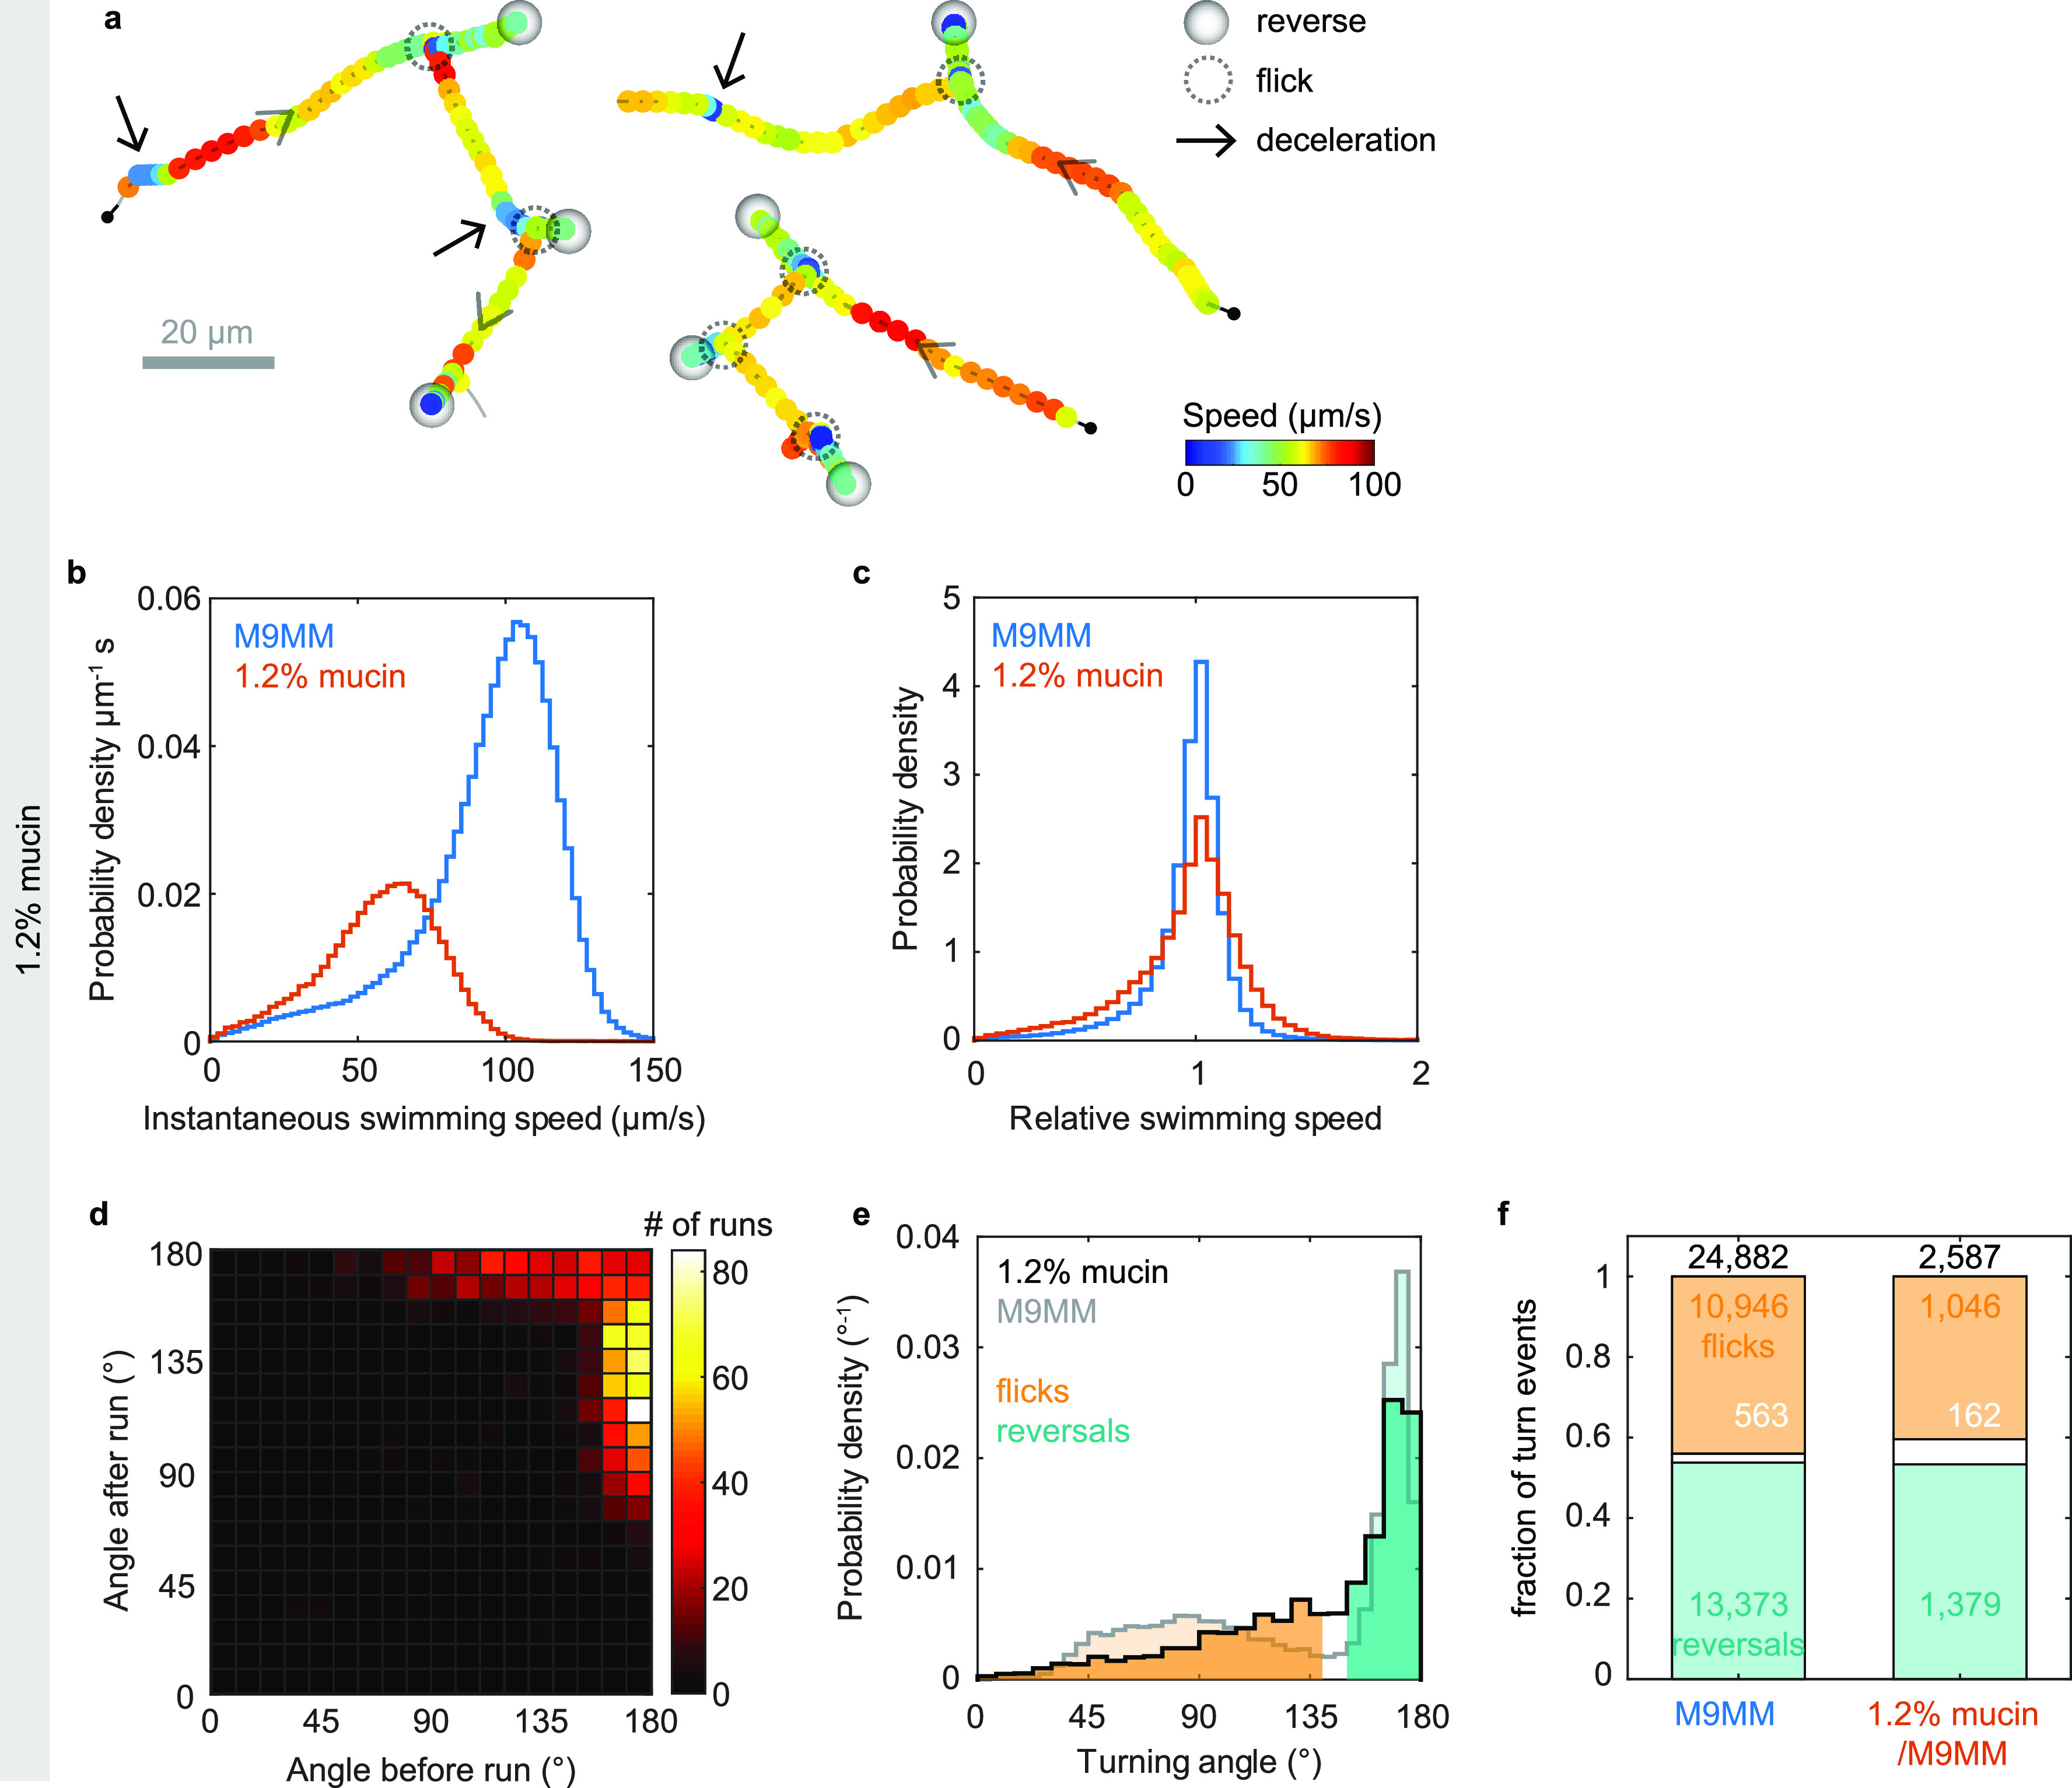
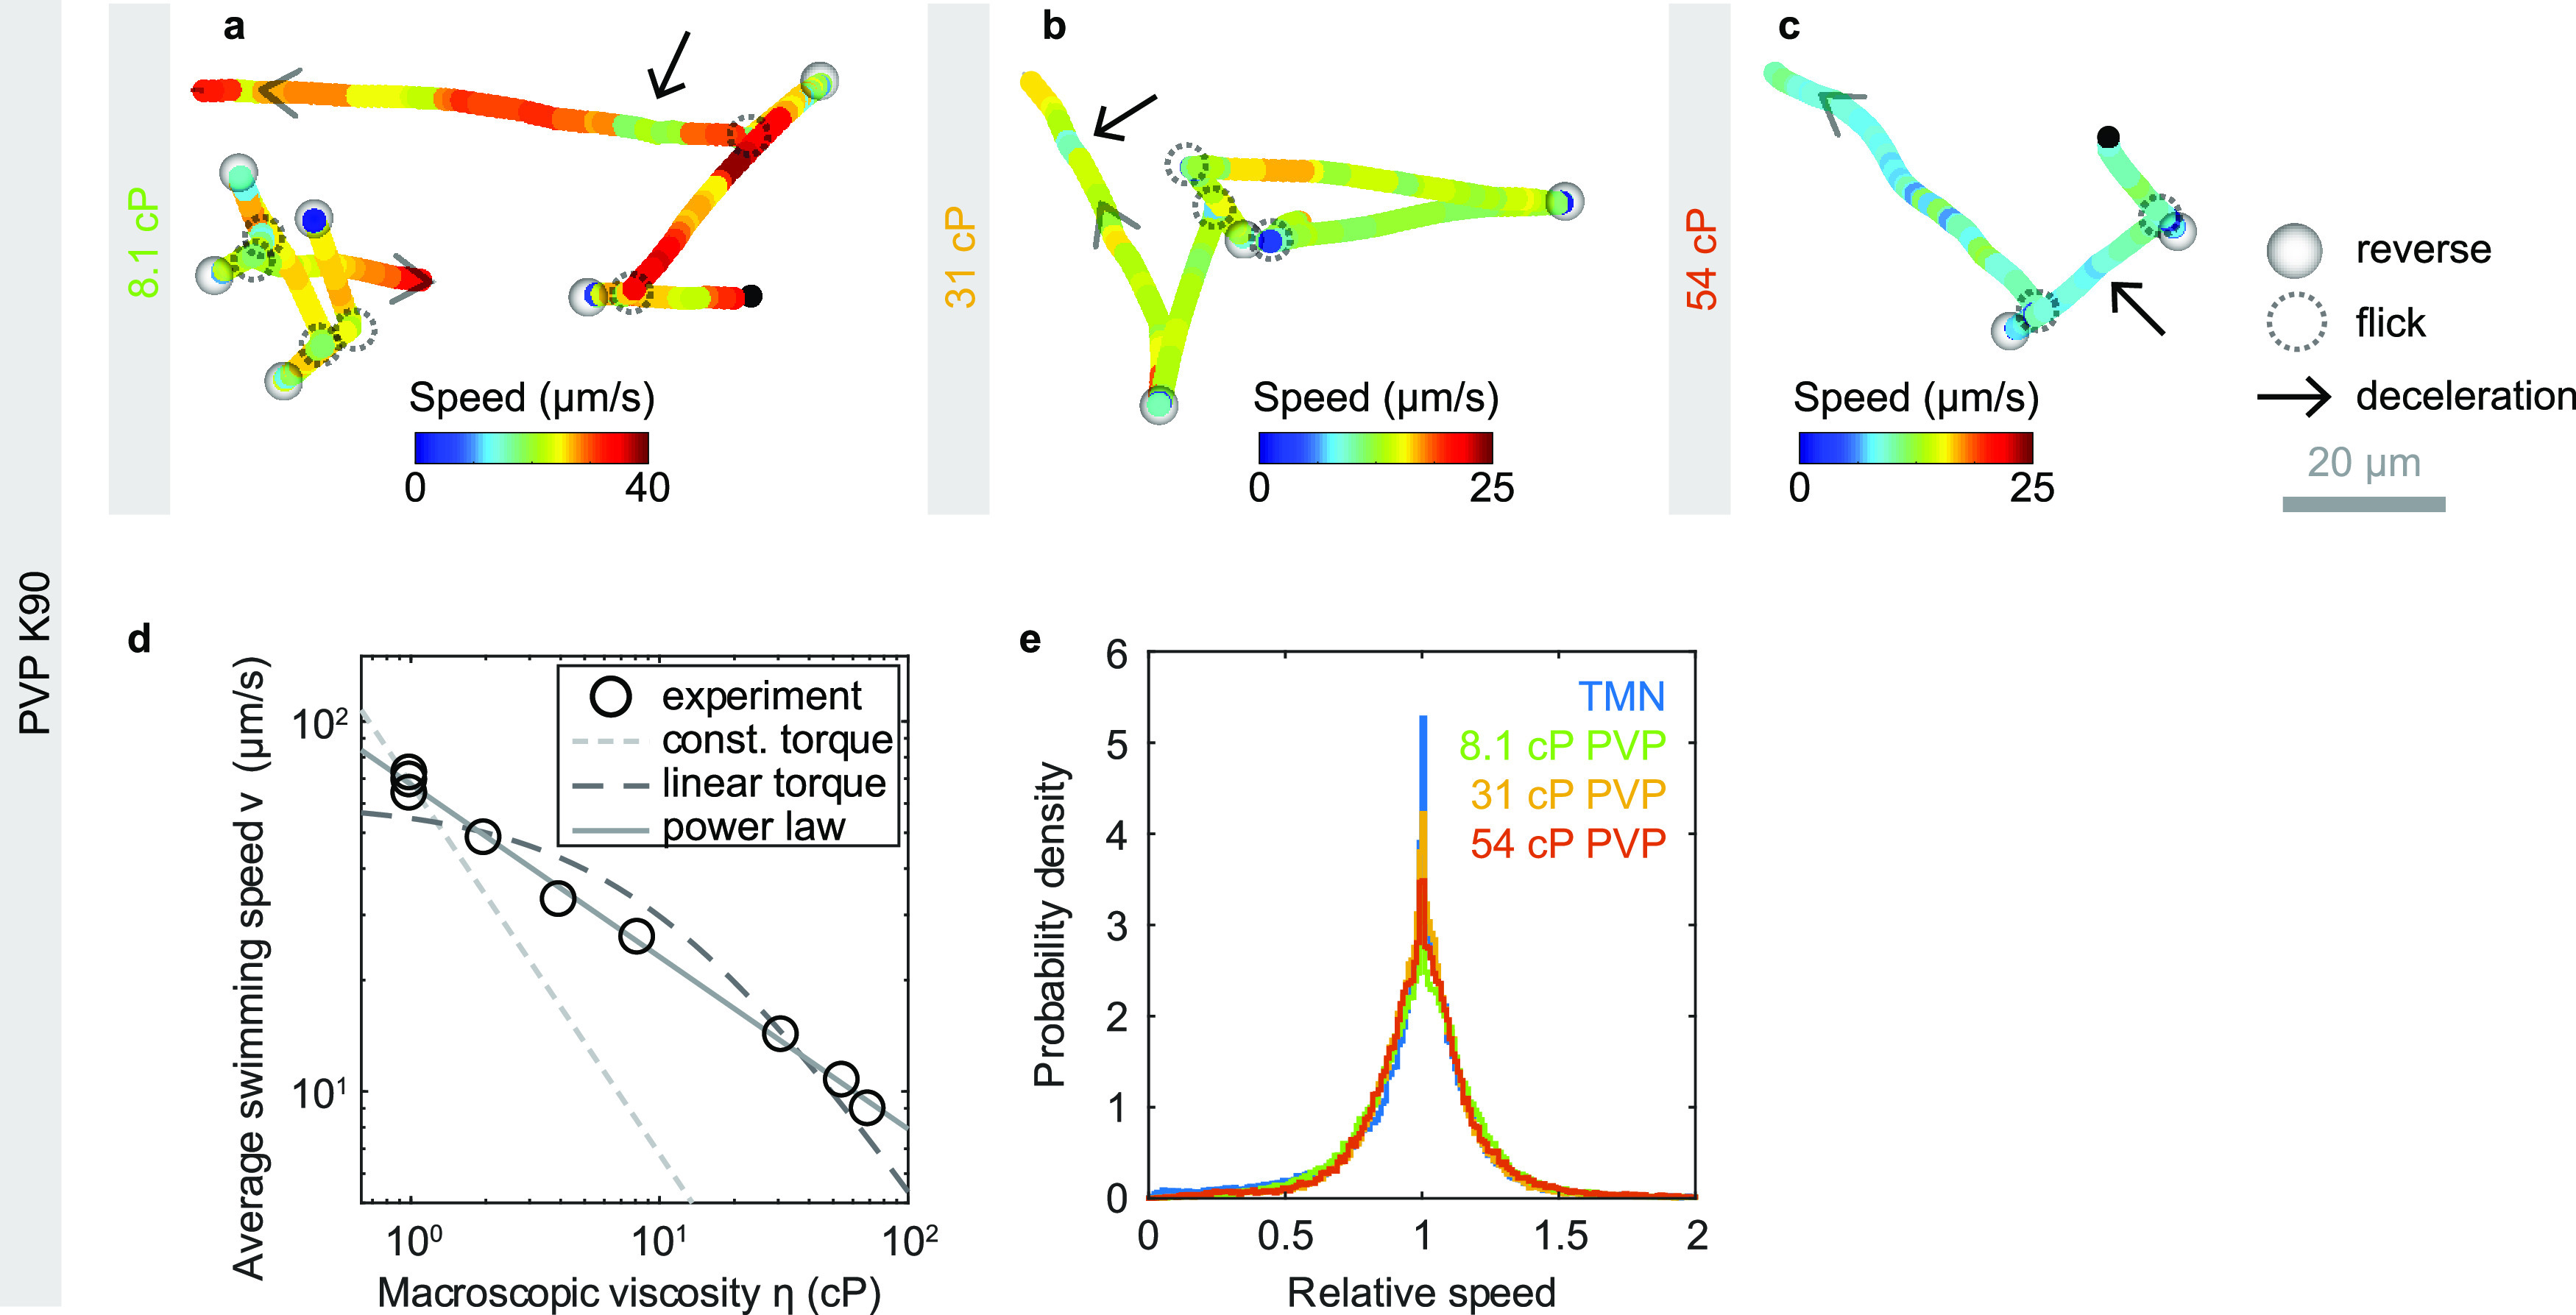
Cholera disease is caused by Vibrio cholerae infecting the lining of the small intestine and results in severe diarrhea. V. cholerae's swimming motility is known to play a crucial role in pathogenicity and may aid the bacteria in crossing the intestinal mucus barrier to reach sites of infection, but the exact mechanisms are unknown. The cell can be either pushed or pulled by its single polar flagellum, but there is no consensus on the resulting repertoire of motility behaviors. We use high-throughput three-dimensional (3D) bacterial tracking to observe V. cholerae swimming in buffer, in viscous solutions of the synthetic polymer PVP, and in mucin solutions that may mimic the host environment. We perform a statistical characterization of its motility behavior on the basis of large 3D trajectory data sets. We find that V. cholerae performs asymmetric run-reverse-flick motility, consisting of a sequence of a forward run, reversal, and a shorter backward run, followed by a turn by approximately 90°, called a flick, preceding the next forward run. Unlike many run-reverse-flick swimmers, V. cholerae's backward runs are much shorter than its forward runs, resulting in an increased effective diffusivity. We also find that the swimming speed is not constant but subject to frequent decreases. The turning frequency in mucin matches that observed in buffer. Run-reverse-flick motility and speed fluctuations are present in all environments studied, suggesting that these behaviors also occur in natural aquatic habitats as well as the host environment. IMPORTANCE Cholera disease produces vomiting and severe diarrhea and causes approximately 100,000 deaths per year worldwide. The disease is caused by the bacterium Vibrio cholerae colonizing the lining of the small intestine. V. cholerae's ability to swim is known to increase its infectivity, but the underlying mechanisms are not known. One possibility is that swimming aids in crossing the protective mucus barrier that covers the lining of the small intestine. Our work characterizing how V. cholerae swims in environments that mimic properties of the host environment may advance the understanding of how motility contributes to infection.

Keywords: Vibrio cholerae; flagellar motility; mucin.


Figures

FIG 1
FIG 1
V. cholerae 3D motility characterization. (a) 3D trajectories obtained from one 100-s-long video recording. (b) Probability distribution of average individual swimming speeds of the full population (black) and of the analyzed population (blue), weighted by trajectory duration, as well as instantaneous swimming speeds for analyzed population (red). The analyzed population consists of trajectories with an average speed larger than 20 μm/s (marked by dashed line) and a minimal duration of 1 s. (c) Example trajectory with color reflecting swimming speed. The arrow marks the trajectory start. (d) Distribution of turning angles and classification of turn events. Turns by less than 140° are considered flicks, and those by more than 150° are considered reversals. Flick and reversal angles have magnitudes of 88° ± 26° (mean ± SD) and 169° ± 6°, respectively. (e) Turn event identification in the trajectory from panel c reveals alternating flicks (orange) and reversals (teal). (f) Bivariate histogram of consecutive turning angles observed after versus before the same run. Reversals can be preceded and followed by reversals or flicks, but two flicks never occur in a row.
FIG 2
FIG 2
V. cholerae flicking probability depends on the sodium motive force. Bivariate histograms of consecutive turning angles for sodium concentrations of 136 mM (a), 7.4 mM (b), and 1.8 mM (c), with respective average swimming speeds of 92, 37, and 23 μm/s. The sodium concentration for Fig. 1f is 181 mM, and the average swimming speed is 94 μm/s.
FIG 3
FIG 3
Run characterization. (a) Example trajectory from Fig. 1c with runs identified as forward (blue) or backward (red) based on the identity of the bordering turning events (orange, flicks; teal, reversals). (b) Run duration distributions. Average durations of backward (red) and forward (blue) runs are 0.174 ± 0.002 s (mean ± SE) and 0.62 ± 0.01 s, respectively. (Inset) Fraction of runs that are longer than a threshold, d, as a function of d. Line fits in log-linear space to the ranges of 0.1 to 1.5 s and 0.067 to 0.4 s yield exponential decay time scales of 0.60 s and 0.14 s for forward and backward runs, respectively. The tail of the backward run duration distribution likely represents misidentified forward runs. (c) Relationship between backward and forward run duration. Purple, average duration of backward runs as a function of the preceding forward run’s duration; black, average duration of backward runs as a function of average duration of forward runs for trajectories containing at least 4 runs of known orientation. (d) Distribution of the absolute differences in duration between a forward run and the subsequent backward run, shown in cyan (magenta) when the forward run is longer (shorter) than the backward. (Inset) Fraction of events that are longer than a threshold, x, as a function of x. Partially transparent lines indicate exponential decay fits. For positive differences (cyan), a maximum likelihood fit of an exponential distribution yields an exponential decay time of 0.60 s. For negative differences (magenta), the slope of a line fit in semilog space in the range of 0 to 0.8 s yields a decay time of 0.14 s. We attribute the tail of the distribution for negative differences to misidentified forward runs, as in panel b. (e) Predicted effective diffusion coefficient for run-reverse-flick motility as a function of the average backward run duration, τb, based on results of Taktikos et al. (26) (see Note S1 for details). The black solid line indicates a fixed forward run duration equal to the measured value, τf = τfm = 0.62 s, and the black dashed line indicates equal forward and backward run durations. Gray dashed lines mark a scenario where both forward and backward run durations are equal to the average measured run duration. Gray dotted lines mark the scenario where both equal the measured forward run duration. Gray solid lines indicate the measured scenario of τfm = 0.62 s and τbm = 0.174 s.
FIG 4
FIG 4
Deceleration events. (a) Example trajectory with visually apparent segments of decreased speed marked by arrows. (b) Time series of swimming speed (top) and angular change in swimming direction between consecutive frames (bottom) for the trajectory shown in panel a. Blue segments represent forward swimming, red segments backward swimming. (c) Distribution of durations of deceleration events. The average duration is 0.12 s. (Inset) Fraction of events longer than a threshold, d, as a function of d. The slope of a linear fit (red) in semilog space yields an exponential decay time of 0.094 s. (d) Distribution of time between two consecutive decelerations. The average is 0.41 s. (Inset) Fraction of events longer than a threshold, d, as a function of d. The slope of a linear fit (red) in the range of 0.16 to 2 s in semilog space yields an exponential decay time constant of 0.38 s.
FIG 5
FIG 5
Run-reverse-flick motility in solutions of 1.2% mucin in M9MM. (a) Three example trajectories in 1.2% mucin, with marked reverse, flick, and deceleration events. (b) Distribution of instantaneous swimming speeds observed in the presence (red) and absence (blue) of mucin. The average speeds are 57 μm/s in mucin and 94 μm/s in M9MM. (c) Distribution of relative swimming speeds in the presence (red) and absence (blue) of mucin. The relative speed is the instantaneous swimming speed divided by the individual’s median swimming speed. (d) Bivariate histogram of consecutive turning angles in 1.2% mucin also displays alternating flicks and reversals as well as consecutive reversals, consistent with run-reverse-flick motility. (e) Distribution of turning angles and classification of turn events for trajectories in M9MM (gray; reproduced from Fig. 1d) and in mucin (black). The average flick angle is 88° ± 26° (mean ± SD) in M9MM and 97° ± 33° in 1.2% mucin/M9MM. The average reversal angle is 169° ± 6° in M9MM and 168 ± 7° in mucin. (f) Fraction of turn events classified as flicks (orange), reversals (teal), or unidentified (white) in the absence and presence of 1.2% mucin. Turns of an angle up to 140° are considered flicks, those above 150° are reversals, and those in between 140° and 150° are considered unidentified. Absolute numbers of events for each category are given.
FIG 6
FIG 6
Run-reverse-flick motility in PVP K90 solutions. (a to c) Example trajectories showing run-reverse-flick motility and variations in swimming speed at concentrations of 2.2%, 4.5%, and 6% PVP K90 in TMN. (d) Average swimming speed as a function of macroscopic PVP K90 viscosity. The dashed and dotted lines represent two different motor torque models under the assumption of Newtonian fluid behavior. The light gray, dotted line indicates a η−1 dependence, corresponding to a constant motor torque. The darker dashed line is a fit of the dependence v = a/(η + b) that is expected for a linear torque-speed relationship (40). Parameters a = 588 μm cP s−1 and b = 9.7 cP yield the best error-weighted fit when a fixed relative measurement error in swimming speed is assumed. The gray solid line represents a power law fit with dependence η−0.46. (e) Distribution of relative swimming speeds for different PVP concentrations, reflecting constant variability of swimming speeds. The relative speed is the instantaneous swimming speed divided by the individual’s median swimming speed.

References

    1. Almagro-Moreno S, Pruss K, Taylor RK. 2015. Intestinal colonization dynamics of Vibrio cholerae. PLoS Pathog 11:e1004787-11. 10.1371/journal.ppat.1004787. - DOI - PMC - PubMed
    1. Butler SM, Camilli A. 2005. Going against the grain: chemotaxis and infection in Vibrio cholerae. Nat Rev Microbiol 3:611–620. 10.1038/nrmicro1207. - DOI - PMC - PubMed
    1. Butler SM, Nelson EJ, Chowdhury N, Faruque SM, Calderwood SB, Camilli A. 2006. Cholera stool bacteria repress chemotaxis to increase infectivity. Mol Microbiol 60:417–426. 10.1111/j.1365-2958.2006.05096.x. - DOI - PMC - PubMed
    1. Lee SH, Butler SM, Camilli A. 2001. Selection for in vivo regulators of bacterial virulence. Proc Natl Acad Sci USA 98:6889–6894. 10.1073/pnas.111581598. - DOI - PMC - PubMed
    1. Silva AJ, Leitch GJ, Camilli A, Benitez JA. 2006. Contribution of hemagglutinin/protease and motility to the pathogenesis of El Tor biotype cholera. Infect Immun 74:2072–2079. 10.1128/IAI.74.4.2072-2079.2006. - DOI - PMC - PubMed

Publication types

LinkOut - more resources