. 2021 Aug 4;16(8):e0254760.
doi: 10.1371/journal.pone.0254760. eCollection 2021.

Petrological and geochemical characterisation of the sarsen stones at Stonehenge

Affiliations

Petrological and geochemical characterisation of the sarsen stones at Stonehenge

David J Nash et al. PLoS One. .

Abstract

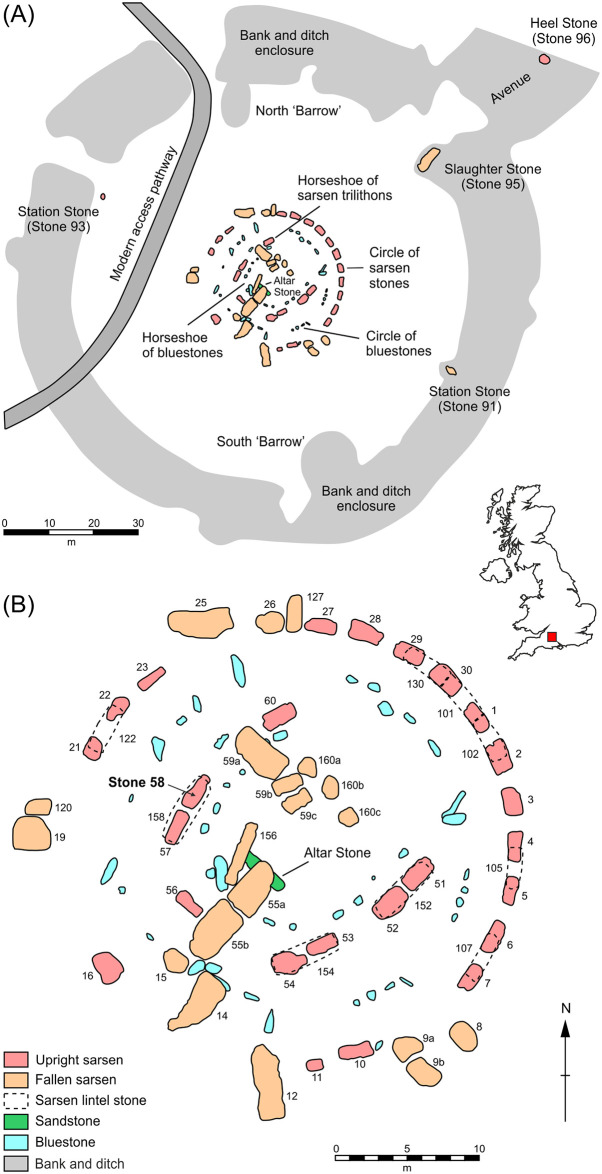
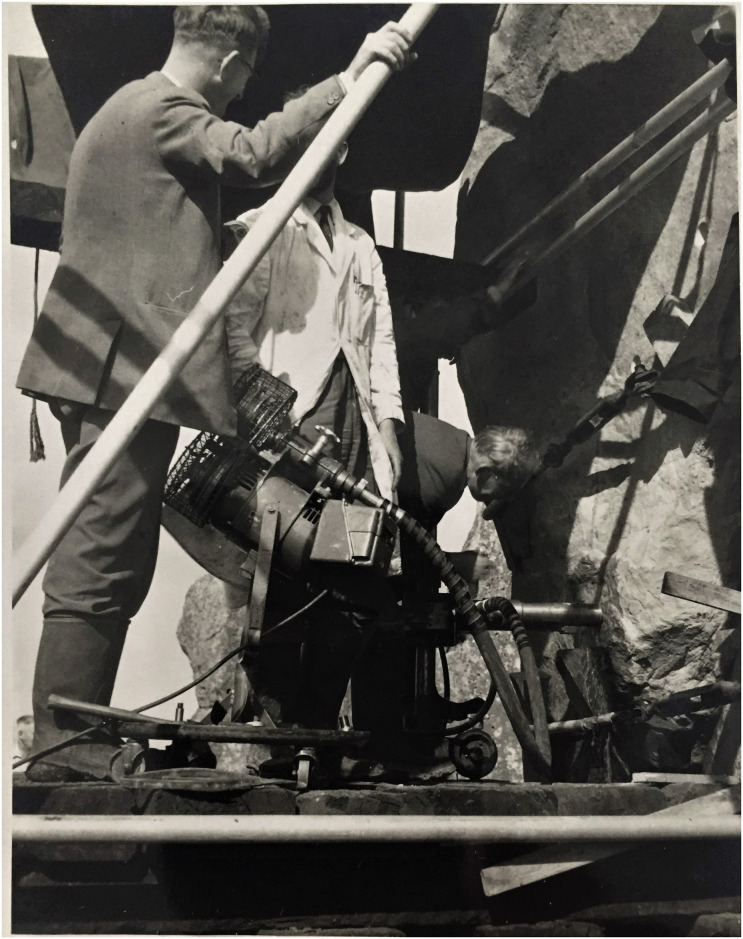
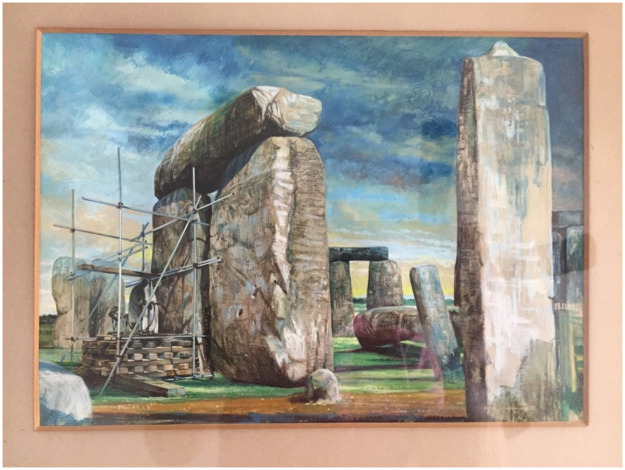
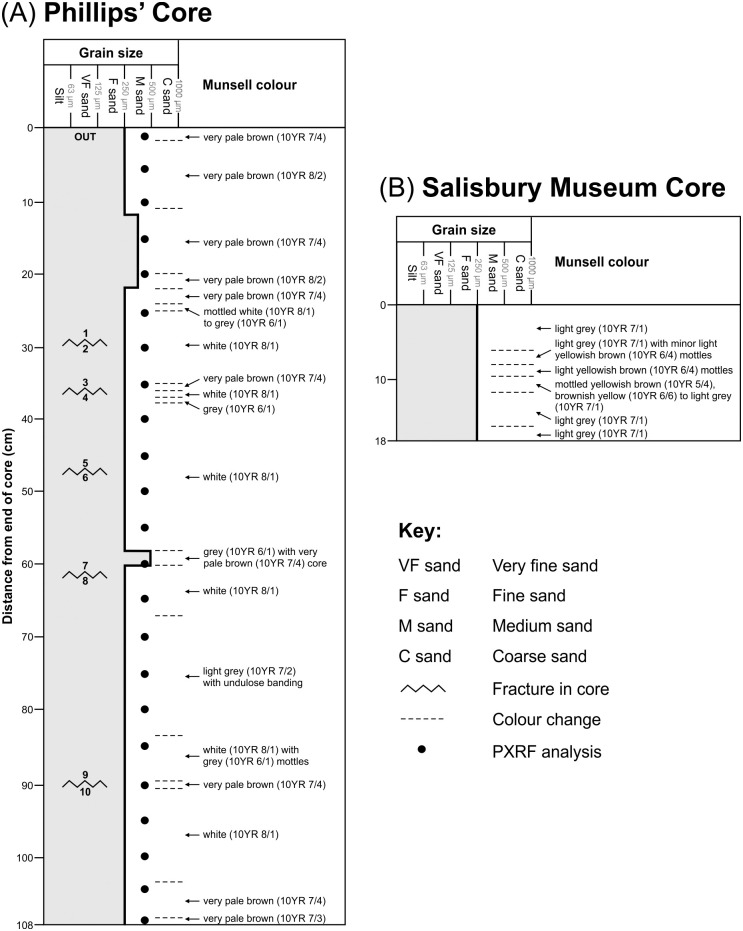
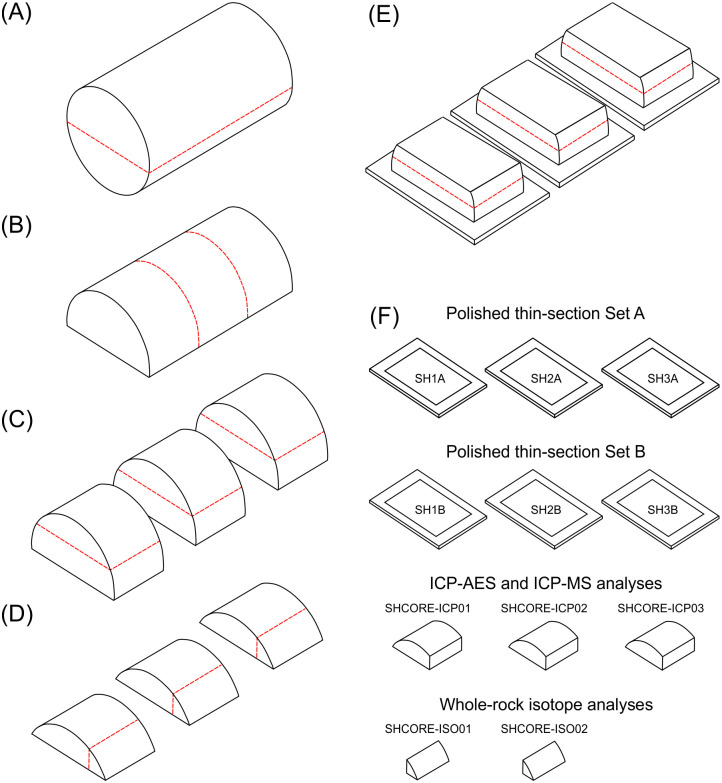
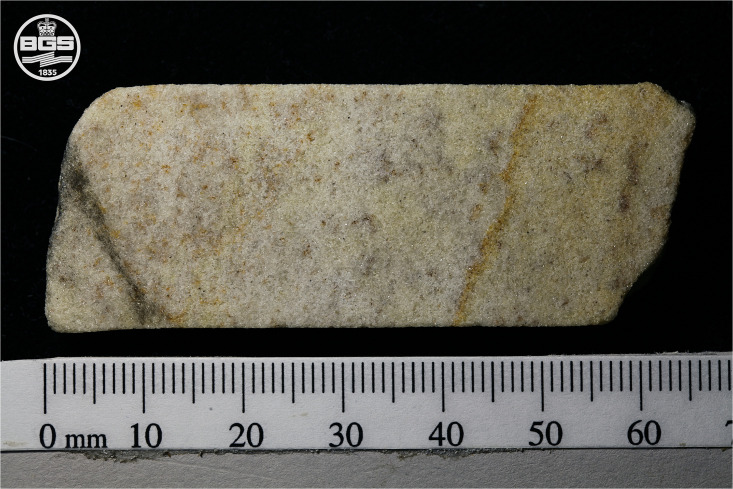
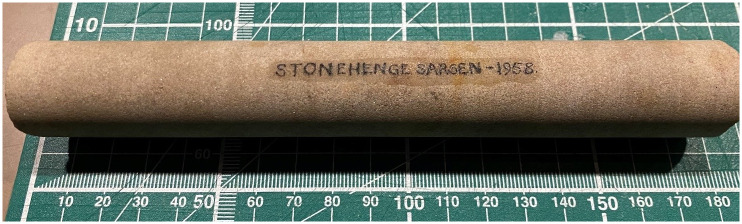
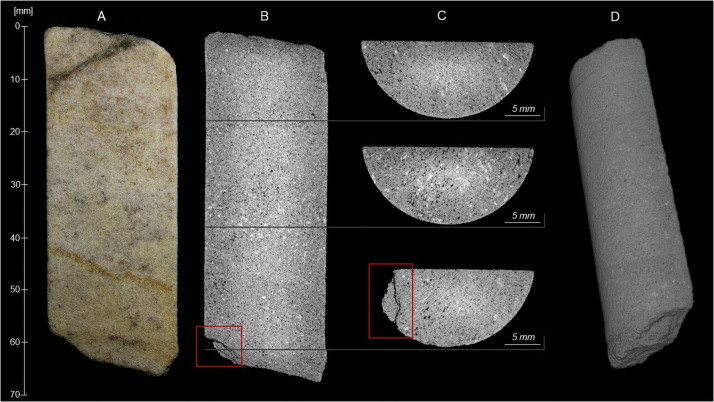
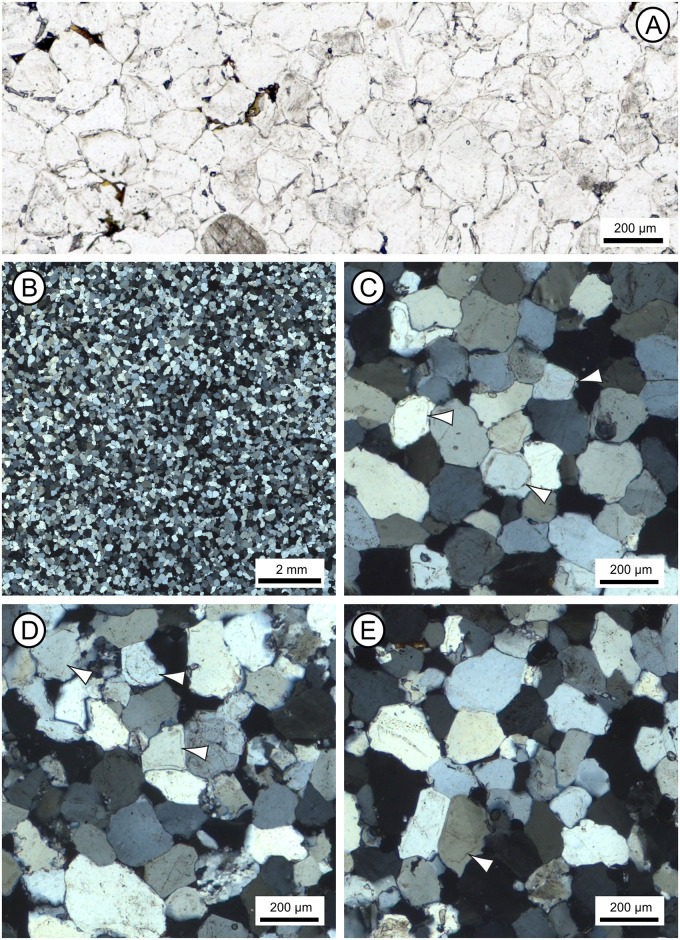
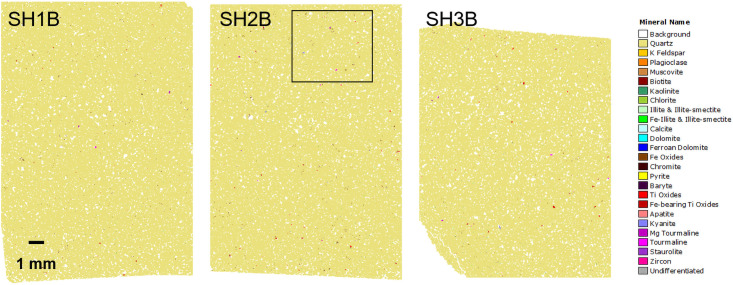
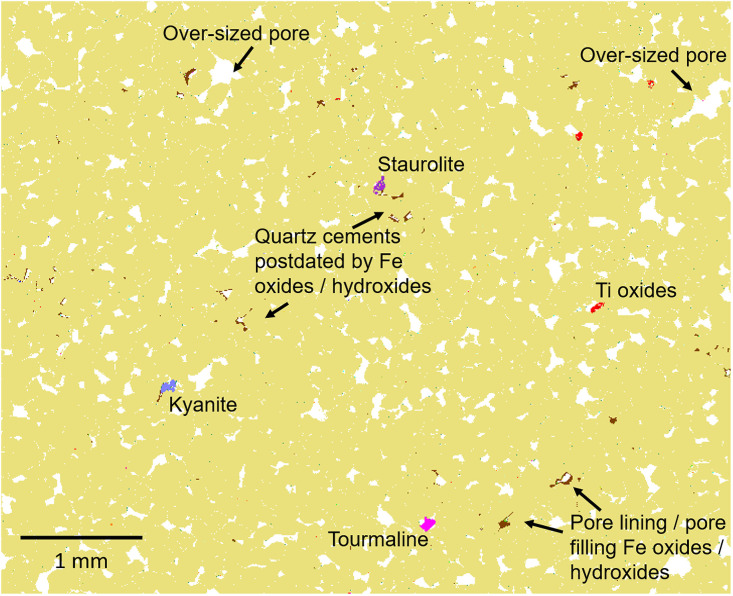
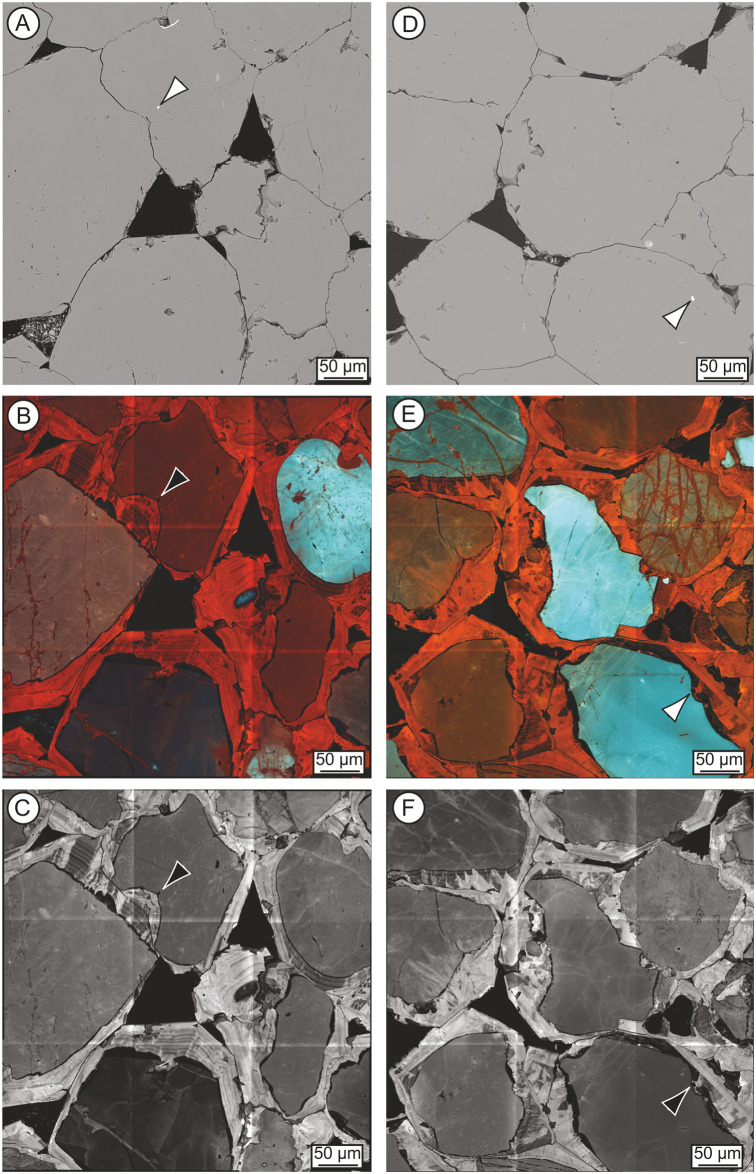
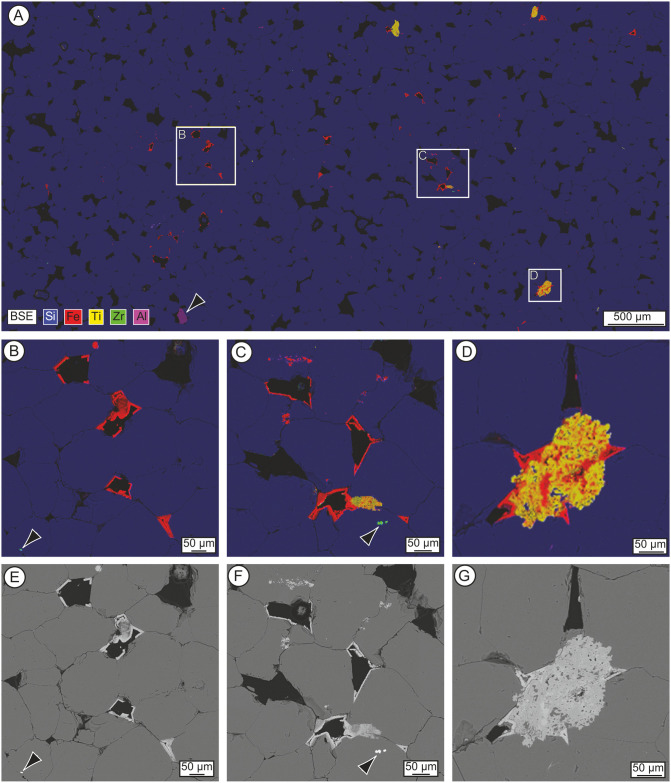
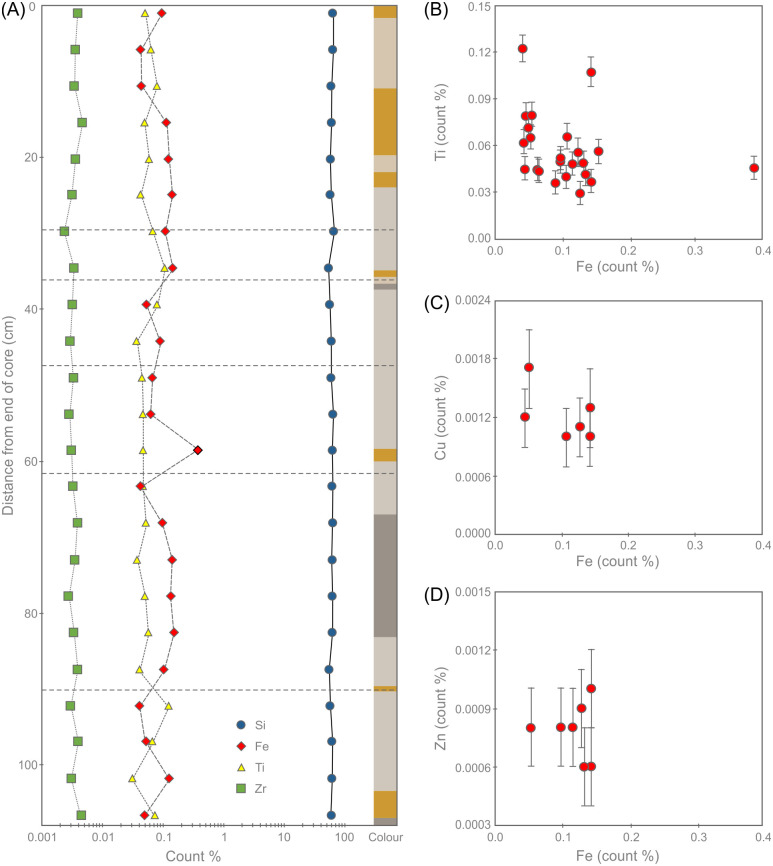
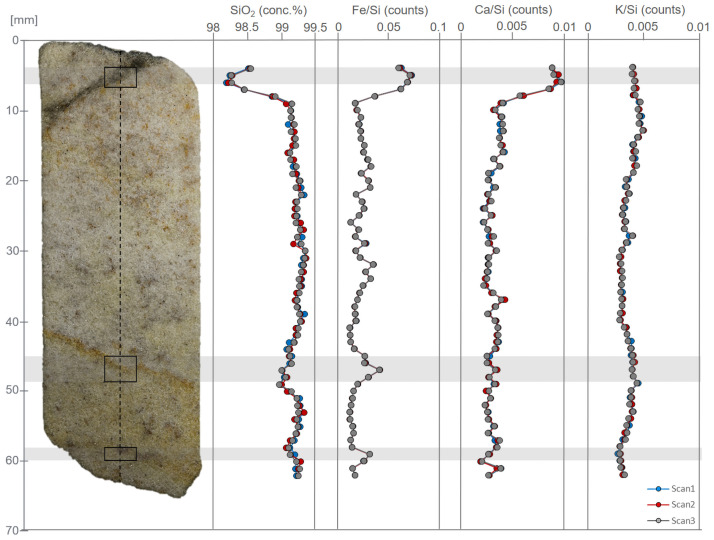
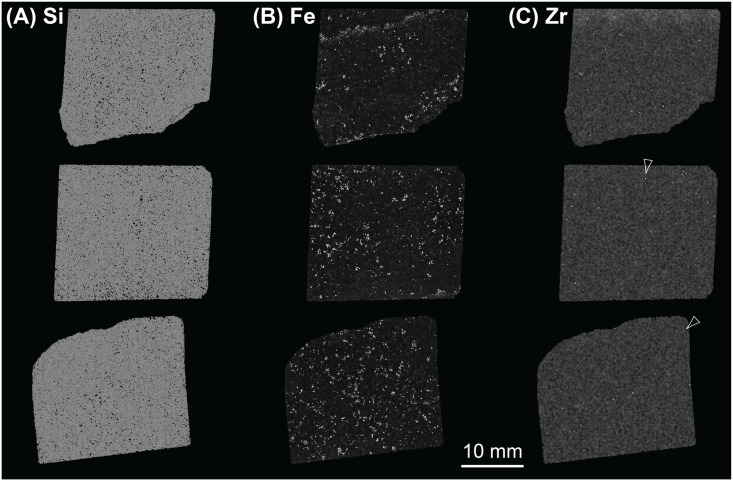
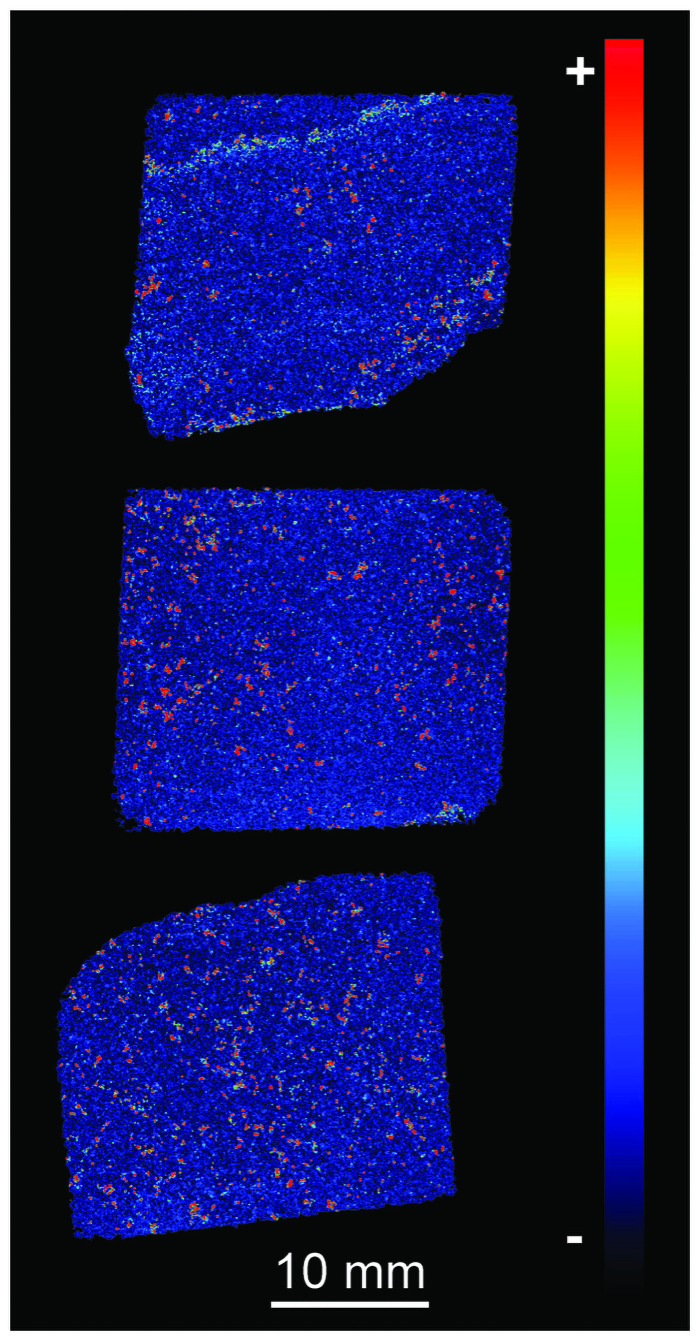
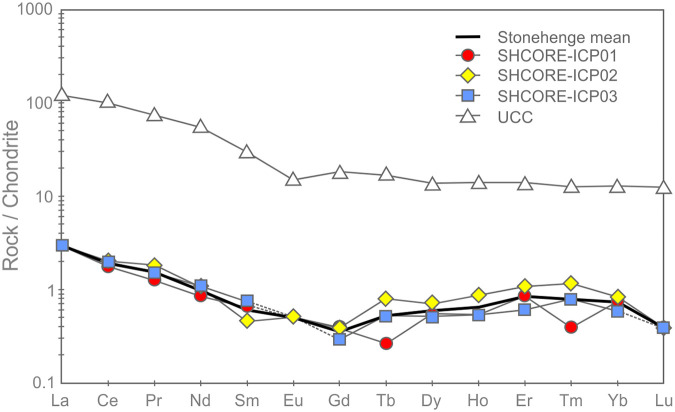
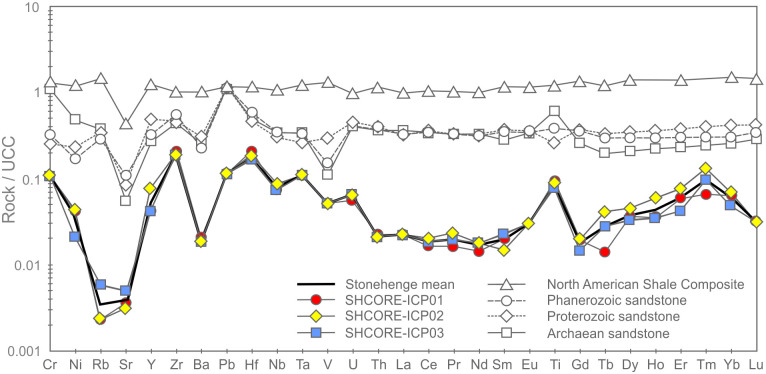
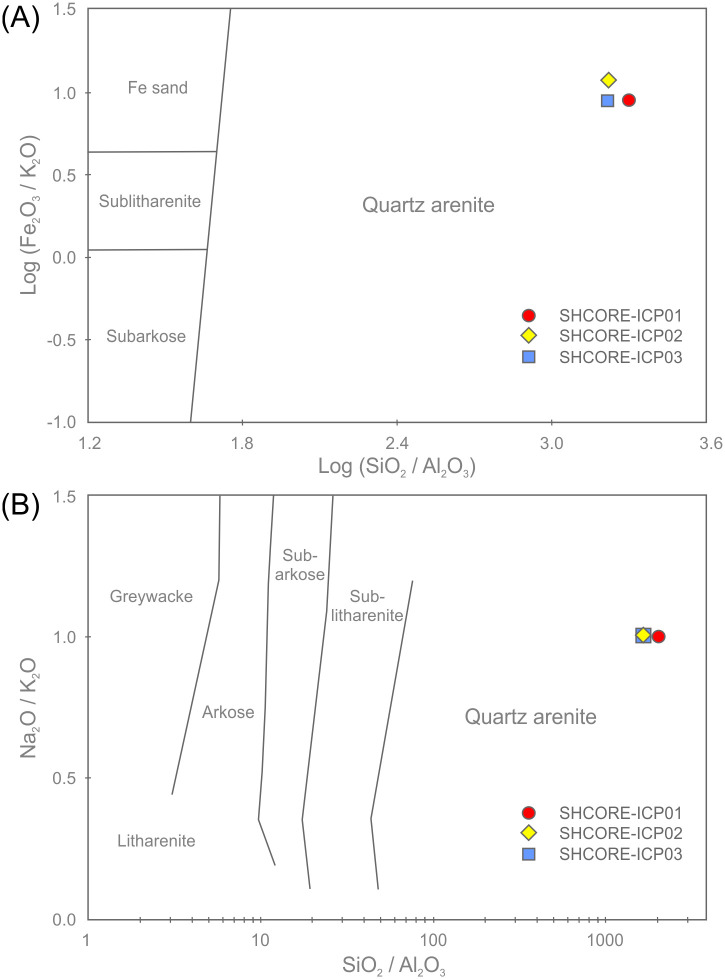
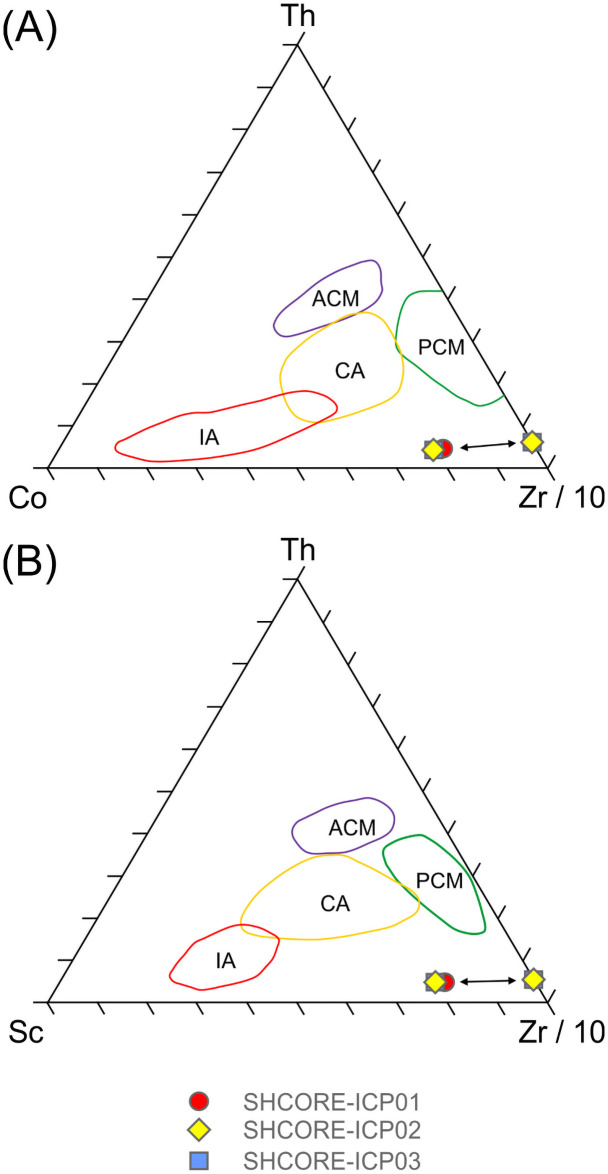
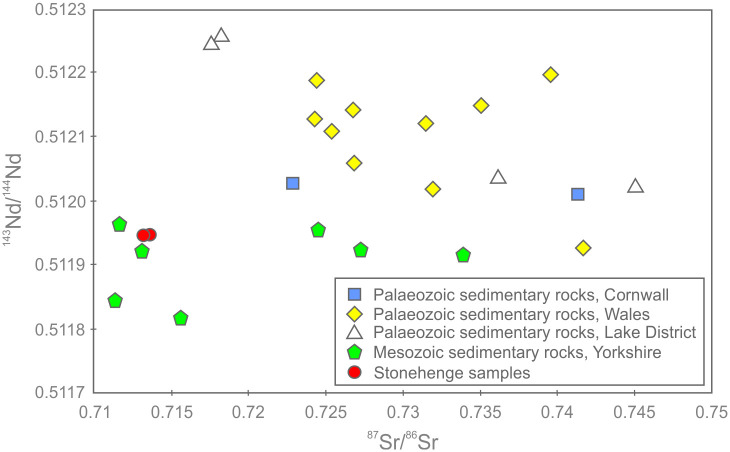
Little is known of the properties of the sarsen stones (or silcretes) that comprise the main architecture of Stonehenge. The only studies of rock struck from the monument date from the 19th century, while 20th century investigations have focussed on excavated debris without demonstrating a link to specific megaliths. Here, we present the first comprehensive analysis of sarsen samples taken directly from a Stonehenge megalith (Stone 58, in the centrally placed trilithon horseshoe). We apply state-of-the-art petrographic, mineralogical and geochemical techniques to two cores drilled from the stone during conservation work in 1958. Petrographic analyses demonstrate that Stone 58 is a highly indurated, grain-supported, structureless and texturally mature groundwater silcrete, comprising fine-to-medium grained quartz sand cemented by optically-continuous syntaxial quartz overgrowths. In addition to detrital quartz, trace quantities of silica-rich rock fragments, Fe-oxides/hydroxides and other minerals are present. Cathodoluminescence analyses show that the quartz cement developed as an initial <10 μm thick zone of non-luminescing quartz followed by ~16 separate quartz cement growth zones. Late-stage Fe-oxides/hydroxides and Ti-oxides line and/or infill some pores. Automated mineralogical analyses indicate that the sarsen preserves 7.2 to 9.2 area % porosity as a moderately-connected intergranular network. Geochemical data show that the sarsen is chemically pure, comprising 99.7 wt. % SiO2. The major and trace element chemistry is highly consistent within the stone, with the only magnitude variations being observed in Fe content. Non-quartz accessory minerals within the silcrete host sediments impart a trace element signature distinct from standard sedimentary and other crustal materials. 143Nd/144Nd isotope analyses suggest that these host sediments were likely derived from eroded Mesozoic rocks, and that these Mesozoic rocks incorporated much older Mesoproterozoic material. The chemistry of Stone 58 has been identified recently as representative of 50 of the 52 remaining sarsens at Stonehenge. These results are therefore representative of the main stone type used to build what is arguably the most important Late Neolithic monument in Europe.


Conflict of interest statement

Three of the authors (JMH, MRP and NW) are employed by commercial companies (Petroclays Ltd, Vidence Inc. and Gatan UK, respectively). This does not alter our adherence to PLOS ONE policies on sharing data and materials.

Figures

Fig 1
Fig 1. Plans of Stonehenge showing (A) the area of the monument enclosed by earthworks and (B) detail of the stone circle.
Sarsen stones are numbered following the system devised by W.M. Flinders Petrie in the late 19th century [6].
Fig 2
Fig 2. Drilling work on Stone 58 at Stonehenge by Van Moppes Ltd in August 1958, with Mr Robert Phillips pictured left.
Permission was obtained from Mr Lewis Phillips for the image of his late father to appear in this picture and for him to be identified by name. This image is reproduced under a CC BY 4.0 license, with permission from Lewis Phillips, original copyright (2020).
Fig 3
Fig 3. Watercolour painting commissioned by Messrs.
L.M. Van Moppes (Diamond Tools) Ltd., now in the possession of the Phillips family, showing coring operations on Stone 58 of Stonehenge in 1958. This image is reproduced under a CC BY 4.0 license, with permission from Lewis Phillips, original copyright (2018).
Fig 4
Fig 4. Lewis (left) and Robin Phillips (right) at Stonehenge, handing over the ‘Phillips’ Core’ from Stone 58 to Senior Property Curator, Stonehenge, Heather Sebire (pictured pointing at the position from which the core was drilled.
Permission was obtained from the individuals pictured to appear in this image and to be identified by name. This image is reproduced under a CC BY 4.0 license, with permission from English Heritage, original copyright (2018).
Fig 5
Fig 5. Sedimentary logs of (A) the Phillips’ Core and (B) Salisbury Museum Core from Stone 58 at Stonehenge.
Grain size and Munsell colour are plotted with distance from the end of each core. Letter and numbers shown at the end of each section of the Phillips’ Core (i.e. OUT to 10) are those written with marker pen on the original core (see text). Section 2–3 of the Phillips’ Core from 29–36 cm was subject to further detailed petrographical, mineralogical and geochemical analyses.
Fig 6
Fig 6. Schematic representation showing how the 67 mm long section 2–3 of the Phillips’ Core from Stone 58 at Stonehenge was (A) cut (dashed lines) and prepared (B-E) in order to produce two sets of three polished thin sections, three samples for whole-rock major and trace element analysis, and two samples for whole-rock isotopic analysis (F).
See text for full description.
Fig 7
Fig 7. Image of section 2–3 of the Phillips’ Core from Stone 58 at Stonehenge.
The right-hand end of the core segment represents a natural fracture in the original sarsen, with the thin band of iron hydroxide staining running diagonally from ~40 to ~50 mm mirroring the fracture surface. The left-hand end of the core represents a break developed either during or after drilling. The grey diagonal band running from ~10 to ~0 mm is residual metal from the diamond saw blade smeared onto the surface of the sarsen during cutting. This image is reproduced under a CC BY 4.0 license, with permission from British Geological Survey, original copyright (2019).
Fig 8
Fig 8. The Salisbury Museum Core from Stone 58 at Stonehenge.
This image is reproduced under a CC BY 4.0 license, with permission from David J. Nash, original copyright (2020).
Fig 9
Fig 9. Optical (A) and Computed Tomography (B-C) images of section 2–3 of the Phillips’ Core from Stone 58 at Stonehenge.
Distance along the sample is measured relative to the fracture plane between sections 1 and 2 of the Phillips’ Core (see Fig 5). Dark grey to black tones in the CT images indicate low density areas (e.g. pores, fractures), while light grey to white tones indicate high density areas (e.g. mineral constituents). A 3D reconstruction of sample (D) with full simulation is provided in the S1 Movie. These images are reproduced under a CC BY 4.0 license, with permission from British Geological Survey, original copyright (2019).
Fig 10
Fig 10. Optical images from polished thin-sections taken under plane- (A) and cross-polarised (B-E) light, illustrating the petrography of section 2–3 of the Phillips’ Core from Stone 58 at Stonehenge.
(A) Detail of thin-section SH1B showing the typical sarsen fabric comprising quartz grains cemented by quartz overgrowths, with late-stage Fe-Ti minerals lining and/or infilling some void spaces. (B) Overview of thin-section SH2B showing the pervasive nature and uniformity of syntaxial optically-continuous quartz overgrowth cements. (C-E) Details of thin-sections SH1B (C), SH2B (D) and SH3B (E), showing host quartz grains, some of which enclose accessory minerals; dust lines (arrowed) mark the margin between some quartz grains and the quartz overgrowth cement in images C-E. These images are reproduced under a CC BY 4.0 license, with permission from The Trustees of the Natural History Museum, original copyright (2019).
Fig 11
Fig 11. Automated SEM-EDS (QEMSCAN) mineralogical maps for polished thin-sections SH1B, SH2B and SH3B from section 2–3 of the Phillips’ Core.
The box indicates the location of the higher resolution mineralogical map shown in Fig 12.
Fig 12
Fig 12. Automated SEM-EDS (QEMSCAN) mineralogical map (for area of thin-section SH2B from the Phillips’ Core detailed in Fig 11) highlighting textural features.
Fig 13
Fig 13. Variability in the quartz-rich host sediment and quartz cement within polished thin-sections SH2B (left hand column) and SH1B (right hand column) from the Phillips’ Core.
Back-scattered electron (BSE) images (A, D; 786 nm pixel size) and cathodoluminescence (SEM-CL) images of the same areas (B, E—Red-Green-Blue composite; C, F—red component; 320 nm pixel size). Arrows show ~2–6 μm zircon grains at the contact of a quartz grain and initial layer of non-luminescing quartz cement. These images are reproduced under a CC BY 4.0 license, with permission from The Trustees of the Natural History Museum, original copyright (2019).
Fig 14
Fig 14. Energy-dispersive spectrometry (EDS) net intensity composite elemental maps (A-D) and back-scattered electron (BSE) images (E-G) of polished thin-section SH3B from the Phillips’ Core.
(A) Mosaic EDS map (3.2 μm pixel size) overlain with BSE micrograph (5100 × 2500 pixels, 1.6 μm pixel size). Quartz is represented in blue (Si), iron oxides/hydroxides in red (Fe), titanium oxides in yellow (Ti), zircon in green (Zr) and kyanite (arrow) in magenta (Al). (B-D) Image detail of the rectangles shown in (A). Arrows indicate ~5–10 μm zircon grains. (E-G) BSE images (749 nm pixel size) of the areas shown in (B-D). These images are reproduced under a CC BY 4.0 license, with permission from The Trustees of the Natural History Museum, original copyright (2019).
Fig 15
Fig 15. Portable XRF geochemical data showing (A) the variation in count % of selected elements and indicative Munsell colour along the length of the Phillips’ Core from Stone 58.
Fractures are indicated as dashed lines to allow cross-referencing with Fig 5. Panels (B) to (D) show the correlation between Fe count % and (B) Ti, (C) Cu and (D) Zn. Error bars in B-D indicate instrumental error. Note that the error for Fe is smaller than the symbol diameter so is not displayed.
Fig 16
Fig 16. Optical image and selected XRF data for section 2–3 of the Phillips’ Core from Stone 58 at Stonehenge.
Dashed line indicates path of XRF detector along the central axis length of the sample. Solid boxes indicate areas of interest (see section 4.2.2.). Replicate XRF scans (3×) along the same axis line were performed to ensure consistency of the results. The image and data are reproduced under a CC BY 4.0 license, with permission from the British Geological Survey, original copyright (2019).
Fig 17
Fig 17. Composite showing μXRF elemental maps of thin sections SH1B (bottom row), SH2B (middle row) and SH3B (top row) from the Phillips’ Core (from Stone 58 at Stonehenge) for (A) Si, (B) Fe and (C) Zr.
Note that Zr is present at much lower concentrations than Si and Fe so some background noise is present in panel C—example spots of higher Zr intensity are arrowed.
Fig 18
Fig 18. μXRF heatmap of the relative intensity of Fe in thin sections SH1B (bottom), SH2B (middle) and SH3B (top) from the Phillips’ Core (from Stone 58 at Stonehenge).
Red colours indicate higher and blue colours lower relative Fe concentrations.
Fig 19
Fig 19. Chondrite-normalised REE diagram for the three subsamples from section 2–3 of the Phillips’ Core from Stonehenge (SH) showing the Upper Continental Crust (UCC) for comparison [42].
Concentrations below detection limit are plotted at detection limit and are signified by dashed lines [normalisation factors from 43].
Fig 20
Fig 20. UCC-normalised trace element diagram for the three subsamples from section 2–3 of the Phillips’ Core from Stonehenge showing North American Shale Composite [45] and average compositions of Archean, Proterozoic and Phanerozoic sandstones (SST) [44] for comparison [normalising factors from 42].
Fig 21
Fig 21
Major element classification schemes for the three subsamples from section 2–3 of the Phillips’ Core from Stone 58 at Stonehenge: (A) Log (SiO2 / Al2O3) vs. Log (Fe2O3 / K2O), modified after [53]; (B) SiO2 / Al2O3 vs. Na2O / K2O, modified after [54]. Na2O was below detection limit in SHCORE-ICP02 and K2O was below detection limit in all three samples. For plotting, detection limit values (0.01 wt. %) are used for the affected analyses.
Fig 22
Fig 22. (A) Th-Zr/10-Co and (B) Th-Zr/10-Sc trace element discrimination diagrams for the three subsamples from the Phillips’ Core (Stone 58, Stonehenge).
Co and Sc were below detection limit in all three samples. For plotting, the samples are shown as arrays defined by Sc and Co concentrations at both detection limit (1 ppm) and 0 ppm. Field names: IA—Island Arc; CA—Continental Arc; ACM—Active Continental Margin; PCM—Passive Continental Margin.
Fig 23
Fig 23. Sr and Nd isotope data for the whole-rock samples from the Phillips’ Core at Stonehenge plotted alongside equivalent published data for UK lithologies [data from 63].

References

    1. Nash DJ, Ullyott JS. Silcrete. In: Nash DJ, McLaren SJ, editors. Geochemical Sediments and Landscapes. Oxford: Blackwell; 2007. pp. 95–143.
    1. Ullyott JS, Nash DJ, Shaw PA. Recent advances in silcrete research and their implications for the origin and palaeoenvironmental significance of sarsens. Proceedings of the Geologists’ Association. 1998; 109:255–270.
    1. Parker Pearson M. The sarsen stones of Stonehenge. Proceedings of the Geologists’ Association. 2016; 127:363–369.
    1. Darvill T, Marshall P, Parker Pearson M, Wainwright G. Stonehenge remodelled. Antiquity. 2012; 86:1021–1040.
    1. Nash DJ, Ciborowski TJR, Ullyott JS, Parker Pearson M, Darvill T, Greaney S, et al.. Origins of the sarsen megaliths at Stonehenge. Science Advances [Internet]. 2020; 6: eabc0133. Available from: 10.1126/sciadv.abc0133. - DOI - PMC - PubMed

Publication types