. 2021 Aug 4;16(8):e0255680.
doi: 10.1371/journal.pone.0255680. eCollection 2021.

Impact of essential workers in the context of social distancing for epidemic control

Affiliations

Impact of essential workers in the context of social distancing for epidemic control

William R Milligan et al. PLoS One. .

Abstract

New emerging infectious diseases are identified every year, a subset of which become global pandemics like COVID-19. In the case of COVID-19, many governments have responded to the ongoing pandemic by imposing social policies that restrict contacts outside of the home, resulting in a large fraction of the workforce either working from home or not working. To ensure essential services, however, a substantial number of workers are not subject to these limitations, and maintain many of their pre-intervention contacts. To explore how contacts among such "essential" workers, and between essential workers and the rest of the population, impact disease risk and the effectiveness of pandemic control, we evaluated several mathematical models of essential worker contacts within a standard epidemiology framework. The models were designed to correspond to key characteristics of cashiers, factory employees, and healthcare workers. We find in all three models that essential workers are at substantially elevated risk of infection compared to the rest of the population, as has been documented, and that increasing the numbers of essential workers necessitates the imposition of more stringent controls on contacts among the rest of the population to manage the pandemic. Importantly, however, different archetypes of essential workers differ in both their individual probability of infection and impact on the broader pandemic dynamics, highlighting the need to understand and target intervention for the specific risks faced by different groups of essential workers. These findings, especially in light of the massive human costs of the current COVID-19 pandemic, indicate that contingency plans for future epidemics should account for the impacts of essential workers on disease spread.


Conflict of interest statement

The authors have declared that no competing interests exist.

Figures

Fig 1
Fig 1. Diagram of the SEIR model with extensions.
A) An illustration of the basic SEIR model used in all scenarios, including additional compartments within the infected (outlined in green) and hospitalized (outlined in blue) classes. ‘S’ is susceptible, ‘E’ is exposed, ‘I’ is infected, ‘H’ is hospitalized, ‘D’ is dead, and ‘R’ is recovered. Within the infected class, individuals can be asymptomatic ‘IA’ and destined to recover; symptomatic ‘IR’ but destined to recover; or symptomatic ‘IH’ and destined to be hospitalized. Within the hospital, individuals either go to recovery ‘HR’ or go to critical care ‘Hc’. For those in critical care, individuals either die ‘CD’ or go on to the recovered class ‘CR’, with an additional time spent in the hospital ‘L’. B) To model the impact of EWs, who make up a proportion f of the total population, we created two cloned instances of the SEIR model. Here, for visualization, the infectious and hospitalized classes are collapsed into a single compartment. The β terms represent the transmission routes between infectious individuals within and between essential ‘E’ and non-essential ‘N’ groups. In the model of public-facing EWs (such as cashiers, transportation workers and public safety personnel), SIP reduces contacts (highlighted in red) only among nEWs. C) In the model of non-public-facing EWs (such as factory, warehouse, and agricultural workers), SIP reduces all contacts (highlighted in red) except for those among other EWs. This model is relevant for EWs that can social distance from nEWs but not from each other. D) To model the impact of healthcare workers, an additional infectious route (βH) is included from within the hospitalized compartments to susceptible individuals in the essential group.
Fig 2
Fig 2. Cumulative infection rates among EWs and nEWs for different scenarios and values of θ.
The dashed and solid lines correspond to EWs and nEWs respectively. Note that the ordering of the colors is not the same for EWs and nEWs. The proportion of EWs, f, is assumed to be 0.05 for all models. Alternative values of f yield similar qualitative results, as do alternative values of other parameters (see Section 2 and Figs 1–16 in S1 Appendix).
Fig 3
Fig 3
Heatmaps of cumulative infections after a year in the total population (A), in nEWs (B), and in EW (C). The red contour lines correspond to f, θ values for which the prevalence of infection over a year in the population or subpopulation is equal to the prevalence without EWs (i.e., f = 0) and R0θ = 1. These contour lines are absent in the two bottom right-most panels, because when f>0, the prevalence in EWs is greater than that expected with f = 0 and R0θ = 1. For equivalent figures with alternative choices of parameter values, see Section 3 and Figs 17–29 in S1 Appendix.
Fig 4
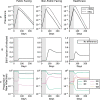
Fig 4. Time resolved dynamics of infections, for f = 0.05 and R0θ = 0.5.
Times before the implementation of SIP (day 53) are denoted by the grey shade. A) Time-resolved proportion of EWs (dashed lines) and nEWs (solid lines) that are infected. B) The fraction of infected individuals that are EWs. Prior to SIP, this fraction is f, except in the healthcare model where EWs also become infected from individuals within the hospital compartments. After SIP, this fraction increases, i.e., EWs bear a proportionally larger burden of the epidemic. C) Where new infections originate. SIP reorganizes the flow of infections through the subpopulations in a model-dependent manner. The acronyms denote different types of transmission, with the first and second letters denoting the infecting and the infected subpopulation respectively (e.g., EN is infections from EWs to nEWs); WH refers to infections that occur within hospitals. For equivalent figures with alternative choices of parameter values, see Section 4 and Figs 30–46 in S1 Appendix.

References

    1. Organization, World Health. The world health report 2007: global public security in the 21st century: a safer future. World Health Organization; 2007. Available: https://www.who.int/whr/2007/whr07_en.pdf
    1. Al-Tawfiq JA, Zumla A, Gautret P, Gray GC, Hui DS, Al-Rabeeah AA, et al.. Surveillance for emerging respiratory viruses. Lancet Infect Dis. 2014;14: 992–1000. doi: 10.1016/S1473-3099(14)70840-0 - DOI - PMC - PubMed
    1. Consultation WT. Public health measures during the influenza A(H1N1)2009 pandemic. World Health Organization; 2010. Oct. Available: https://apps.who.int/iris/bitstream/handle/10665/70747/WHO_HSE_GIP_ITP_2...
    1. Zheng Q, Jones FK, Leavitt SV, Ung L, Labrique AB, Peters DH, et al.. HIT-COVID, a global database tracking public health interventions to COVID-19. Sci Data. 2020;7: 286. doi: 10.1038/s41597-020-00610-2 - DOI - PMC - PubMed
    1. Bell DM, World Health Organization Working Group on International and Community Transmission of SARS. Public health interventions and SARS spread, 2003. Emerg Infect Dis. 2004;10: 1900–1906. doi: 10.3201/eid1011.040729 - DOI - PMC - PubMed

Publication types

MeSH terms