. 2021 Oct 4;60(41):22537-22546.
doi: 10.1002/anie.202109735. Epub 2021 Aug 31.

Feedback and Communication in Active Hydrogel Spheres with pH Fronts: Facile Approaches to Grow Soft Hydrogel Structures

Affiliations

Feedback and Communication in Active Hydrogel Spheres with pH Fronts: Facile Approaches to Grow Soft Hydrogel Structures

Indrajit Maity et al. Angew Chem Int Ed Engl. .

Abstract

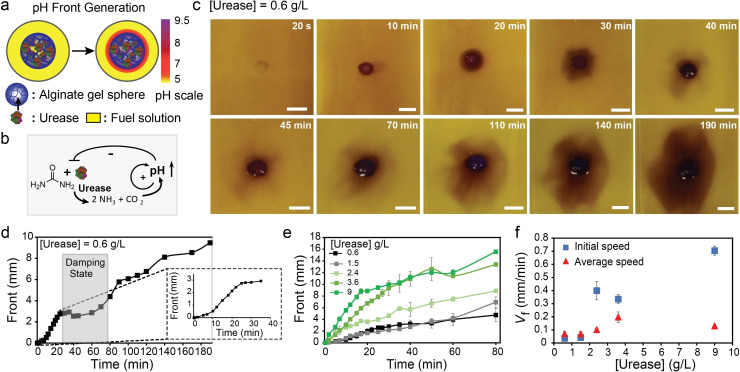
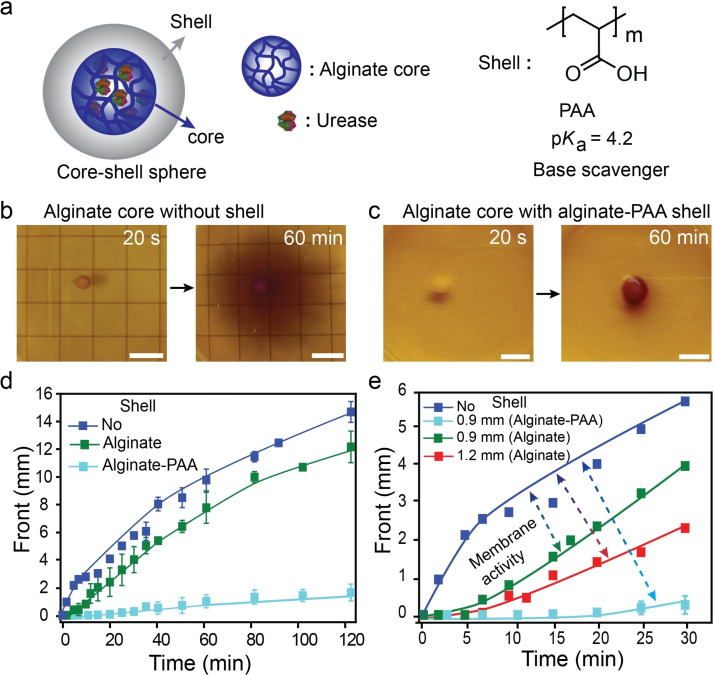
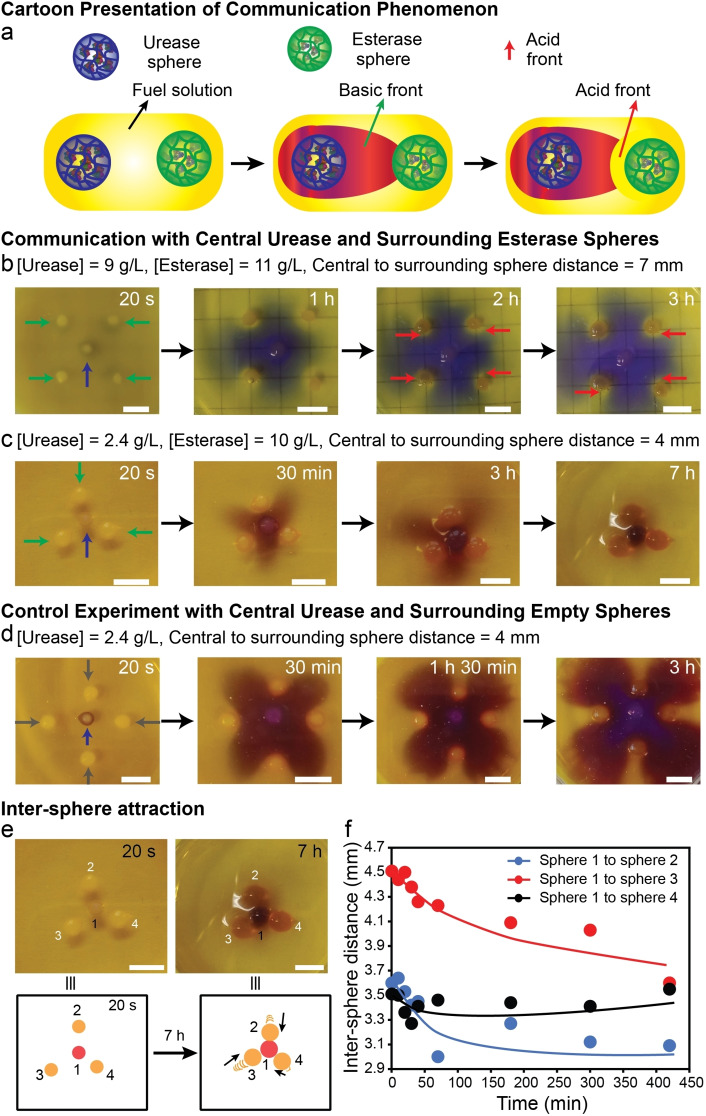
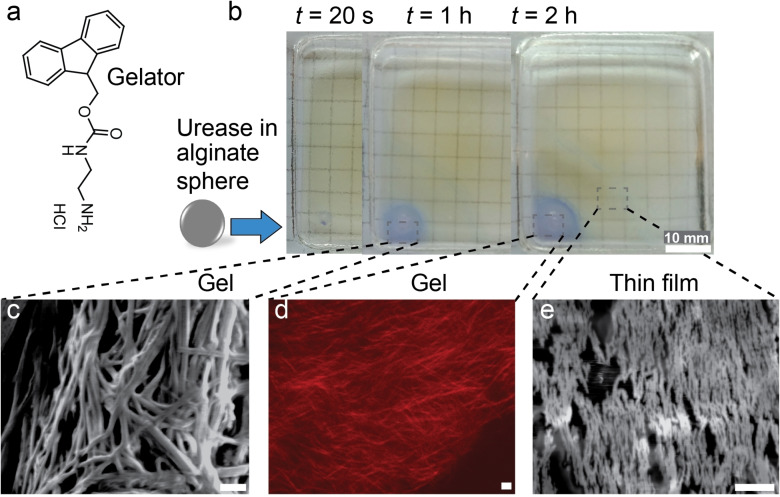
Compartmentalized reaction networks regulating signal processing, communication and pattern formation are central to living systems. Towards achieving life-like materials, we compartmentalized urea-urease and more complex urea-urease/ester-esterase pH-feedback reaction networks into hydrogel spheres and investigate how fuel-driven pH fronts can be sent out from these spheres and regulated by internal reaction networks. Membrane characteristics are installed by covering urease spheres with responsive hydrogel shells. We then encapsulate the two networks (urea-urease and ester-esterase) separately into different hydrogel spheres to devise communication, pattern formation and attraction. Moreover, these pH fronts and patterns can be used for self-growing hydrogels, and for developing complex geometries from non-injectable hydrogels without 3D printing tools. This study opens possibilities for compartmentalized feedback reactions and their use in next generation materials fabrication.

Keywords: chemical reaction networks; hydrogels; life-like systems; pH feedback system; supramolecular chemistry.


Conflict of interest statement

The authors declare no conflict of interest.

Figures

Figure 1
Figure 1
A roadmap from pH front chemistry to systems and materials design. Studies comprise enzymatic reaction networks encapsulated in single spheres to induce and regulate pH fronts and identify non‐linear phenomena, installing a membrane activity by addition of pH‐responsive gel shells to core–shell spheres, inter‐sphere communication between spheres containing antagonistic enzymes, and self‐synthesizing 2D and 3D hydrogel structures as an alternative to 3D printing tool.
Figure 2
Figure 2
Non‐linear network responses of urease‐loaded gel spheres in urea/Na3C/CA solutions. a) A pH front when placing a urease‐loaded alginate gel sphere into a solution containing urea (300 mM) at a starting pH of 3.5 (10 mM Na3C/CA). The pH color scale is a guide to the eye. b) Urea‐urease network topology. c) Time‐lapse photographs of the basic pH front from compartmentalized urea‐urease reaction network, highlighting the non‐linear damping phenomenon (0.6 g L−1 urease). d) pH front propagation for a single experiment with urease gel sphere (0.6 g L−1 urease) clearly presenting initial sigmoidal signature and later damping phenomenon. e) pH front propagation with various urease concentrations (average of 2–3 repeats). f) Initial (t≈0 min) and average (from t=10–60 min) pH front velocities as a function of the urease concentration. Experimental conditions: 20 μL sodium alginate (4.5 wt %); respective enzymes concentrations; Fuel solutions: 300 mM urea, 10 mM Na3C/CA (pH 3.5), and 0.2 g L−1 BCP. Scale bars: 5 mm. Table S1 lists the values of initial and average speeds.
Figure 3
Figure 3
Non‐linear network responses of urease/esterase gel spheres in urea/EA/Na3C/CA solutions. a),b) Experimental setup and urea‐urease/ester‐esterase network topology. The pH color scale is a guide to the eye. c),d) Time‐lapse photographs of pH fronts from compartmentalized urea‐urease/ester‐esterase reaction networks (0.6 g L−1 urease, (c) 5.4 and (d) 12 g L−1 esterase). e) pH front propagation for various esterase concentrations for urease/esterase‐loaded spheres (0.6 g L−1 urease; average of 2–3 measurements). f) Initial (t≈0 min) and average (from t=10–60 min) pH front velocities as a function of the esterase concentration. Positive and negative feedback to the pH front depend on esterase concentration against a fixed urease concentration of 0.6 g L−1. Experimental conditions: 20 μL sodium alginate (4.5 wt %) with respective enzymes mixtures; Fuel solutions: 300 mM urea, 1.00 M EA, 10 mM Na3C/CA (pH 3.5), and 0.2 g L−1 BCP. Scale bars: 5 mm. Table S1 lists the values of initial and average speeds.
Figure 4
Figure 4
Membrane activity by addition of pH‐responsive shells onto urease‐loaded gel spheres. a) Core‐shell spheres: The core is an alginate sphere with 9 g L−1 urease, the shell is enzyme free and composed of pure alginate or alginate/PAA. b),c) pH front generated from urease‐loaded core (b) without shell and (c) with alginate‐PAA shell. d) pH front propagation kinetics for different core–shell spheres highlighting the membrane activity with various shell composition. A shell‐free sphere is shown for comparison. e) The membrane activity depends on the shell thickness. For the membrane activity experiments: 8 μL of sodium alginate (4.5 wt %) and respective urease (9 g L−1) mixture is used to prepare the core sphere (R=1.1±0.1 mm). Shell wall (thickness=0.9±0.1 mm) is prepared either from 20 μL of sodium alginate (4.5 wt %) or alginate/PAA (3.5 wt %/1 wt %). Fuel solutions: 300 mM urea, 10 mM Na3C/CA (pH 3.5), and 0.2 g L−1 BCP. Scale bars: 5 mm.
Figure 5
Figure 5
Inter‐sphere communication, temporal pH front patterns and inter‐sphere attraction. a) General scheme. b)–d) Sphere patterns as described in the Figure. The respective counter acid fronts from esterase sphere in (b) are indicated by red arrows. All urease, esterase, and empty spheres are indicated by blue, green, and gray arrows, respectively. Fuel solution: 100 mM urea, 10 mM Na3C/CA (pH 3.5), and (b) 3.0 M EA, 0.08 g L−1 of BCP; c–d) 1.0 M EA, 0.2 g L−1 of BCP. e) Inter‐sphere attraction of experiment shown in (c) top. The black arrows indicate the movement of the surrounding sphere (bottom). f) Plot of center‐to‐center distance vs. time revealing inter‐sphere attraction. Please note that the final center‐to‐center distance is not 2.2 mm, as expected for 1.1 mm sphere, but slightly larger due to volume expansion when the basic environment is created. Scale bars: 5 mm.
Figure 6
Figure 6
Autonomous growth of hydrogel materials. a) Chemical structure of gelator, Fmoc‐Et‐NH2. b) Growth of self‐assembled gel front by urease‐loaded sphere (R=1.05 mm, 9 g L−1 urease). c)–e) The respective (c,e) SEM (scanning electron microscopy) and (d) CLSM (confocal laser scanning microscopy) images at the bottom refer the alignment of nanofibers by the urease‐loaded alginate sphere. Gelator‐fuel solution contains: 4 g L−1 Fmoc‐Et‐NH2, 300 mM urea, 10 mM Na3C/CA (pH 3.5), 0.02 g L−1 BCP. Scale bars: 1 μm.
Figure 7
Figure 7
Autonomous growth of various geometrical hydrogel structures. a),b) Visualization and kinetics of gel fronts generated by urease spheres with (a) varied urease concentration at const. R=1.05 mm or (b) varied sphere dimension at const. urease 9 g L−1. c) Fmoc‐Et‐NH2 gels are non‐injectable and cannot be 3D printed. d)–k) Various shapes and scripts including (d) cylinder, (e) triangle, (f) rectangle, (g) number eight, (h) hemisphere, (i) flower, (j,k) “Hi You” are grown from the non‐injectable hydrogel without the help of 3D printing or molds. Black arrows indicate the growth of the gel fronts while red arrows in (i) indicate the removal of surrounding dummy spheres. l) More complex 3D pyramid can be constructed by layer‐by‐layer deposition of gel material by the pre‐patterns of urease‐loaded gel spheres. Gelator‐fuel solution: 4 g L−1 of Fmoc‐Et‐NH2, 300 mM urea, 10 mM Na3C/CA (pH 3.5), 0.05 g L−1 BCP. Scale bars: 5 mm.

Similar articles

Cited by

References

    1. Meinhardt H. in Current Topics in Developmental Biology, Vol. 81 (Eds.: Schnell S., Maini P. K., Newman S. A., Newman T. J.), Academic Press, New York, 2008, pp. 1–63.
    1. Taga M. E., Bassler B. L., Proc. Natl. Acad. Sci. USA 2003, 100, 14549–14554. - PMC - PubMed
    1. Bean B. P., Nat. Rev. Neurosci. 2007, 8, 451–465. - PubMed
    1. Ross C., Boroviak T. E., Nat. Commun. 2020, 11, 3760. - PMC - PubMed
    1. Epstein I. R., Pojman J. A., An Introduction to Nonlinear Chemical Dynamics: Oscillations, Waves, Patterns, and Chaos, Oxford University Press, New York, 1998.

Publication types

LinkOut - more resources