Review
. 2021;38(3):1-31.
doi: 10.1615/CritRevTherDrugCarrierSyst.2021035222.

Role of In Vitro Models for Development of Ophthalmic Delivery Systems

Affiliations
Review

Role of In Vitro Models for Development of Ophthalmic Delivery Systems

Shallu Kutlehria et al. Crit Rev Ther Drug Carrier Syst. 2021.

Abstract

There is emergent need for in vitro models which are physiologically correct, easy to reproduce, and mimic characteristic functionalities of desired tissue, organ, or diseases state for ophthalmic drug screening, as well as disease modeling. To date, a variety of in vitro models have been developed for the applications ranging from 2D cell culture-based monolayers, multilayer, or co-culture models, to 3-dimensional (3D) organoids, 3D printed and organ on chip systems. Each model has its own pros and cons. While simple models are easier to create, and faster to reproduce, they lack recapitulation of the complex framework, functionalities, and properties of tissues or their subunits. Recent advancements in technologies and integration with tissue engineering and involvement of microfluidic systems have offered novel platforms which can better mimic the in vivo microenvironment, thus possessing potential in transformation of ophthalmic drug development. In this review we summarize existing in vitro ocular models while discussing applicability, drawbacks associated with them, and possible future applications.


Figures

FIG. 1:
FIG. 1:
Schematic diagram of the human eye showing its anatomy. (a) Whole eye showing anterior and posterior segments (reprinted from Chuang et al. with permission from Yale Journal of Biology and Medicine, copyright 2017). (b) Cornea with 6 layers. (c) Distribution of various types of cells in retina and blood retinal barrier (Figure reproduced from White et al. under a Creative Commons license).
FIG. 2:
FIG. 2:
Gross morphology of corneal organoids. Bright field observations showing gross morphology of corneal organoids obtained from hiPSCs after 3 months in culture. (a) Organoids appeared translucent with a dense center. (b, d) Organoids had clear center. (c) Organoids had clear center and pigmented end. Scale bar 200 μm (Figure reproduced from Foster et al. under a Creative Commons license).
FIG. 3:
FIG. 3:
Retinal organoids with different ganglionic cell layers. (a) Brightfield images displaying stratified morphology of early retinal organoids. (b) Differentiation day 30: almost all cells within retinal organoids expressed the retinal progenitor marker CHX10. (c, d) Differentiation day 70 days, BRN3-positive cells resided in basal layers while Recoverin-positive photoreceptors occupied more apical layers. Scale bars equal 500 μm for (a) and 100 μm for (b, c, d). Scale bar in b applies to (c, d) (Figure reproduced from Fligor et al. under a Creative Commons license).
FIG. 4:
FIG. 4:
3D printed cornea model. (a) Corneal stroma model designed in Autodesk fusion 360. (b) 3D printed cornea after cross-linking placed in the media (reprinted from Kutlehria et al. with permission from John Wiley and Sons, copyright 2020).
FIG. 5:
FIG. 5:
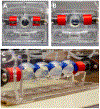
Blink model (a) Fully assembled blink model; 1. eyeball, 2. eyelids, 3. lower eyelids, 4. tubing attached to a microfluidic pump, and 5. acrylic chambers. (b) Eyelid in the closed position. (c) For high throughput testing-blink model can be connected with 4 eyelids (Figure reproduced from Phan et al. under a Creative Commons license).
FIG. 6:
FIG. 6:
3D printed retinal equivalents with 2 distinct Y79 cell-seeding density. (a) High average cell density at the center (HC). (b) High average cell density at the periphery (HP); *central area, **periphery; scale bar: 10 mm (Figure reproduced from Shi et al. under a Creative Commons license).
FIG. 7:
FIG. 7:
Microfluidic chip design and retinal synapse principal function. (a) Design of retinal synapse regeneration (RSR) chip to mimic retinal structure. The RSR-Chip consists of two chambers connected by 100 microchannels. Two populations of retinal cells are seeded in the two chambers and form synaptic connections in the microchannels. (b) Image of microchannels in RSR-Chip. Scale bar, 200 μm (Figure reproduced from Su et al. under a Creative Commons license).
FIG. 8:
FIG. 8:
Microfluidic eye-on-a-chip model-3D RPE-choroid. (a) Schematic of RPE–choroid complex in the neural retina of the eye. (b) Design showing microfluidic device mimicking the RPE–choroid system in vitro. (c) Optimization of the device design by testing gap channels with various widths (reprinted from Chung et al. with permission from John Wiley and Sons, copyright 2017).

References

    1. Chuang K, Fields MA, Del Priore LV. Focus: Genome editing: Potential of gene editing and induced pluripotent stem cells (iPSCs) in treatment of retinal diseases. Yale J Biol Med. 2017. December 19;90(4):635–42. - PMC - PubMed
    1. Cholkar K, Patel SP, Vadlapudi AD, Mitra AK. Novel strategies for anterior segment ocular drug delivery. J Ocular Pharmacol Therapeut. 2013;29(2):106–23. - PMC - PubMed
    1. Shafaie S, Hutter V, Cook MT, Brown MB, Chau DY. In vitro cell models for ophthalmic drug development applications. Biores Open Access. 2016;5(1):94–108. - PMC - PubMed
    1. Wilson SL, Ahearne M, Hopkinson A. An overview of current techniques for ocular toxicity testing. Toxicology. 2015;327:32–46. - PubMed
    1. Huhtala A, Salminen L, Tähti H, Uusitalo H. Corneal models for the toxicity testing of drugs and drug releasing materials. In: Ashammakhi N, editor. Topics in multifunctional biomaterials and devices. 2008. p. 1–24.