. 2021 Sep 2;184(18):4640-4650.e10.
doi: 10.1016/j.cell.2021.07.010. Epub 2021 Aug 3.

Hippocampal neurons construct a map of an abstract value space

Affiliations

Hippocampal neurons construct a map of an abstract value space

Eric B Knudsen et al. Cell. .

Abstract

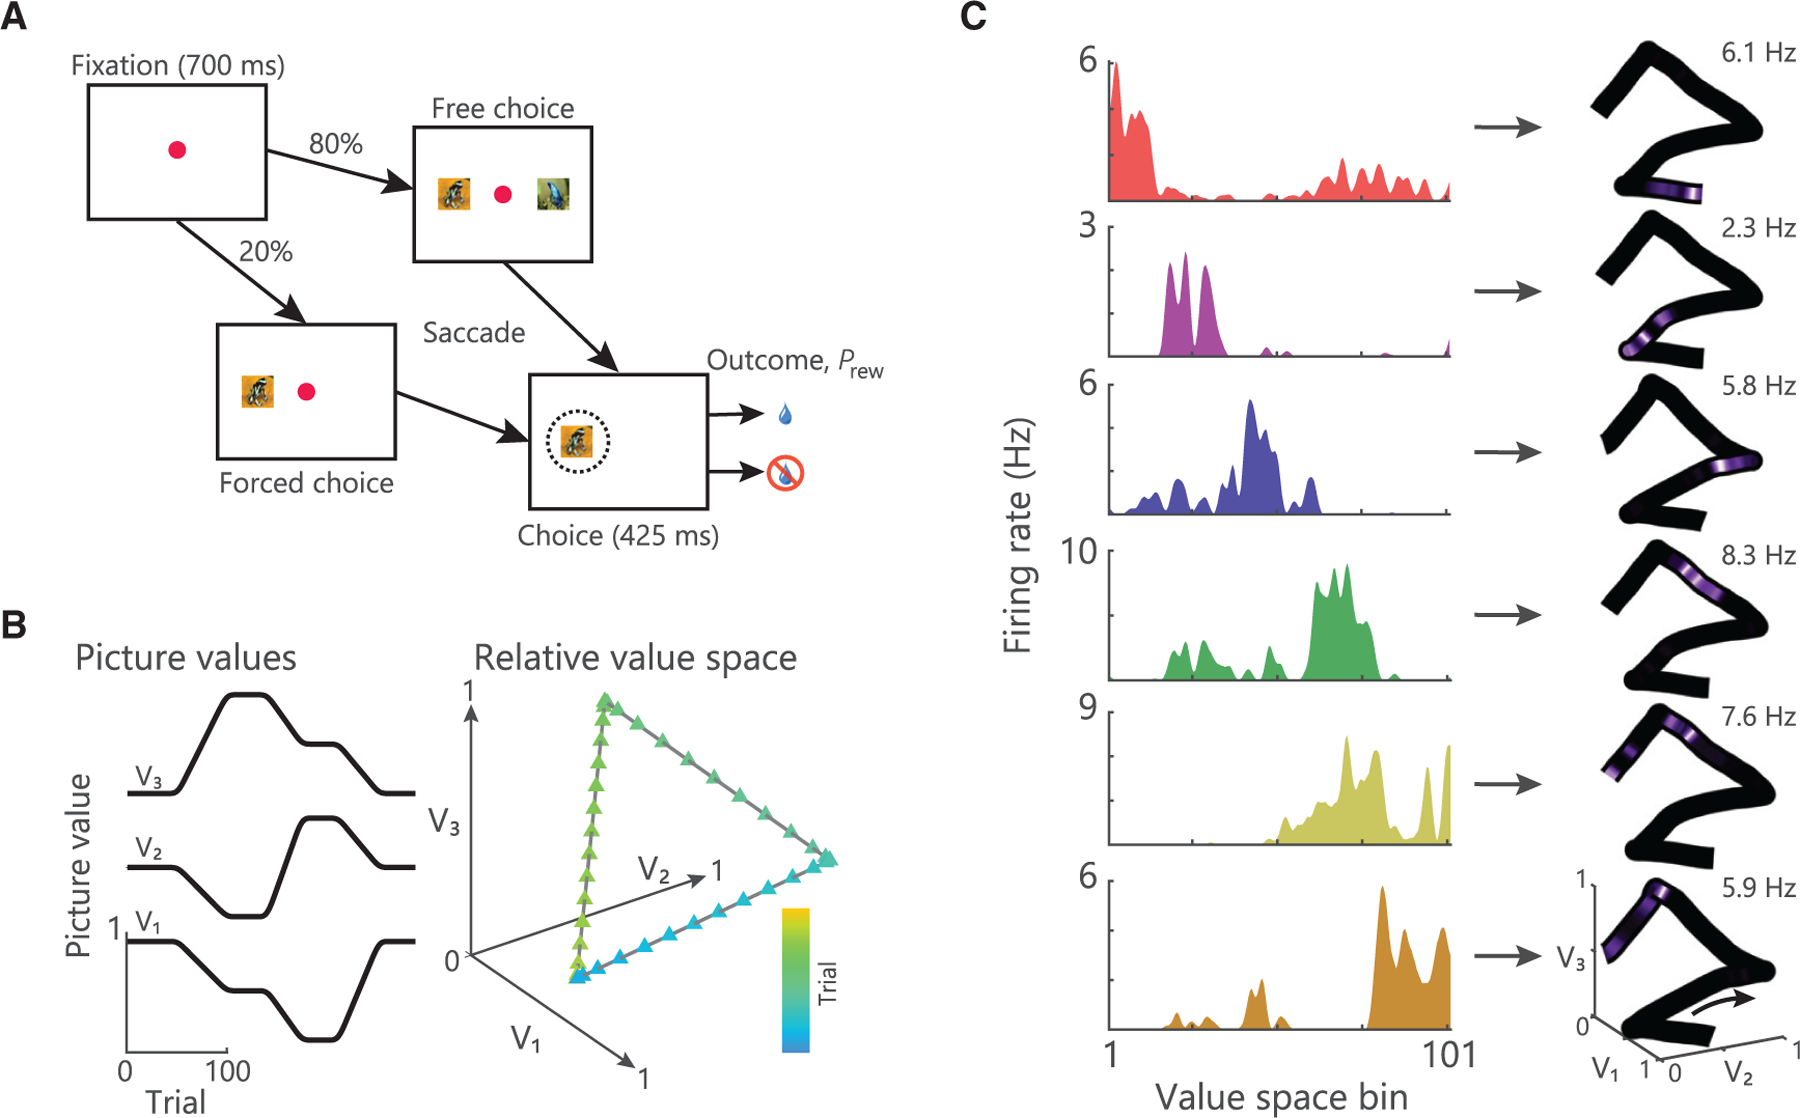
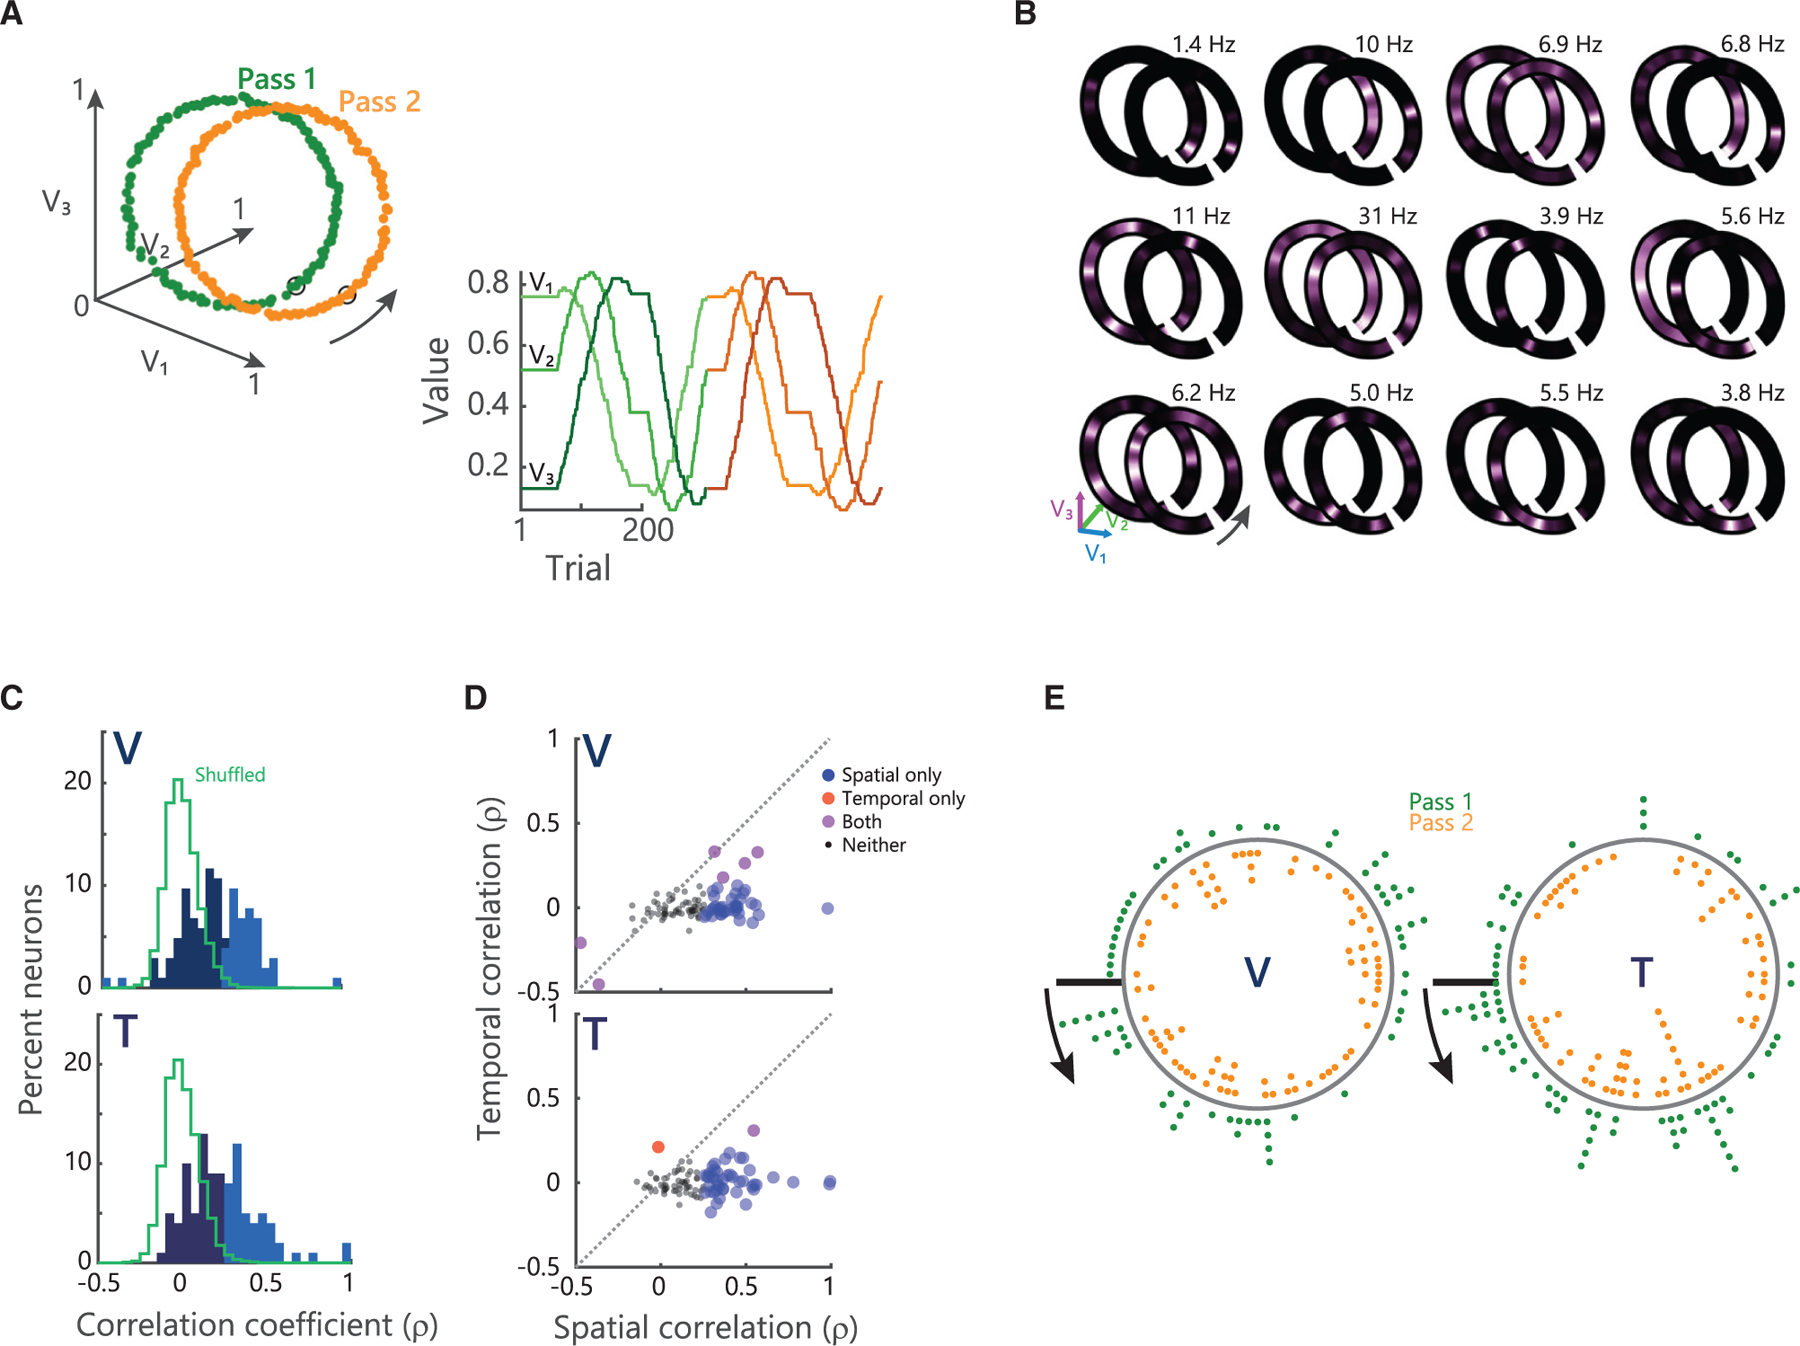
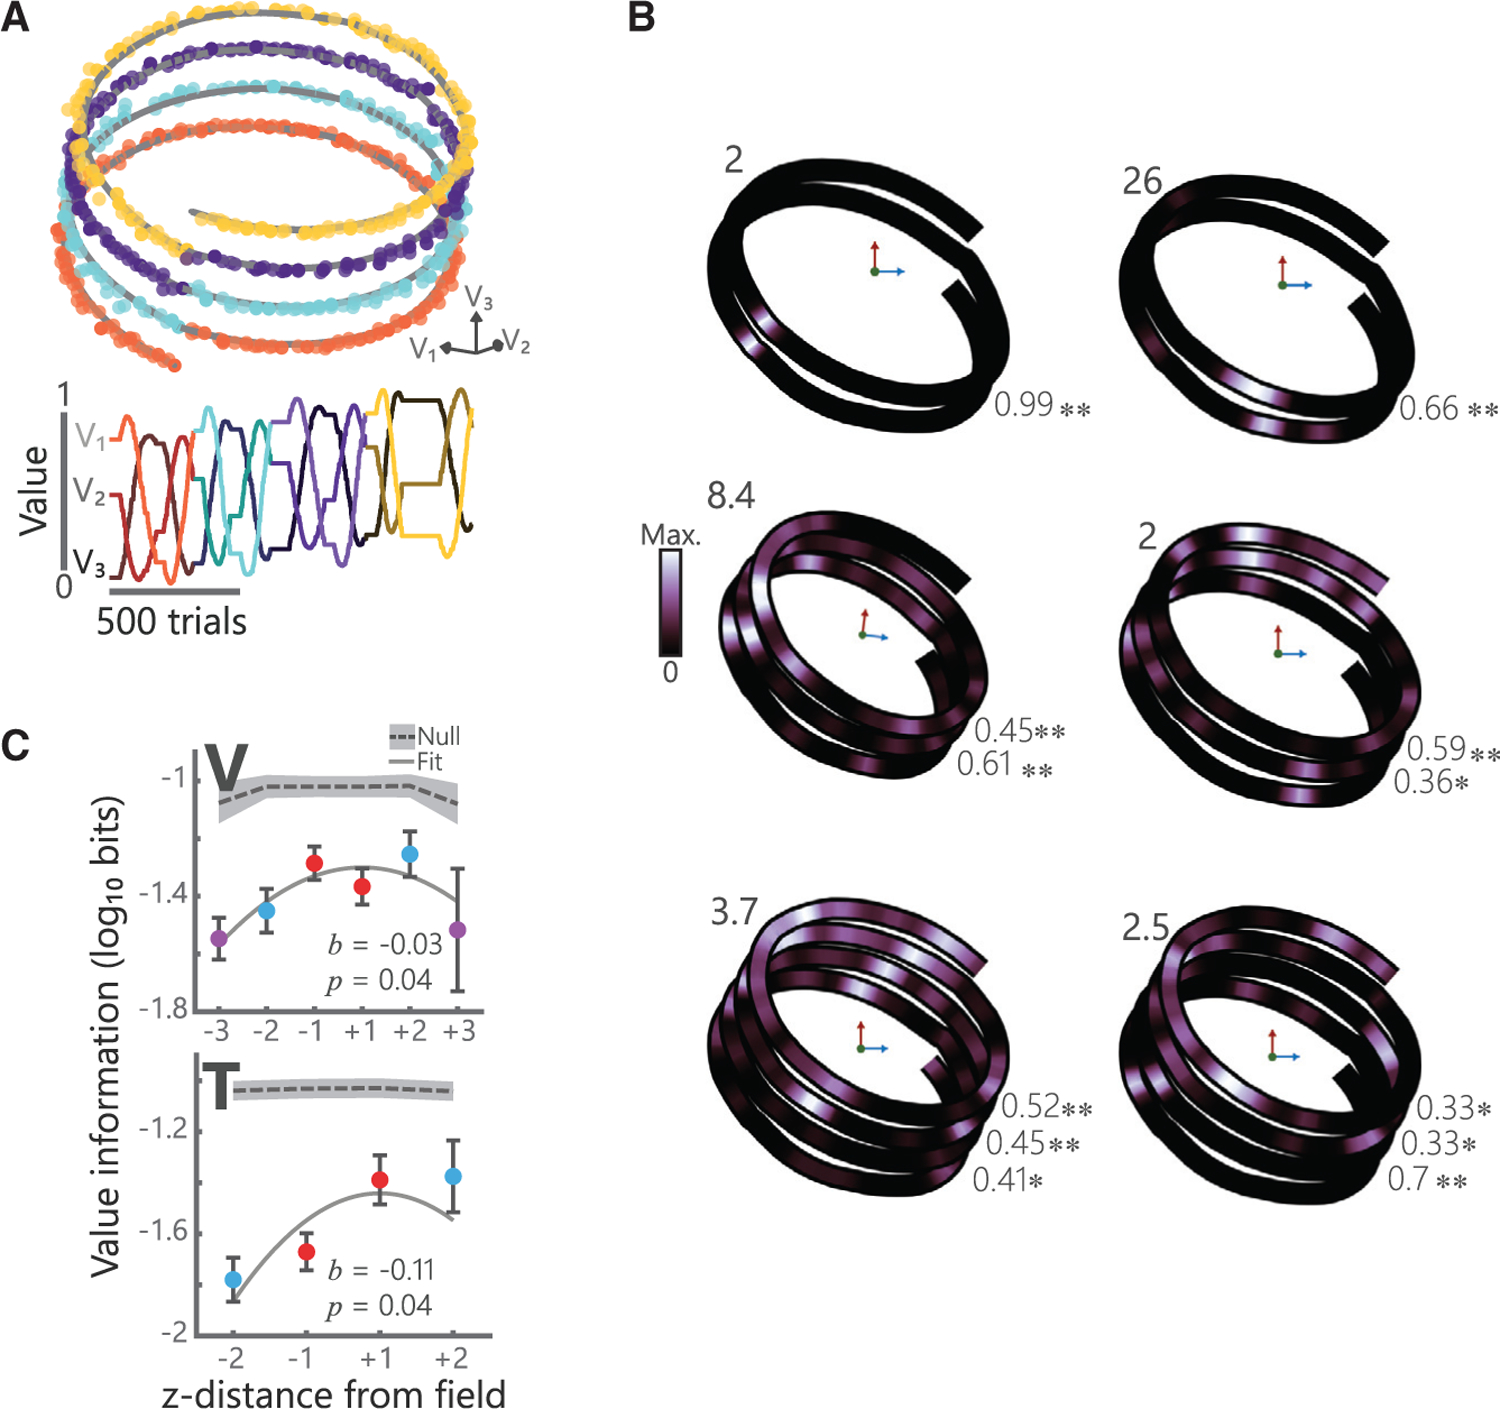
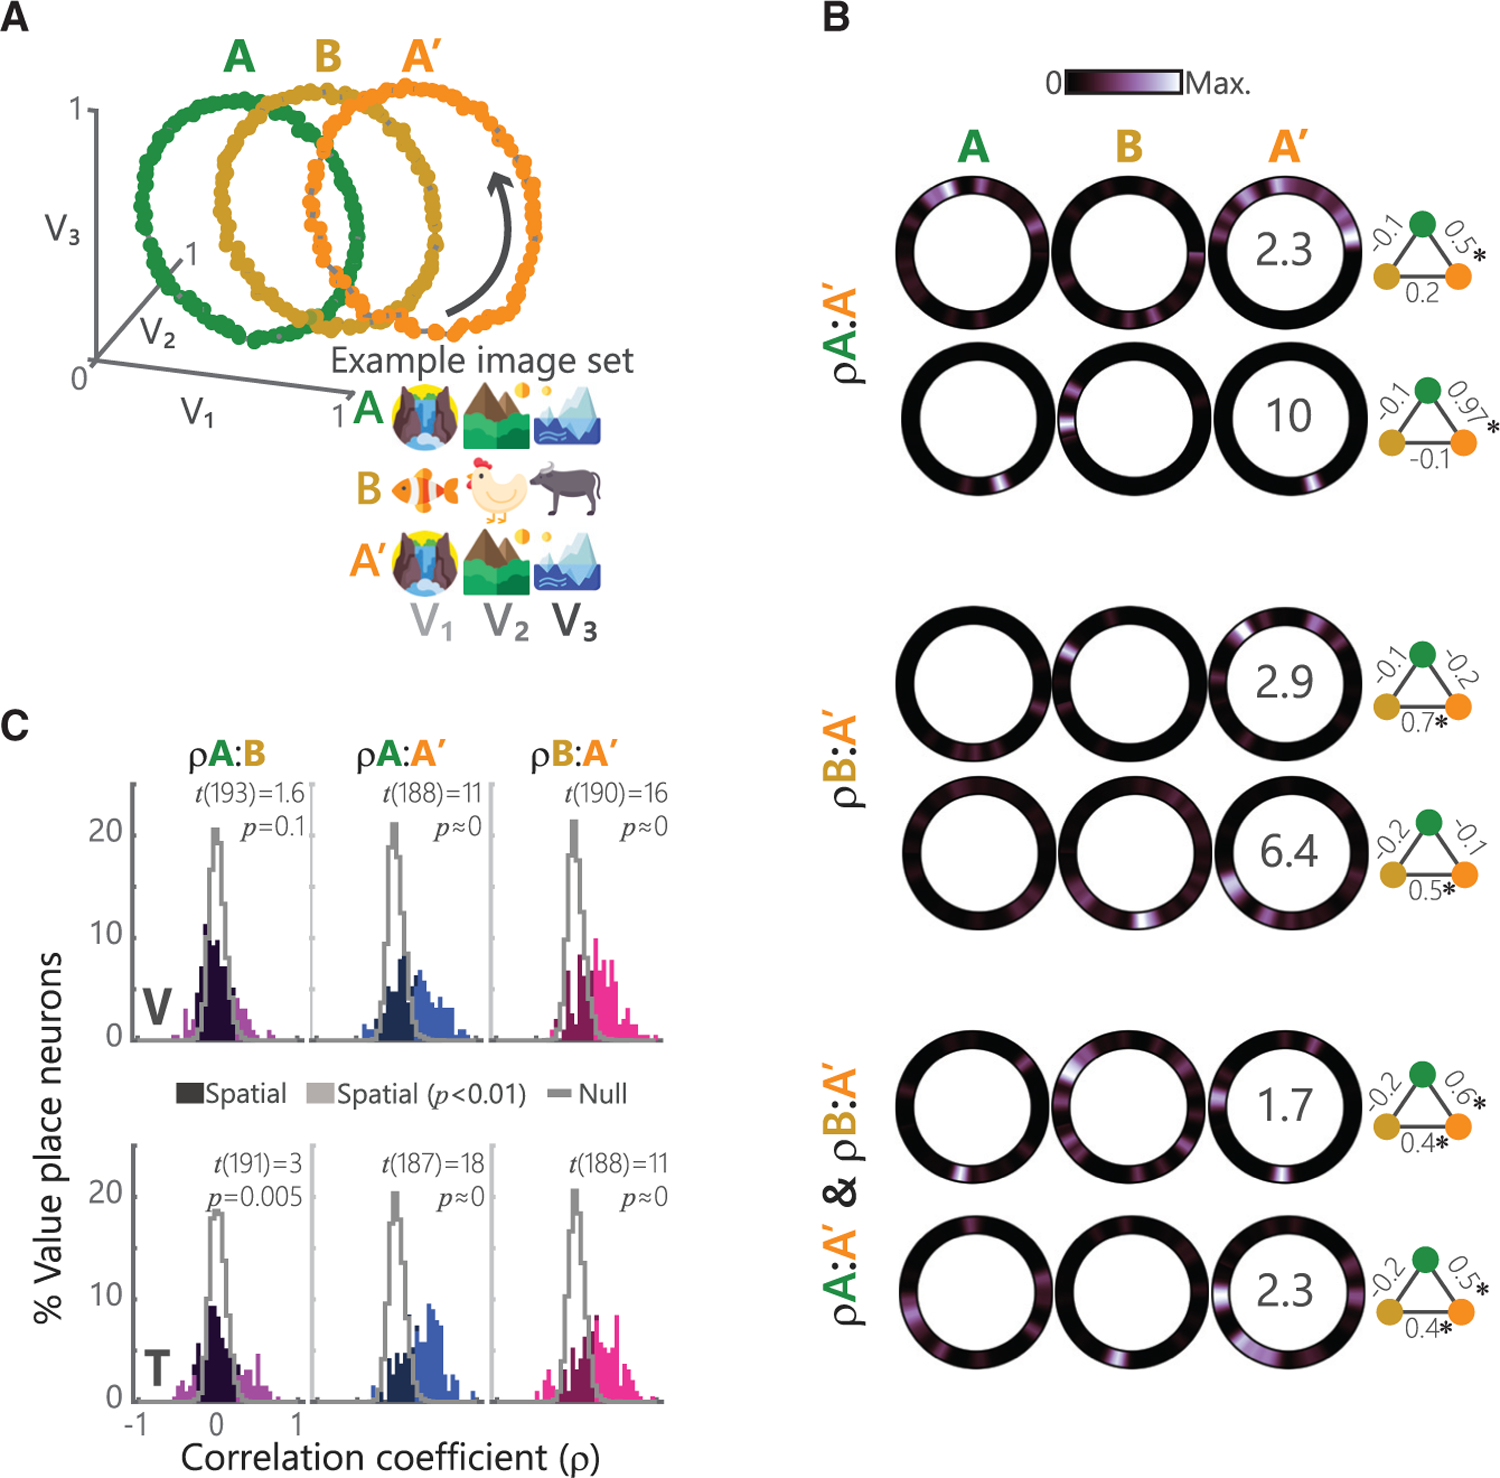
The hippocampus is thought to encode a "cognitive map," a structural organization of knowledge about relationships in the world. Place cells, spatially selective hippocampal neurons that have been extensively studied in rodents, are one component of this map, describing the relative position of environmental features. However, whether this map extends to abstract, cognitive information remains unknown. Using the relative reward value of cues to define continuous "paths" through an abstract value space, we show that single neurons in primate hippocampus encode this space through value place fields, much like a rodent's place neurons encode paths through physical space. Value place fields remapped when cues changed but also became increasingly correlated across contexts, allowing maps to become generalized. Our findings help explain the critical contribution of the hippocampus to value-based decision-making, providing a mechanism by which knowledge of relationships in the world can be incorporated into reward predictions for guiding decisions.

Keywords: cognitive map; decision making; hippocampus; reward learning; value place cell.


Conflict of interest statement

Declaration of interests The authors declare no competing interests.

Figures

Figure 1.
Figure 1.. Task and preliminary evidence of value place neurons
(A) Timeline of a single trial. Subjects centrally fixated for 700 ms and were then presented with either a forced or free choice. Subjects selected pictures via saccades, which resulted in the probabilistic delivery of reward (Prew). (B) Example of how the three picture values might change across a session (left) and the resultant trajectory through value space (right). (C) Left: spike density histograms illustrating place encoding in value space for six hippocampal neurons. Right: firing rates overlaid onto the trajectory through value space mapped from 0 Hz to the peak firing rate as noted in the top right of each panel. These neurons are from a previous dataset (Knudsen and Wallis, 2020), which used the same task design, but arbitrary trajectories through value space. Different neurons were active in distinct regions of value space. See also Figure S1.
Figure 2.
Figure 2.. Value place neurons fire consistently during circular traversal
(A) Example circular trajectory. Left: picture values plotted in value space. Data points indicate individual trials. Green corresponds to pass 1 and orange to pass 2. Orange trajectory is offset along the V1 axis for illustrative purposes only. Arrow denotes direction of traversal. Right: picture values plotted in one dimension across the session. Change from green shades to orange shades denotes transition from pass 1 to pass 2. Picture values V1V3 colored from light to dark shading of given color. (B) Examples of hippocampal firing rates mapped on to circular trajectories. Peak firing rates across both traversals are noted in the top right of each panel. (C) Distribution of the spatial correlation of firing rates on the first and second traversal for all identified value place neurons. Lighter shades denote correlations significant at p < 0.01. Green traces show the distribution of correlations for shuffled data. (D) Scatterplot of spatial and temporal correlations between pass 1 and pass 2. The majority of neurons show significant spatial correlations, but are not significantly temporally correlated. (E) Distribution of all value place fields on pass 1 (green dots) and 2 (orange dots). Arrows start at value bin 1 (black line) and point in the direction of traversal. See also Figures S1, S2, S3, and S4.
Figure 3.
Figure 3.. Value place neurons map the extent of three-dimensional value space
(A) Example helical trajectory from a session where subject V performed 4 loops of the helix. Convention follows Figure 2A. (B) Single neuron examples showing value place fields in three dimensions for sessions where subjects completed two (left), three (middle), or four (right) loops of the helix. Numbers in the upper left of each plot denote the maximum firing rate of that neuron. Numbers in the bottom right of each plot denote spatial correlations between adjacent loops for each neuron (*p < 0.01, **p < 1 3 10‒6). (C) Spatial information of value place fields in three dimensions. For each neuron, 0 was defined as the location with the maximum spatial information and the information content for prior and subsequent loops is illustrated (mean ± SEM). A quadratic fit of log-transformed spatial information, I, by z-distance (lnI = b0 + b1[z-distance]2) was significant in both subjects. Gray shading indicates null distributions derived from applying the same procedure to shuffled data (250 shuffles, 95% confidence interval shown). See also Figures S1, S2, S3, and S4.
Figure 4.
Figure 4.. Hippocampal neurons encode value place in a directional manner
(A) Schematic of the double lemniscate task. Convention follows Figure 2A. Gray box indicates the overlap regions. (B) Five examples of hippocampal neurons encoding position in value space along the double lemniscate trajectory. Top: firing rate for the whole trajectory. The peak firing rate is shown in the upper right. Middle: firing rate on the congruent, rightward passes through the central point. Firing rates are normalized within each pass. Correlation values between the two passes are shown (*p < 0.01, **p < 0.001). Bottom: firing rate on the opposing (up versus down) passes. Opposing trajectories have been rotated to be in alignment for visualization. (C) Distribution of spatial correlations for congruent (left) and opposing (right) passes through value space for all recorded value place neurons. Colored regions denote significant correlations at p < 0.01; gray lines show shuffled null distributions. The proportion of neurons with significant correlations was greater than chance in all cases (two-sample t tests comparing the absolute values of real and shuffled data), but there were significantly more correlated neurons for congruent versus opposing passes. The bimodality of the actual data and the shuffled data arises from the analysis procedure that we used to account for slight misalignments between trajectories (see STAR Methods). (D) Examples of value place fields that were positively skewed (top row; S > 0), unskewed (middle row; S ≈ 0), and negatively skewed (bottom row; S < 0). Vertical dashed lines correspond to the field’s CoM. The value F denotes the percent of the value space trajectory that the field spanned. Overall, fields typically spanned ~2% of the trajectory (V: 1.8% ± 2%; T: 1.6% ± 1.8%). (E) Mean (±SEM) skewness values for different portions of the lemniscate for all value place fields. Significance deviations from zero were determined by one-sample t tests (*p < 0.05, **p < 0.001). The second traversal of the correlated trajectory resulted in a significant negative skew. See also Figures S1, S2, S3, S4, and S5.
Figure 5.
Figure 5.. Changing stimuli while preserving the trajectory induces value place neuron remapping
(A) Schematic of the ABAʹ task. Left: convention follows Figure 2A. Right: example picture sets for each block. Picture values V1V3 follow the trajectories shown in Figure 2A. (B) Single neuron examples showing three distinct patterns of how value place fields change across blocks. Top: two neurons that were significantly spatially correlated on only the A and Aʹ blocks (ρA:Aʹ). Middle: two neurons spatially correlated on only the B and Aʹ blocks (ρB:Aʹ). Bottom: two neurons that were correlated on both A:Aʹ and B:Aʹ blocks (ρA:Aʹ & ρB:Aʹ). Numbers superimposed on Aʹ block activity denote the peak firing rate of the neuron across all three blocks. The schematic to the right of each neuron displays the pairwise correlations (*p < 0.001) between blocks A (green), B (yellow), and Aʹ (orange). (C) Distribution of spatial correlation of firing rates for all recorded value place neurons for all pairwise combinations of blocks. Convention follows Figure 2C. Test statistics and p values from a one-sample t test shown. See also Figures S1, S2, S3, and S4.

References

    1. Abe H, and Lee D (2011). Distributed coding of actual and hypothetical outcomes in the orbital and dorsolateral prefrontal cortex. Neuron 70, 731–741. - PMC - PubMed
    1. Anderson MI, and Jeffery KJ (2003). Heterogeneous modulation of place cell firing by changes in context. J. Neurosci 23, 8827–8835. - PMC - PubMed
    1. Aronov D, Nevers R, and Tank DW (2017). Mapping of a non-spatial dimension by the hippocampal-entorhinal circuit. Nature 543, 719–722. - PMC - PubMed
    1. Avigan PD, Cammack K, and Shapiro ML (2020). Flexible spatial learning requires both the dorsal and ventral hippocampus and their functional interactions with the prefrontal cortex. Hippocampus 30, 733–744. - PMC - PubMed
    1. Bakkour A, Palombo DJ, Zylberberg A, Kang YH, Reid A, Verfaellie M, Shadlen MN, and Shohamy D (2019). The hippocampus supports deliberation during value-based decisions. eLife 8, e46080. - PMC - PubMed

Publication types

LinkOut - more resources