. 2022 Feb 17;29(2):191-201.e8.
doi: 10.1016/j.chembiol.2021.07.010. Epub 2021 Aug 3.

Chemogenomics identifies acetyl-coenzyme A synthetase as a target for malaria treatment and prevention

Affiliations

Chemogenomics identifies acetyl-coenzyme A synthetase as a target for malaria treatment and prevention

Robert L Summers et al. Cell Chem Biol. .

Abstract

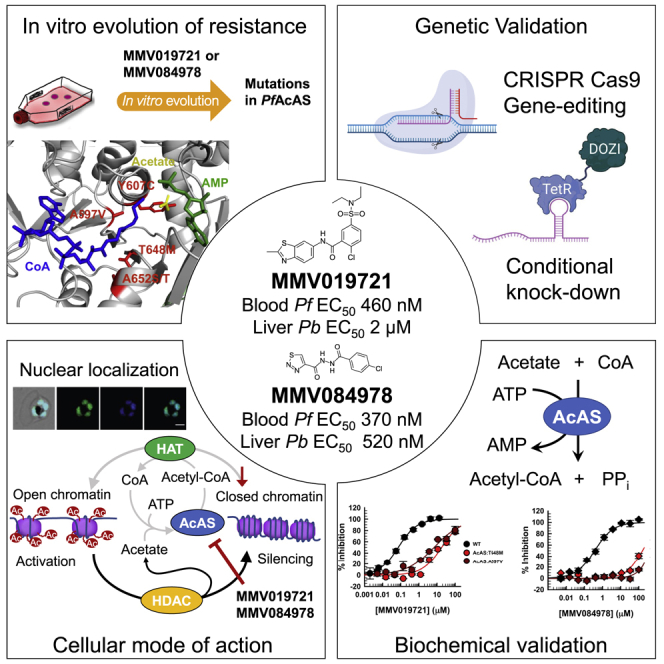
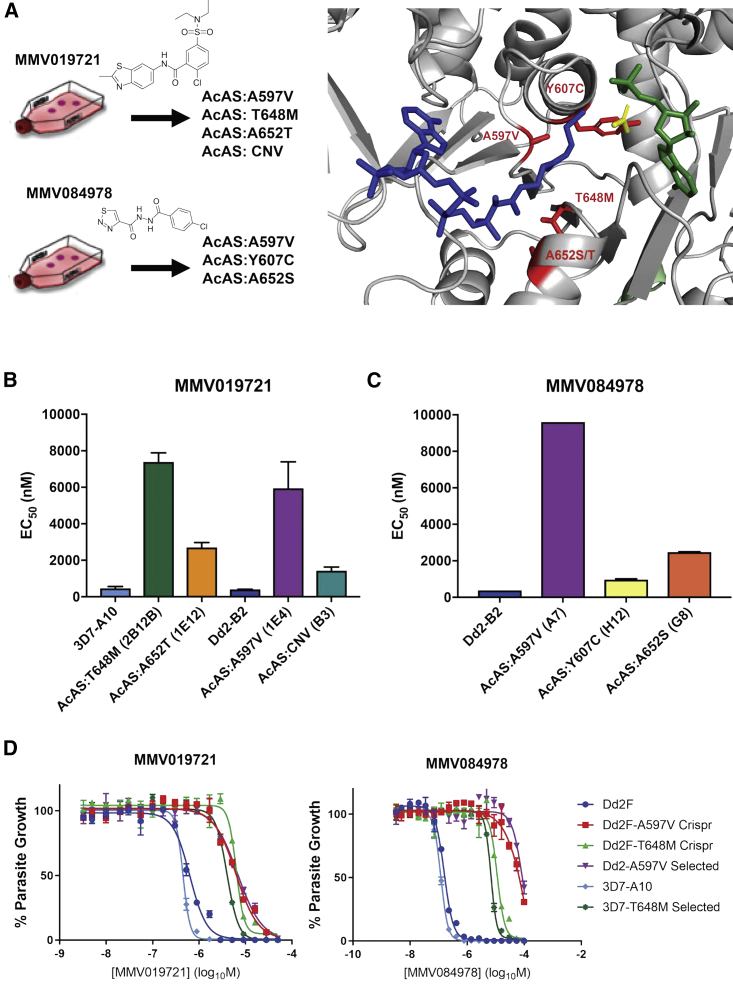
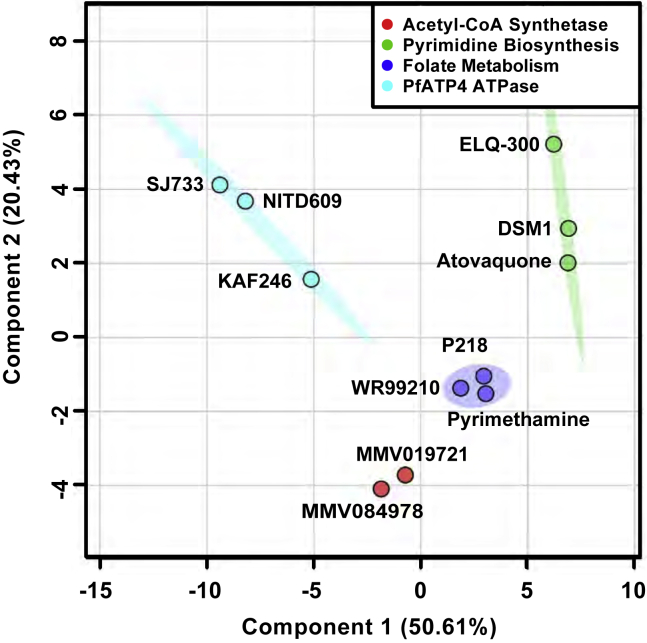
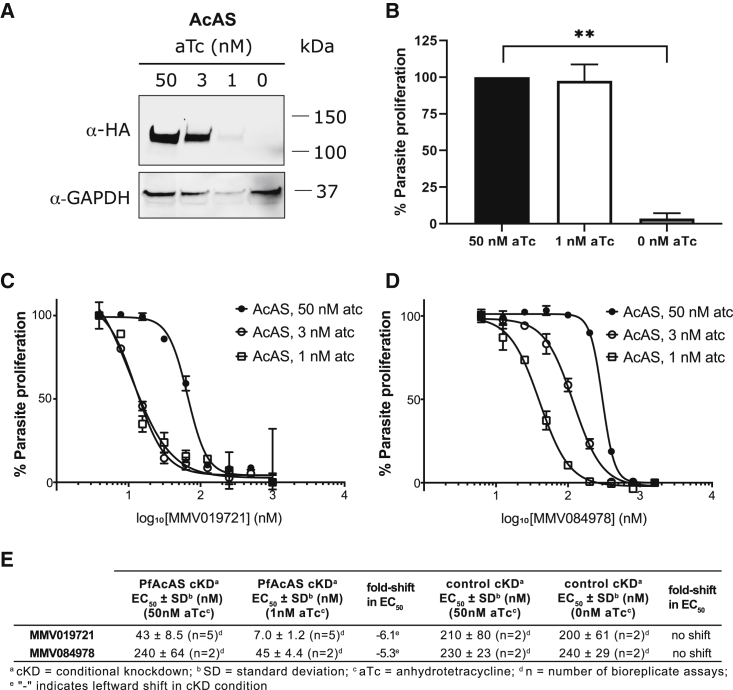
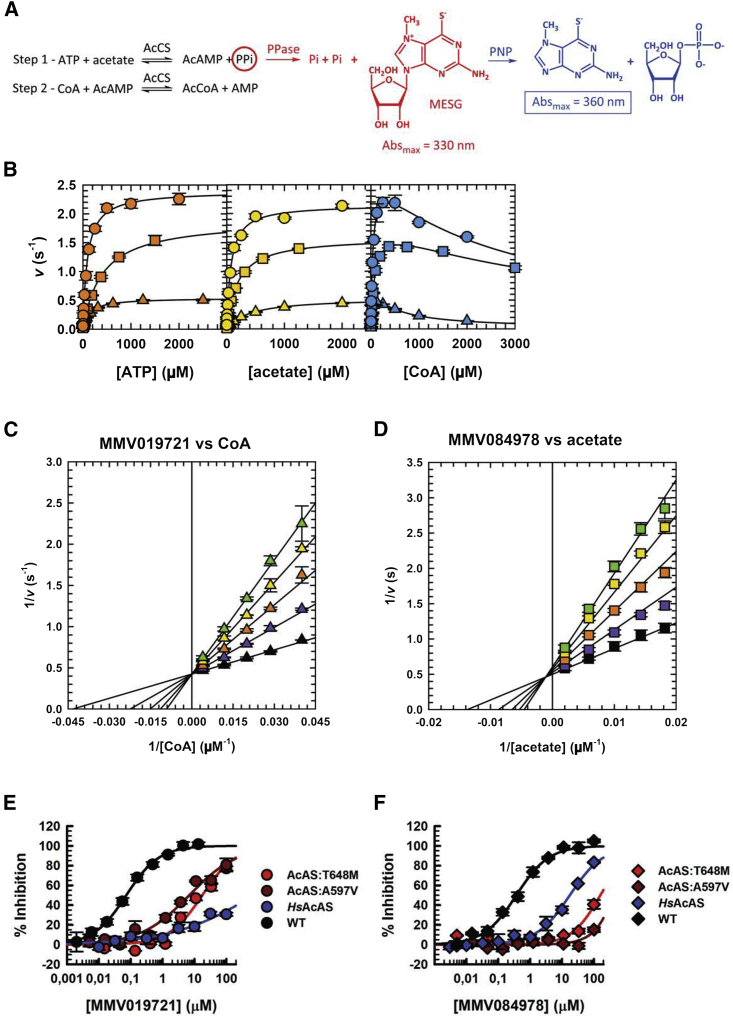
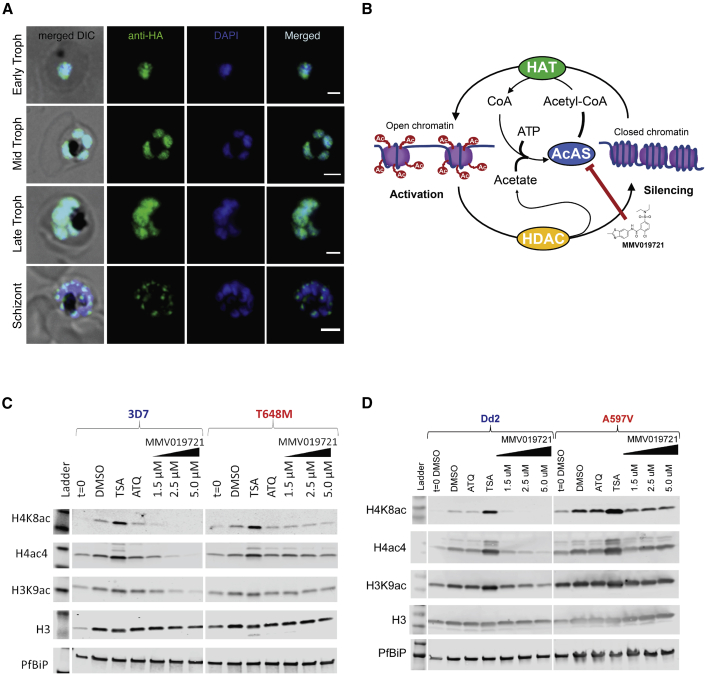
We identify the Plasmodium falciparum acetyl-coenzyme A synthetase (PfAcAS) as a druggable target, using genetic and chemical validation. In vitro evolution of resistance with two antiplasmodial drug-like compounds (MMV019721 and MMV084978) selects for mutations in PfAcAS. Metabolic profiling of compound-treated parasites reveals changes in acetyl-CoA levels for both compounds. Genome editing confirms that mutations in PfAcAS are sufficient to confer resistance. Knockdown studies demonstrate that PfAcAS is essential for asexual growth, and partial knockdown induces hypersensitivity to both compounds. In vitro biochemical assays using recombinantly expressed PfAcAS validates that MMV019721 and MMV084978 directly inhibit the enzyme by preventing CoA and acetate binding, respectively. Immunolocalization studies reveal that PfAcAS is primarily localized to the nucleus. Functional studies demonstrate inhibition of histone acetylation in compound-treated wild-type, but not in resistant parasites. Our findings identify and validate PfAcAS as an essential, druggable target involved in the epigenetic regulation of gene expression.

Keywords: Plasmodium falciparum; acetyl-CoA synthetase; antimalarial; drug development; drug target identification; histone acetylation; malaria; mechanism of action.


Conflict of interest statement

Declaration of interests J.C.N. is a co-inventor on a patent describing the genetically encoded protein-binding RNA aptamer technology used in this work.

Figures

None
Graphical abstract
Figure 1
Figure 1
Mutations in the P. falciparum acetyl-CoA synthetase (PfAcAS) confer resistance to MMV019721 and MMV084978 (A) Homology modeling of PfAcAS reveal that mutations identified in parasites resistant to MMV019721 or MMV084978 line the predicted active site of the enzyme. (B and C) The in vitro susceptibility of representative drug-resistant cloned parasite lines identified as carrying mutations in PfAcAS by WGS. Data represent the mean + standard deviation (SD) of four experiments conducted in triplicate for MMV019721, and the mean + SD of two experiments conducted in triplicate for MMV084978. (D) Representative dose-response assays for the 3D7 (light blue) and Dd2 (dark blue) parent lines, resistance-selected clones carrying A597V (purple) or T648M (light green), and CRISPR-Cas9 gene-edited parasites bearing A597V (red) or T648M (dark green). Shown is one representative biological replicate experiment run with technical triplicates. See also Figures S1 and S2, and Tables S1, S2, and S3.
Figure 2
Figure 2
MMV019721 and MMV084978 induce unique cellular metabolomic profiles in P. falciparum parasites upon drug exposure Principal-component analysis (PCA) plot of the metabolic profiles of parasites treated with MMV019721 or MMV084978, in comparison to those of antiplasmodial compounds known to target mitochondrial function (atovaquone, ELQ-300, and DSM1, green), folate biosynthesis (pyrimethamine, P218, and WR99210, blue), or ion homeostasis (PfATP4-SJ733, NITD609, or KAF246, cyan) (Allman et al., 2016). PC1 represented 50.6% variance while PC2 represented 20.4% of the variance between all compounds. Principal components were calculated using the log2 fold-change in abundance of 98 soluble metabolites caused by test compounds relative to untreated parasite controls. PCA was conducted with MetaboAnalystR (Chong et al., 2019; Chong and Xia, 2018). See also Figure S3 and Table S4.
Figure 3
Figure 3
Conditional knockdown of PfAcAS inhibits parasite growth and sensitizes parasites to MMV019721 and MMV084978 (A) Conditional knockdown (cKD) of PfAcAS expression at reduced concentrations of aTc (3, 1, or 0 nM) over 72 h. (B) Parasite growth over 72 h is inhibited under cKD of PfAcAS. Shown are the average results and SD of two independently repeated experiments with technical replicates. ∗∗p < 0.01, Student's t test compared with 50 nM aTc condition. (C and D) Susceptibility to MMV019721 and MMV084978 was increased under conditions of reduced PfAcAS expression. Shown is one biological replicate run in triplicate. (E) Average EC50 ± SD of parasite susceptibility to MMV019721 and MMV084978 for PfAcAS cKD and control YFP cKD lines under knockdown conditions.
Figure 4
Figure 4
PfAcAS steady-state kinetics and inhibition by MMV019721 and MMV084978 (A) PfAcAS reaction mechanism and EnzChek assay readout. (B) Steady-state kinetics of PfAcAS WT (circles), A597V (triangles), and T648M (squares). Saturation curves for ATP (orange), acetate (yellow), and CoA (blue). Error bars indicate the SD, n = 3. Lines are the best fit to Equations 1 (ATP and acetate) and 2 (CoA) in the STAR Methods. (C) Double-reciprocal plot illustrating the linear competitive inhibition pattern obtained when varying the concentration of MMV019721 at fixed variable concentrations of CoA and saturating concentrations of ATP and acetate. Points are data obtained with 0 (black), 20 (purple), 40 (orange), 60 (yellow), and 80 nM (green triangles) of MMV019721. The error bars indicate the SD, n = 3. Lines are the best fit of the entire dataset to Equation 4. (D) Double-reciprocal plot illustrating the linear mixed inhibition pattern obtained when varying the concentration of MMV084978 at fixed variable concentrations of acetate and saturating concentrations of ATP and CoA. Points are data obtained with 0 (black), 20 (purple), 40 (orange), 60 (yellow), and 80 nM (green squares) of MMV084978. The error bars indicate the SD, n = 3. Lines are the best fit of the entire dataset to Equation 5. Saturation curves for MMV019721 (E) and MMV084978 (F) against PfAcAS WT (black symbols), A597V (dark red symbols), T648M (red symbols), and HsAcAS (blue symbols). Error bars indicate the SD, n = 3. Lines are the best fit to Equation 3 and a linear fit for MMV084978 against PfAcAS A597V (dark red line). See also Figures S4 and S5 and Tables S5 and S6.
Figure 5
Figure 5
PfAcAS localizes to the nucleus and its inhibition affects histone acetylation state (A and B) (A) Immunofluorescence localization of PfAcAS using an HA-epitope-expressing construct throughout the life cycle of the parasite. Shown are representative images of early-, mid-, and late-stage trophozoite and schizont-stage parasites from a mixed-stage culture. PfAcAS-HA co-localized with DAPI DNA stain throughout the majority of the parasite life cycle, consistent with nuclear localization of PfAcAS. (B) Schematic representation of the proposed function of PfAcAS in the maintenance of acetyl-CoA available for histone acetylation by histone acetyltransferases (HAT), from free acetate generated by the activity of histone deacetylases (HDAC). (C) Dose-dependent reduction of histone acetylation by MMV019721 in wild-type 3D7 parasites but not in PfAcAS-T648M carrying drug-resistant parasites. Shown are representative western blots of a single experiment. (D) Dose-dependent reduction in histone acetylation by MMV019721 in Dd2 parent and not in A597V mutant parasites. Shown are representative western blots of a single experiment. See also Figures S6 and S7.

Comment in

References

    1. Allman E.L., Painter H.J., Samra J., Carrasquilla M., Llinás M. Metabolomic profiling of the malaria box reveals antimalarial target pathways. Antimicrob. Agents Chemother. 2016;60:6635–6649. - PMC - PubMed
    1. Andrews K.T., Gupta A.P., Tran T.N., Fairlie D.P., Gobert G.N., Bozdech Z. Comparative gene expression profiling of P. falciparum malaria parasites exposed to three different histone deacetylase inhibitors. PLoS One. 2012;7:e31847. - PMC - PubMed
    1. Antonova-Koch Y., Meister S., Abraham M., Luth M.R., Ottilie S., Lukens A.K., Sakata-Kato T., Vanaerschot M., Owen E., Jado J.C., et al. Open-source discovery of chemical leads for next-generation chemoprotective antimalarials. Science. 2018;362:eaat9446. - PMC - PubMed
    1. Balaji S., Babu M.M., Iyer L.M., Aravind L. Discovery of the principal specific transcription factors of Apicomplexa and their implication for the evolution of the AP2-integrase DNA binding domains. Nucleic Acids Res. 2005;33:3994–4006. - PMC - PubMed
    1. Bryant J.M., Baumgarten S., Dingli F., Loew D., Sinha A., Claës A., Preiser P.R., Dedon P.C., Scherf A. Exploring the virulence gene interactome with CRISPR/dCas9 in the human malaria parasite. Mol. Syst. Biol. 2020;16:e9569. - PMC - PubMed

Publication types

MeSH terms

LinkOut - more resources