. 2021 Sep 7;33(9):1836-1852.e11.
doi: 10.1016/j.cmet.2021.07.010. Epub 2021 Aug 3.

Isthmin-1 is an adipokine that promotes glucose uptake and improves glucose tolerance and hepatic steatosis

Affiliations

Isthmin-1 is an adipokine that promotes glucose uptake and improves glucose tolerance and hepatic steatosis

Zewen Jiang et al. Cell Metab. .

Abstract

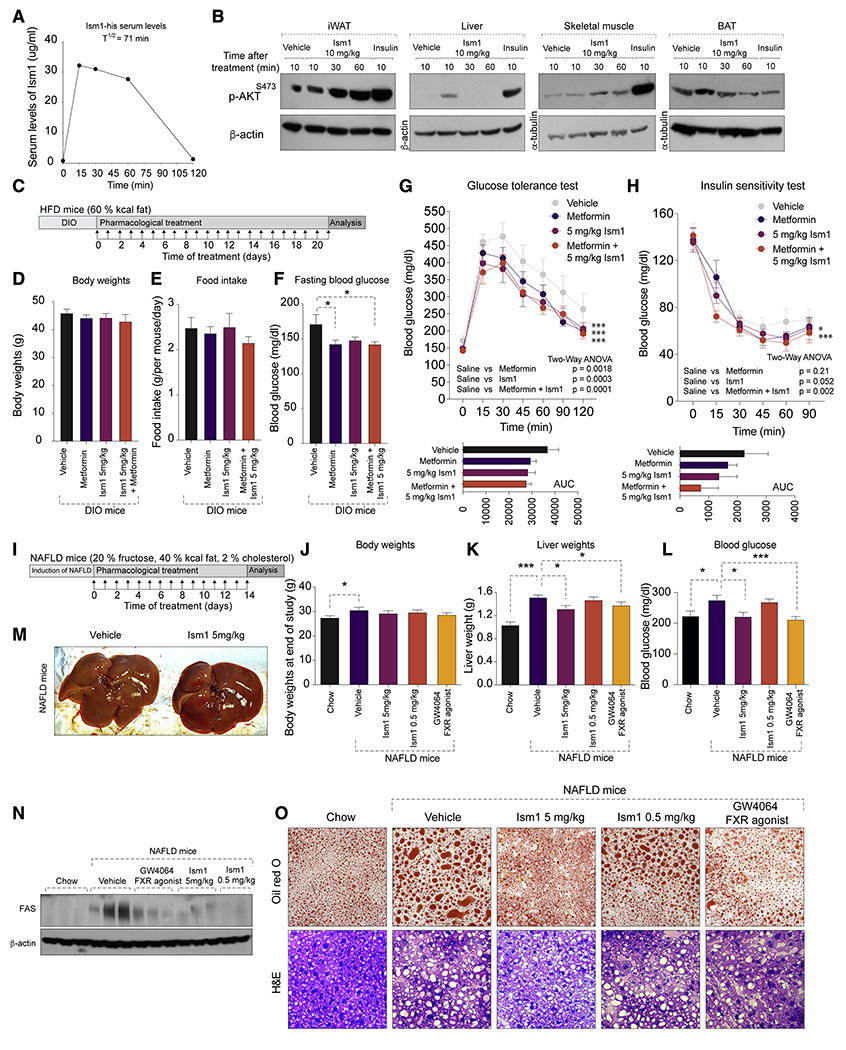
With the increasing prevalence of type 2 diabetes and fatty liver disease, there is still an unmet need to better treat hyperglycemia and hyperlipidemia. Here, we identify isthmin-1 (Ism1) as an adipokine and one that has a dual role in increasing adipose glucose uptake while suppressing hepatic lipid synthesis. Ism1 ablation results in impaired glucose tolerance, reduced adipose glucose uptake, and reduced insulin sensitivity, demonstrating an endogenous function for Ism1 in glucose regulation. Mechanistically, Ism1 activates a PI3K-AKT signaling pathway independently of the insulin and insulin-like growth factor receptors. Notably, while the glucoregulatory function is shared with insulin, Ism1 counteracts lipid accumulation in the liver by switching hepatocytes from a lipogenic to a protein synthesis state. Furthermore, therapeutic dosing of recombinant Ism1 improves diabetes in diet-induced obese mice and ameliorates hepatic steatosis in a diet-induced fatty liver mouse model. These findings uncover an unexpected, bioactive protein hormone that might have simultaneous therapeutic potential for diabetes and fatty liver disease.

Keywords: adipokine; cellular signaling; diabetes; glucose uptake; hepatic steatosis; lipogenesis.


Conflict of interest statement

Declaration of interests The authors declare no competing interests.

Figures

Figure 1.
Figure 1.. Ism1 is an adipokine that induces glucose uptake in human and mouse adipocytes
(A) LC-MS analysis detection of mouse Ism1 peptides in red from adipocyte conditioned media (n = 2). Representative of 2 biological replicates. (B) LC-MS analysis using TMT-labeling demonstrating relative Ism1 protein secretion in conditioned media from wt (n = 2) or ap2-prdm16tg (n = 2) adipocytes. Representative of 2 biological replicates. (C) qRT-PCR of Ism1, Adipoq, Pparg and Pdgfr-a in isolated mature brown fat adipocytes and in the stromal vascular fraction (n = 3). 1 technical replicate of 3 biological samples. (D) Representative western blots (n = 2 in total) of Ism1 and β-actin in isolated mature brown fat adipocytes and in the stromal vascular fraction. Recombinant Ism1 protein was used as standard. (E)Ism1 gene expression levels in brown fat adipocytes during differentiation (n = 3). 1 technical replicate of 3 biological samples. (F) Representative silverstain and Ism1 immunoblot (n = 3 in total) of native and deglycosylated recombinant mouse Ism1. (G) Representative size exclusion chromatography (n = 2 in total) of recombinant Ism1 protein under native conditions. (H) Representative LC-MS analysis of recombinant Ism1 protein showing high purity by spectral counts and number of unique peptides (1 biological replicate). (I) 2-deoxy-H3-glucose uptake in human SGBS adipocytes treated with insulin or Ism1 protein for 30 minutes (n=6). 1 technical replicate of 6 biological samples. (J) 2-deoxy-H3-glucose uptake in mouse primary adipocytes treated with control or Ism1 (n = 15). 1 technical replicate of 15 biological samples across four biologically independent experiments. (K) 2-deoxy-H3-glucose uptake in mouse primary adipocytes treated with insulin, Ism1, or a combination of Ism1 and insulin for 1h (n = 3). 1 technical replicate of 3 biological samples. (L) 2-deoxy-H3-glucose uptake in human primary skeletal muscle cells treated with Ism1 or insulin for 1h (n = 3). 1 technical replicate of 3 biological samples. (M) Representative images (n = 4 of two biological samples) of membrane localization of GLUT4 in primary adipocytes after treatment with 100 nM insulin or 100 nM Ism1 protein for 24 hours. (N) Representative protein levels of Glut4 in isolated plasma membranes in primary mouse adipocytes (n = 3 biological samples) treated with 100 nM Ism1 protein or 100 nM insulin for 4h compared with the cytosolic fractions. Pdgfr-α is used as loading control. (O)Ism1 and Adipoq gene expression levels in lacZ-shRNA or Ism1-shRNA adipocytes (n = 4). (P) 2-deoxy-H3-glucose uptake in lacZ-shRNA or Ism1-shRNA adipocytes (n = 4 biological replicates). (Q) Representative western blot (n = 2 in total) of pAKTS473, total AKT and β-actin in lacZ-shRNA or Ism1-shRNA adipocytes. (R) Quantification of pARTS473/total ART protein expression quantified from two independent experiments (n = 2 biological replicates in total from 2 independent experiments) in lacZ-shRNA or Ism1-shRNA adipocytes. (S) 2-deoxy-H3-glucose uptake in Ism1-shRNA adipocytes treated with indicated concentrations of insulin for 1h compared with lacZ-shRNA (n = 3 biological replicates). (T) Representative western blot (n = 1 biological replicate of 2 biological samples) of pAKTS473, total AKT, and β-actin in lacZ-shRNA or Ism1-shRNA adipocytes treated with indicated concentrations of insulin for 5 min. (U) Quantification of protein expression pAKTS473/total AKT quantified from 2 independent experiments with 1 replicate per sample. Data are presented as mean ± S.E.M of biologically independent samples. *P < 0.05, **P < 0.01, ***P < 0.001 by two-tailed Student’s t-test (c, e, i, j, k, 1, o, p, r, s, u).
Figure 2.
Figure 2.. Ablation of Ism1 results in glucose intolerance and impaired adipocyte glucose uptake
(A)Ism1 gene expression in different tissues from WT and Ism1-KO mice (n = 5-8 biological replicates). (B) ISM1 serum levels in male WT and Ism1-KO mice using an ISM1 ELISA (n = 5-8 biological replicates). (C) Body temperature in male WT and Ism1-KO mice (n = 5-8 biological replicates). (D) Food intake in male WT and Ism1-KO mice (n = 5-8 biological replicates). (E) Insulin levels in male WT and Ism1-KO mice (n = 5-8 biological replicates). (F) Body weights in male WT and male WT and Ism1-KO mice (n = 5-6 biological replicates). (G) Insulin tolerance test in male WT and Ism1-KO mice (n = 10-14 biological replicates). (H) Glucose tolerance test in male WT and Ism1-KO mice (n = 10-14 biological replicates). (I) In vivo 2-deoxy- H3-glucose uptake in brown adipose tissue (BAT), white inguinal adipose tissue (iWAT), quadriceps skeletal muscle (Quad), and liver from three cohorts of mice on chow, HFD or NAFLD diet (n = 5-8 biological replicates). (J) In vivo 2-deoxy- H3-glucose uptake in brown adipose tissue (BAT) in male WT and Ism1-KO mice under basal and insulin-stimulated conditions (n = 5 biological replicates). (K) In vivo 2-deoxy- H3-glucose uptake in brown adipose tissue (BAT), white inguinal adipose tissue (iWAT), quadriceps skeletal muscle (Quad), and liver in male Ism1-KO mice treated with 5 mg/kg Ism1 protein for two days (n = 6-7 biological replicates). (L)Ism1 and Adipoq gene expression in differentiated adipocytes isolated from WT and Ism1-KO (n = 4 biological replicates, 1 technical replicate per sample). (M) Oil red O staining of differentiated adipocytes isolated from WT and Ism1-KO mice (n = 3 biological replicates). (N) Representative western blot (n = 2 in total) of pAKTS473, total AKT, and β-actin in mouse adipocytes isolated from WT and Ism1-KO mice. (O) Quantification of protein expression pAKTS473/total AKT quantified from two independent experiments (n = 2 in total per experiment). (P) Representative western blot (n = 2 in total) of pAKTS473, total AKT, and β-actin in mouse adipocytes isolated from WT and Ism1-KO mice treated with indicated concentrations of insulin. (Q) 2-deoxy-H3-glucose uptake in differentiated adipocytes isolated from WT and Ism1-KO mice treated with indicated concentrations of insulin (n = 4 biological replicates). Data are presented as mean ± S.E.M of biologically independent samples. *P < 0.05, **P < 0.01, ***P < 0.001 by one-or two-tailed Student’s t-test (a, c, d, e, f, I, j, k, 1, o, q), Mann Whitney test (b), or two-way Anova (g, h).
Figure 3.
Figure 3.. Ism1 activates the PI3K-AKT pathway
(A) Phosphokinase array quantification of 3T3-F442A cells treated with vehicle (control) or 100 nM Ism1 (1 technical replicate of 3 combined biological replicates per group). (B) Representative western blot (n = 1 biological replicates in total) of pAKTS473 and AKT in 3T3-F442A cells treated with vehicle (ctl) Ism1-flag, Ism1-his, Thrombospondin-his (TSP-his) or insulin at 100 nM. (C) Representative western blot (n = 2 in total) of pAKTS473, AKT, and β-actin in mouse BAT adipocytes treated with indicated concentrations of Ism1 or insulin. (D) Representative western blot (n = 2 in total) of pAKTS473, AKT, and β-actin in mouse adipocytes treated with indicated concentrations of Ism1 or insulin. (E) Representative western blot (n = 2 in total) of pAKTS473 and AKT in mouse adipocytes treated with 100 nM recombinant Ism1 or 10 nM insulin at different time points. (F) Representative western blot (n = 2 in total) of pAKTS473, AKT, and β-actin in human SGBS adipocytes treated with indicated concentrations of Ism1 or insulin. (G) Representative western blot (n = 2 in total) of pAKTS473 and AKT in 3T3-F442A cells treated with Ism1 or insulin with indicated concentrations. (H) AlphaLISA SureFire Ultra AKT 1/2/3 (pS473) measurements in 3T3-F442A cells treated with recombinant Ism1 or insulin (n = 3 biological replicates). (I) Representative western blot (n = 2 in total) of 3T3-F442A cells treated with 100 nM ISM1, 100 nM insulin, or 20 ng/ml Pdgf-ββ showing the intracellular signaling pathways over time. Data are presented as mean ± S.E.M of biologically independent samples. For all western blots, all protein treatments are 5 mins unless indicated otherwise.
Figure 4.
Figure 4.. Ism1 signaling is independent of the Insulin-and IGF receptors
(A) Representative western blot (n = 2 in total) of pAKTS473 signaling induced by Ism1 (100nM) or insulin (100 nM) in 3T3-F442A cells pre-treated with PI3K inhibitors wortmannin, LY294002, orPIK-75, mTORC1 inhibitor rapamycin, mTORC1/2 dual inhibitor torin, or the PI3K-mTOR inhibitor Omipalisib. (B) 2-deoxy-H3-glucose uptake in mouse primary adipocytes treated with recombinant mouse Ism1 protein in the absence or presence of 1 μM wortmannin (n = 3 biological replicates). (C) Representative western blot (n = 2 in total) of pAKTS473 signaling induced by Ism1 (100nM) or insulin (100 nM) in 3T3-F442A cells pre-treated for 30 min with the selective mTOR inhibitor INK-128. (D) Representative western blot (n = 2 in total) of pAKTS473 signaling induced by Ism1 (100nM) or insulin (100 nM) in 3T3-F442A cells pre-treated for 30 min with S6K inhibitor DG2. (E) Representative western blot (n = 2 in total) of pAKTS473, AKT, and β-actin in 3T3-F442A cells treated with insulin in the presence of 0 nM, 25 nM or 50 nM Ism1. (F) Representative western blot (n = 2 in total) phosphorylated insulin-and IGF receptors in 3T3-F442A cells treated with 100 nM Ism1 or 100 nM insulin for 2 min. (G) Representative western blot (n = 2 in total) of signaling induced by Ism1 (100nM) or insulin (100 nM) in 3T3-F442A cells pre-treated for 30 min with the IR-IGF1R inhibitor OSI-906. (H) 2-deoxy-H3-glucose uptake in human SGBS adipocytes treated with Ism1 (100nM) in the absence or presence of 50 nM OSI-906 (n=3 biological replicates). (I) Schematic illustration of the signaling pathway activated by Ism1. For western blots, all protein treatment are 5 mins unless indicated otherwise. Data are presented as mean ± S.E.M of biologically independent samples. *P < 0.05 and ***P< 0.001 (b, h) by two-tailed Student’s t-test (b, h).
Figure 5.
Figure 5.. Ism1-AAV overexpression prevents insulin resistance and hepatic steatosis in DIO mice
(A) Overview of prophylactic Ism1 overexpression in diet-induced obese (DIO) mice fed a HFD at the start of the experiment. (B) Representative western blot of plasma from AAV8-GFP and AAV8-Ism1-flag using an anti-FLAG antibody detecting the C-terminal flag tag of Ism1 (n = 3 mice per group). (C) Body weights in AAV8-GFP and AAV8-Ism1 mice measured during 10 weeks of HFD (n = 10 mice per group). (D-F) Glucose tolerance test (D), Insulin sensitivity test (E), plasma insulin levels (F) in mice expressing AAV8-GFP and AAV8-Ism1 after 10 weeks of HFD (n = 10 mice per group). (G) Plasma glucose levels during hyperinsulinemic-euglycemic clamp in AAV8-GFP and AAV8-Ism1 mice at 3 weeks of HFD (n = 5-8 mice per group). (H) Glucose infusion rate (GIR) during hyperinsulinemic-euglycemic clamp in AAV8-GFP and AAV8-Ism1 mice at 3 weeks of HFD (n = 5-8 mice per group). (I) Basal endogenous glucose production in AAV8-GFP and AAV8-Ism1 mice at 3 weeks HFD (n = 5-8 mice per group). (J) Endogenous glucose production under clamped conditions in AAV8-GFP and AAV8-Ism1 mice at 3 weeks of HFD (n = 5-8 mice per group). (K) Representative (n = 5 images in total from 5 mice) H&E and Oil red O staining in livers from AAV8-GFP and AAV8-Ism1 mice. (L) Gene expression levels of hepatic lipogenesis genes in AAV8-GFP and AAV8-Ism1 mice (n = 10 mice per group, 1 technical replicate per sample). (M) Liver triglycerides quantification in AAV-GFP and AAV8-Ism1 mice after 10 weeks on HFD (n = 10 mice per group, 1 technical replicate per sample). Data are presented as mean ± S.E.M of biologically independent samples. *P < 0.05, **P < 0.01, ***P < 0.001 by two-tailed Student’s t-test (f, I, j, l, m) or two-way Anova (c, d, e, g, h).
Figure 6.
Figure 6.. Ism1 suppresses de novo lipogenesis and promotes protein synthesis in hepatocytes
(A) Gene expression levels of Ism1 and Srebp1c in primary hepatocytes overexpressing lacZ or Ism1 (n = 3 biological replicates). (B) H3-acetate incorporation into lipids (de novo lipogenesis) in AML12 hepatocytes treated with Ism1 for 24h in the presence or absence of insulin (n = 3 biological replicates). (C) Representative western blot (n = 2 in total) of Srebp1c, Fas, Acc and β-actin in AML12 hepatocytes treated with Ism1 for 24h in the presence or absence of insulin. (D-G) Gene expression of lipogenic genes in AML12 hepatocytes after 6h treatment with Ism1 in the presence or absence of insulin (n = 3 biological replicates). (H) Representative western blot (n = 2 in total) of S6s235/236, AKTS473, ART and β-actin in AML12 hepatocytes treated with Ism1 for 24h in the presence or absence of insulin. (I) Quantification of S6s235/236 relative β-actin in control, 50 nM Ism1 and 100 nM Ism1 from combined treatments in H (n = 6 biological replicates in total). (J) H3-leucine incorporation into proteins (protein synthesis) in AML12 hepatocytes treated with Ism1 for 24h in the presence or absence of 50 nM (n = 3 biological replicates). (K) Fold change of substrate incorporation as a measure of lipogenesis or protein synthesis in AML12 hepatocytes treated with 50 nM insulin alone or 100 nM Ism1 and 50 nM insulin combined for 24h (n = 3 biological replicates). Data are presented as mean ± S.E.M of biologically independent samples. *P < 0.05, **P < 0.01, ***P < 0.001 by two-tailed Student’s t-test (a, b, d, e, f, g, k) or Tukey’s multiple comparisons test (i, j).
Figure 7.
Figure 7.. Therapeutic administration of recombinant Ism1 improves glucose tolerance and hepatic steatosis
(A) Representative pharmacokinetic levels of serum Ism1-his using an anti-his-ELISA after I.V. injection of 10 mg/kg Ism1 in C5BL/6J mice (n = 2 in total). (B) Representative western blot (n = 2 in total) of pAKTS473, total ART, β-actin or tubulin in metabolic tissues after a single I.V. injection of 10 mg/kg recombinant Ism1 or 1U/kg insulin in 16 weeks DIO C5BL/6J male mice. (C) Overview of therapeutic administration of Ism1 protein by daily I.P. injections of 5 mg/kg Ism1, or oral administration of 100 mg/kg metformin, or a combination of both into 12 weeks DIO mice for 21 days. (D-H) Body weights (D), Food intake (E), fasting blood glucose (F), GTT (G), and ITT (H) after 21 days of daily administration of either vehicle, 5 mg/kg Ism1, 100 mg/kg metformin, or a combination of 5 mg/kg Ism1 and 100mg/kg metformin. (n = 6-12 mice per group). (I) Overview of therapeutic administration with vehicle, 5 mg/kg Ism1, 0.5 mg/kg Ism1, or 30 mg/kg GW4064 for 14 days in NAFLD-induced mice. (J-L) Body weights (J), liver weights (K), fed blood glucose (L) of chow (control) mice, or mice with NAFLD treated with either vehicle, 5 mg/kg Ism1, 0.5 mg/kg Ism1, or 30 mg/kg GW4064 for 14 days (n = 5 mice per group). (M) Representative macroscopic liver photographs from mice (n = 5 in total) treated with vehicle or 5mg/kg Ism1 for 14 days. (N) Representative western blots (n = 5 in total) of Fas protein levels in livers from chow (control) mice, or mice with NAFLD treated with vehicle, 5 mg/kg Ism1, 0.5 mg/kg Ism1, or 30 mg/kg GW4064 for 14 days (n = 5 mice per group). (O) Representative H&E and Oil red O (lipid) staining (10 images per 5 biological replicates in total) in livers from chow (control) mice, or mice with NAFLD treated with vehicle, 5 mg/kg Ism1, 0.5 mg/kg Ism1, or 30 mg/kg GW4064 for 14 days (n = 5 mice per group). Data are presented as mean ± S.E.M of biologically independent samples. *P < 0.05, **P < 0.01, ***P < 0.001 by two-tailed Student’s t-test (d, e, f, j, k, l) and Two-Way Anova (g, h).

Comment in

References

    1. Bhatnagar S, Dammron HA, Hillgartner FB, 2009. Fibroblast growth factor-19, a novel factor that inhibits hepatic fatty acid synthesis. J. Biol. Chem 284, 10023–10033. - PMC - PubMed
    1. Chen Y, Zeng X, Huang X, Serag S, Woolf CJ, Spiegelman BM, 2017. Crosstalk between KCNK3-Mediated Ion Current and Adrenergic Signaling Regulates Adipose Thermogenesis and Obesity. Cell 171, 836–848.e13. - PMC - PubMed
    1. Chondronikola M, Volpi E, Børsheim E, Porter C, Annamalai P, Enerbäck S, Lidell ME, Saraf MK, Labbe SM, Hurren NM, Yfanti C, Chao T, Andersen CR, Cesani F, Hawkins H, Sidossis LS, 2014. Brown adipose tissue improves whole-body glucose homeostasis and insulin sensitivity in humans. Diabetes 63, 4089–4099. - PMC - PubMed
    1. Cohen P, Levy JD, Zhang Y, Frontini A, Kolodin DP, Svensson KJ, Lo JC, Zeng X, Ye L, Khandekar MJ, Wu J, Gunawardana SC, Banks AS, Camporez JPG, Jurczak MJ, Kajimura S, Piston DW, Mathis D, Cinti S, Shulman GI, Seale P, Spiegelman BM, 2014. Ablation of PRDM16 and beige adipose causes metabolic dysfunction and a subcutaneous to visceral fat switch. Cell 156, 304–316. - PMC - PubMed
    1. Crimarco A, Springfield S, Petlura C, Streaty T, Cunanan K, Lee J, Fielding-Singh P, Carter MM, Topf MA, Wastyk HC, Sonnenburg ED, Sonnenburg JL, Gardner CD, 2020. A randomized crossover trial on the effect of plant-based compared with animal-based meat on trimethylamine-N-oxide and cardiovascular disease risk factors in generally healthy adults: Study With Appetizing Plantfood-Meat Eating Alternative Trial (SWAP-M. Am. J. Clin. Nutr 112, 1188–1199. - PMC - PubMed

Publication types