. 2021 Aug 3;36(5):109487.
doi: 10.1016/j.celrep.2021.109487.

Ketogenesis impact on liver metabolism revealed by proteomics of lysine β-hydroxybutyrylation

Affiliations

Ketogenesis impact on liver metabolism revealed by proteomics of lysine β-hydroxybutyrylation

Kevin B Koronowski et al. Cell Rep. .

Abstract

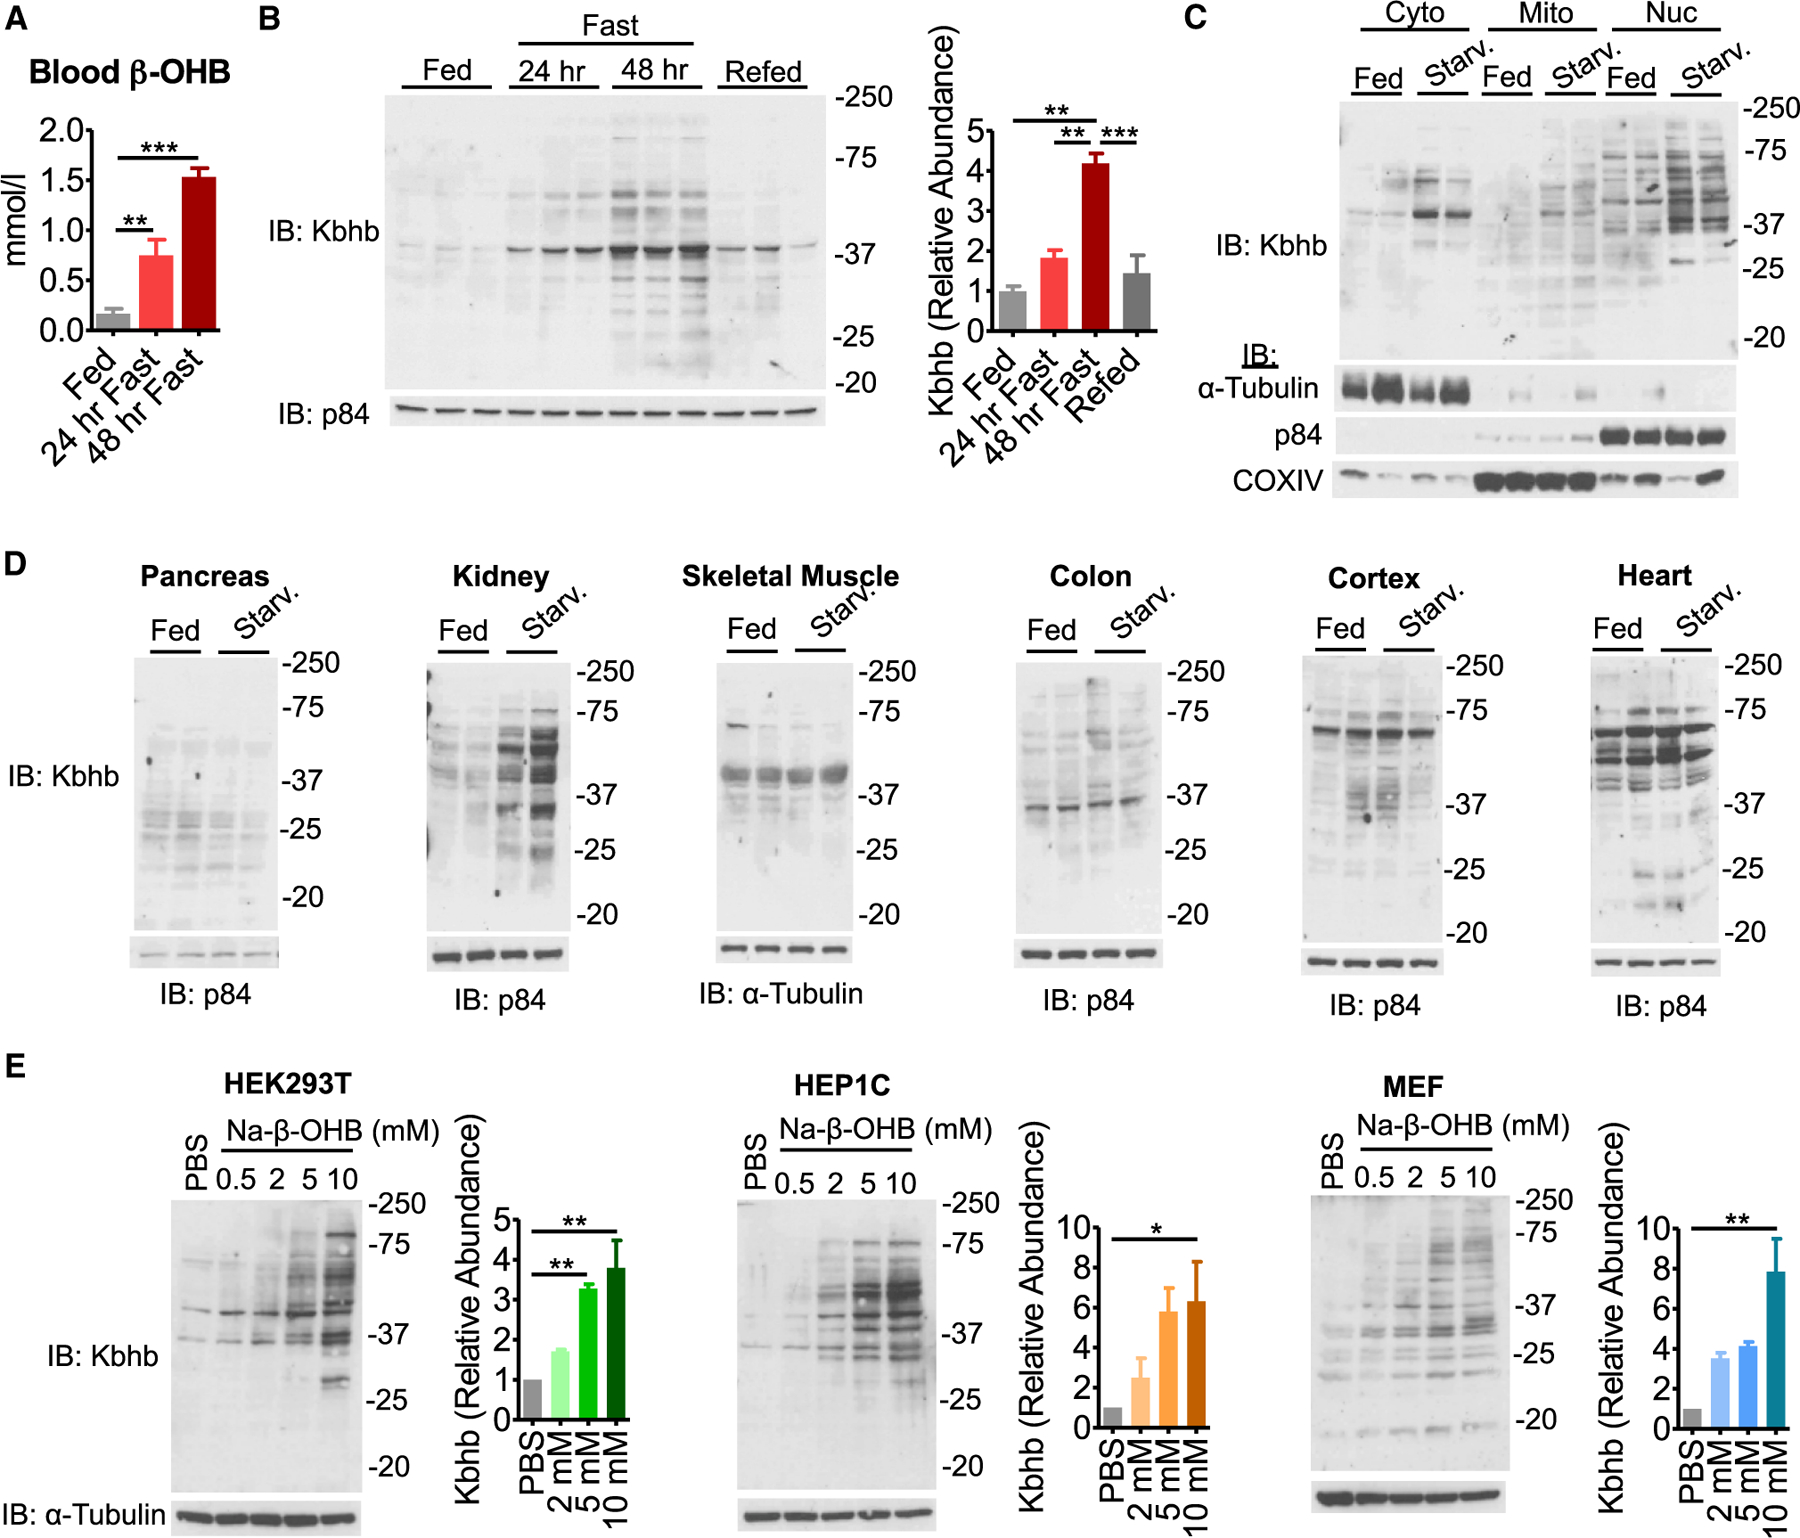
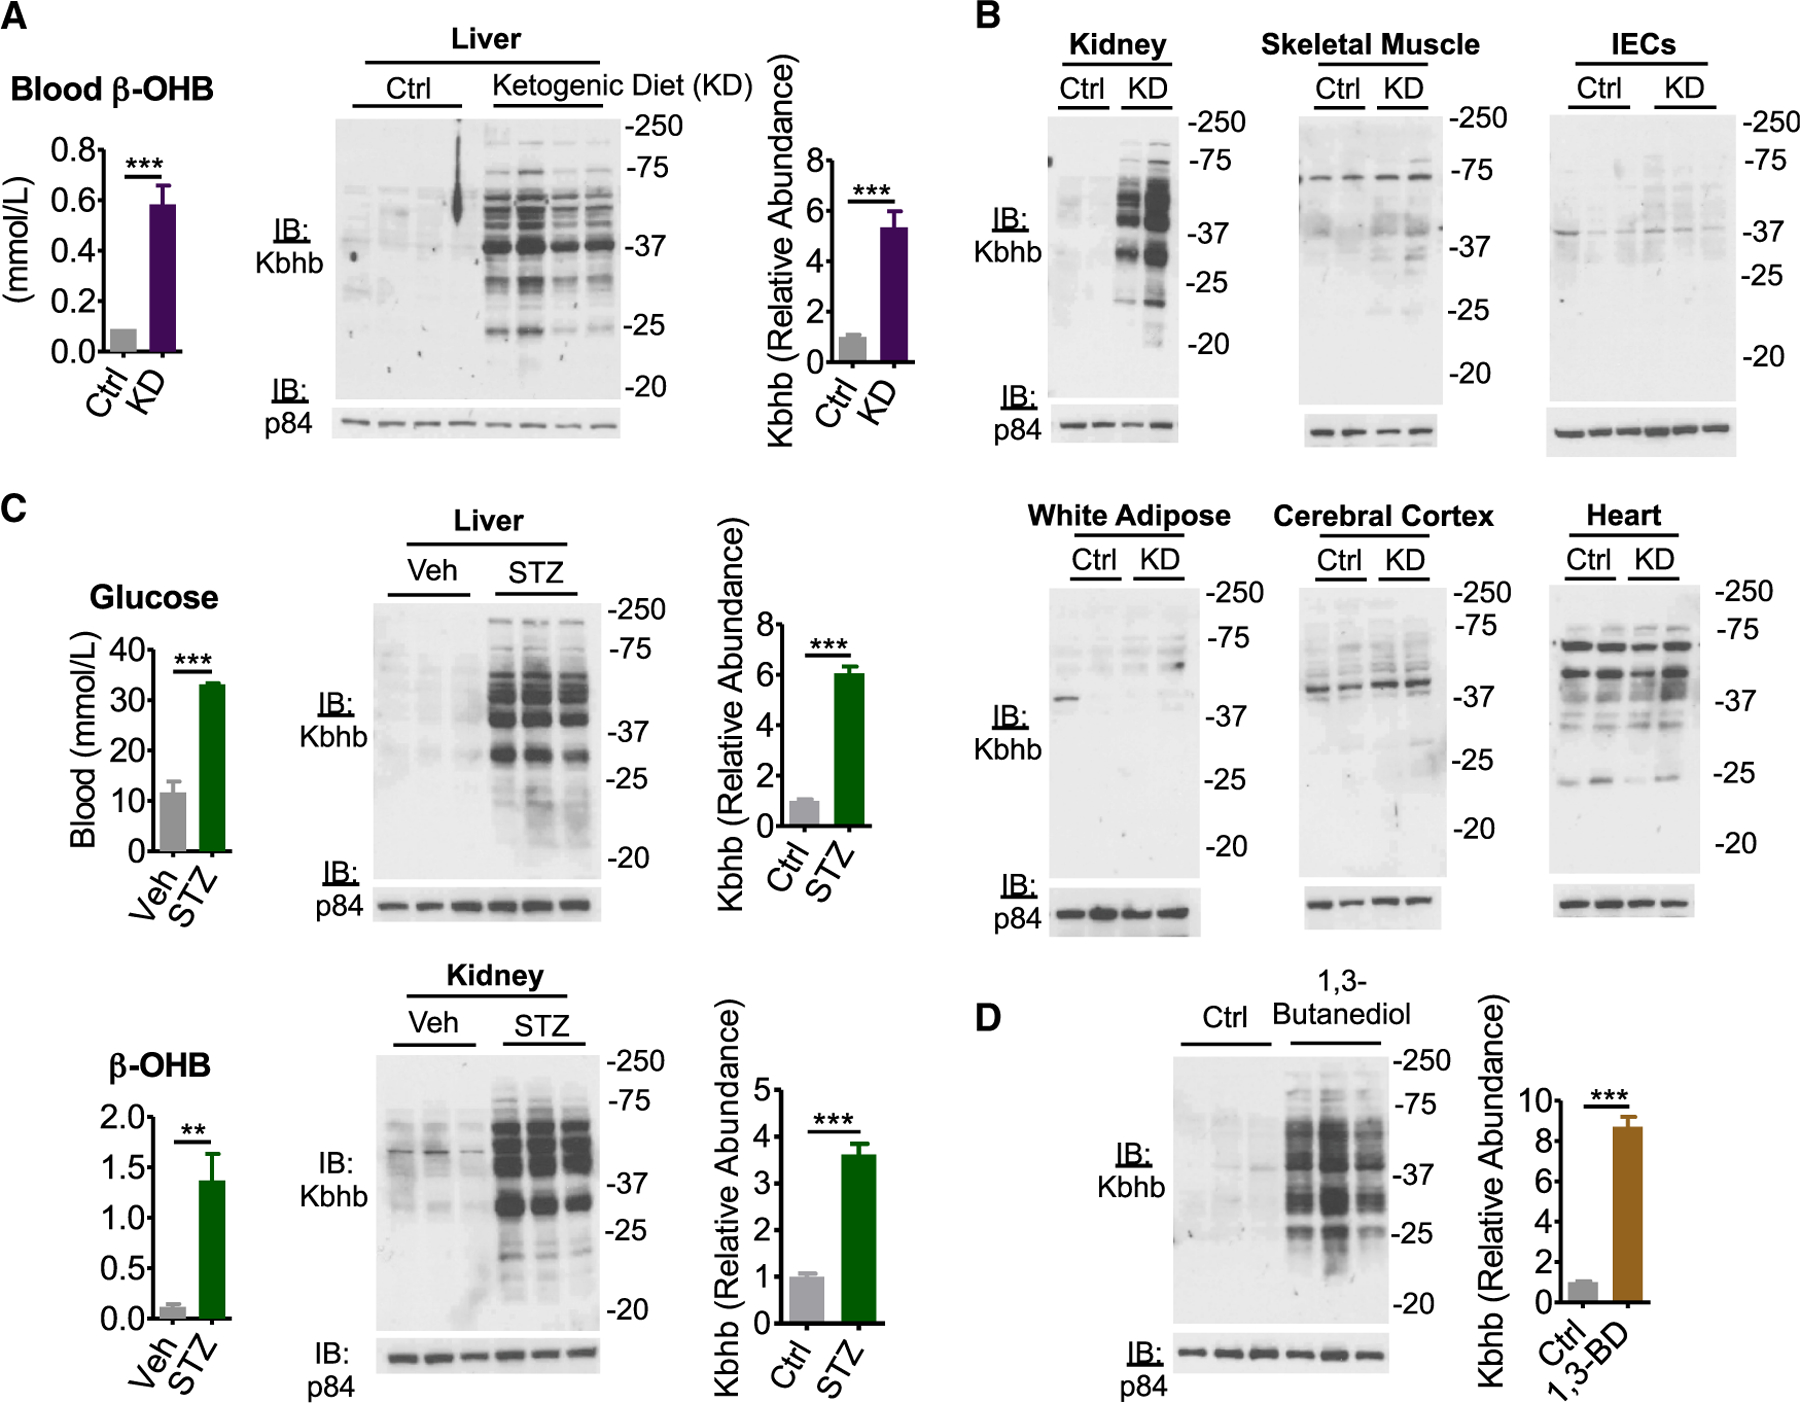
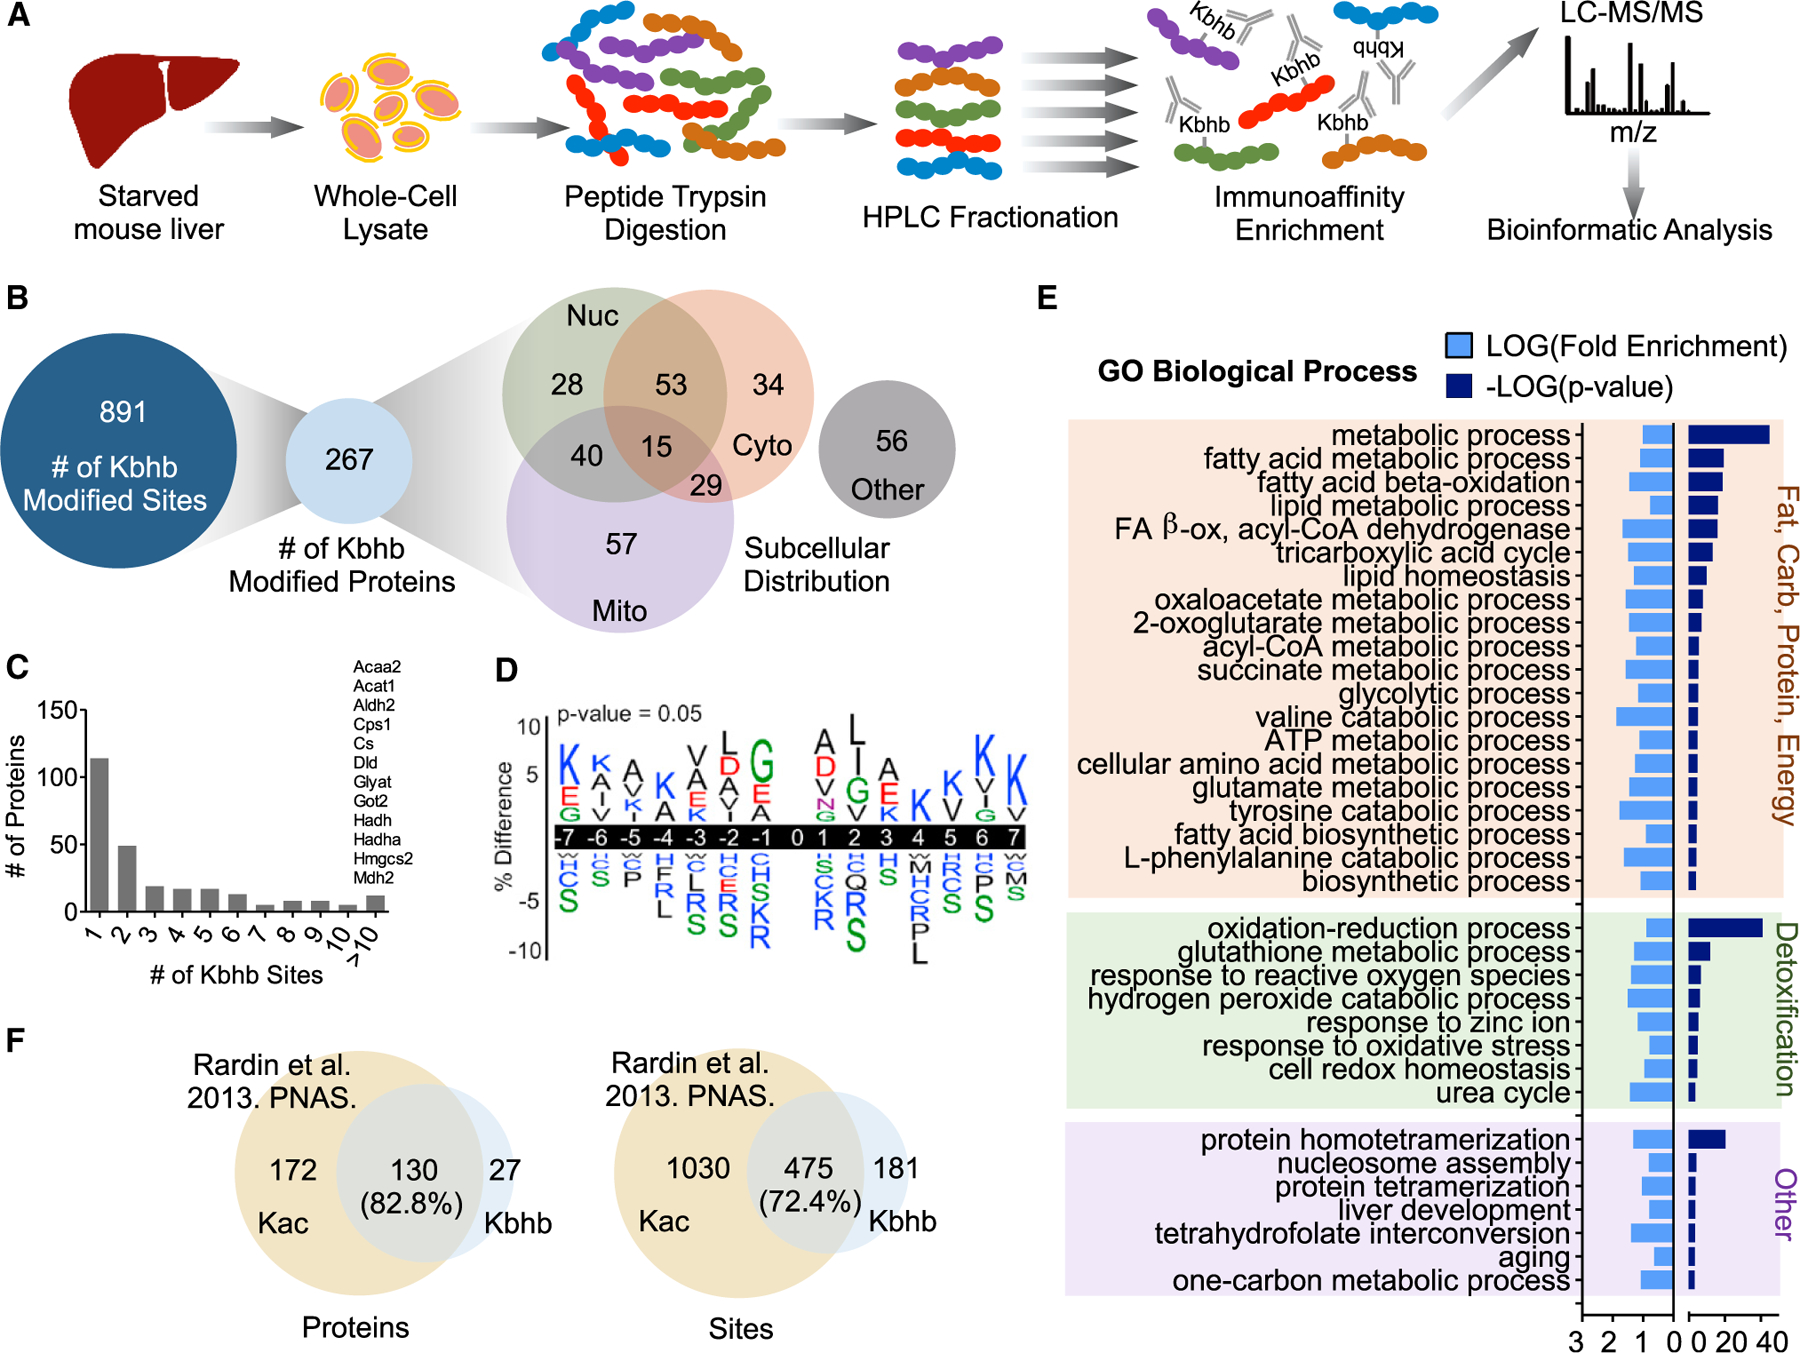
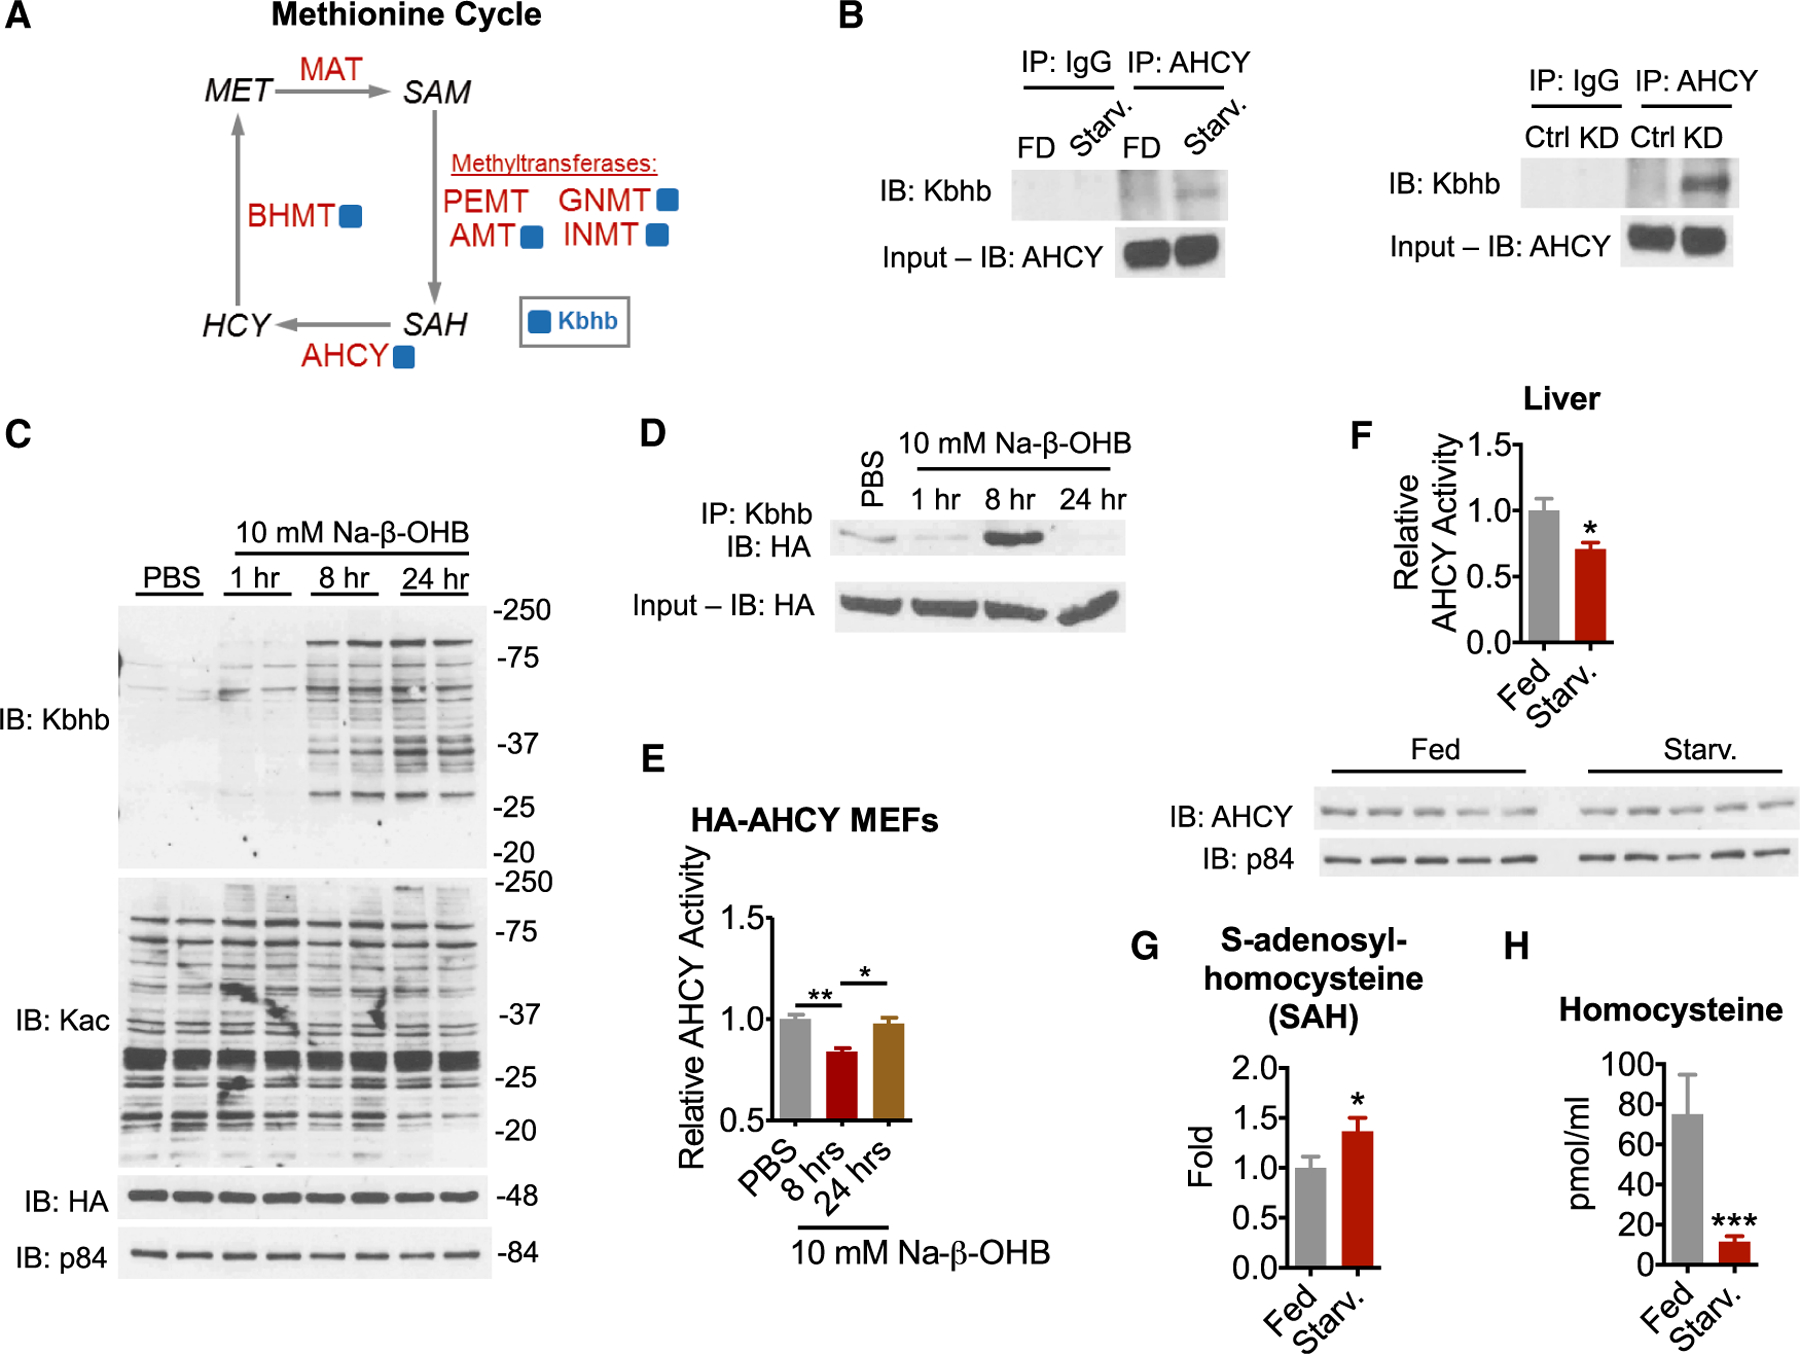
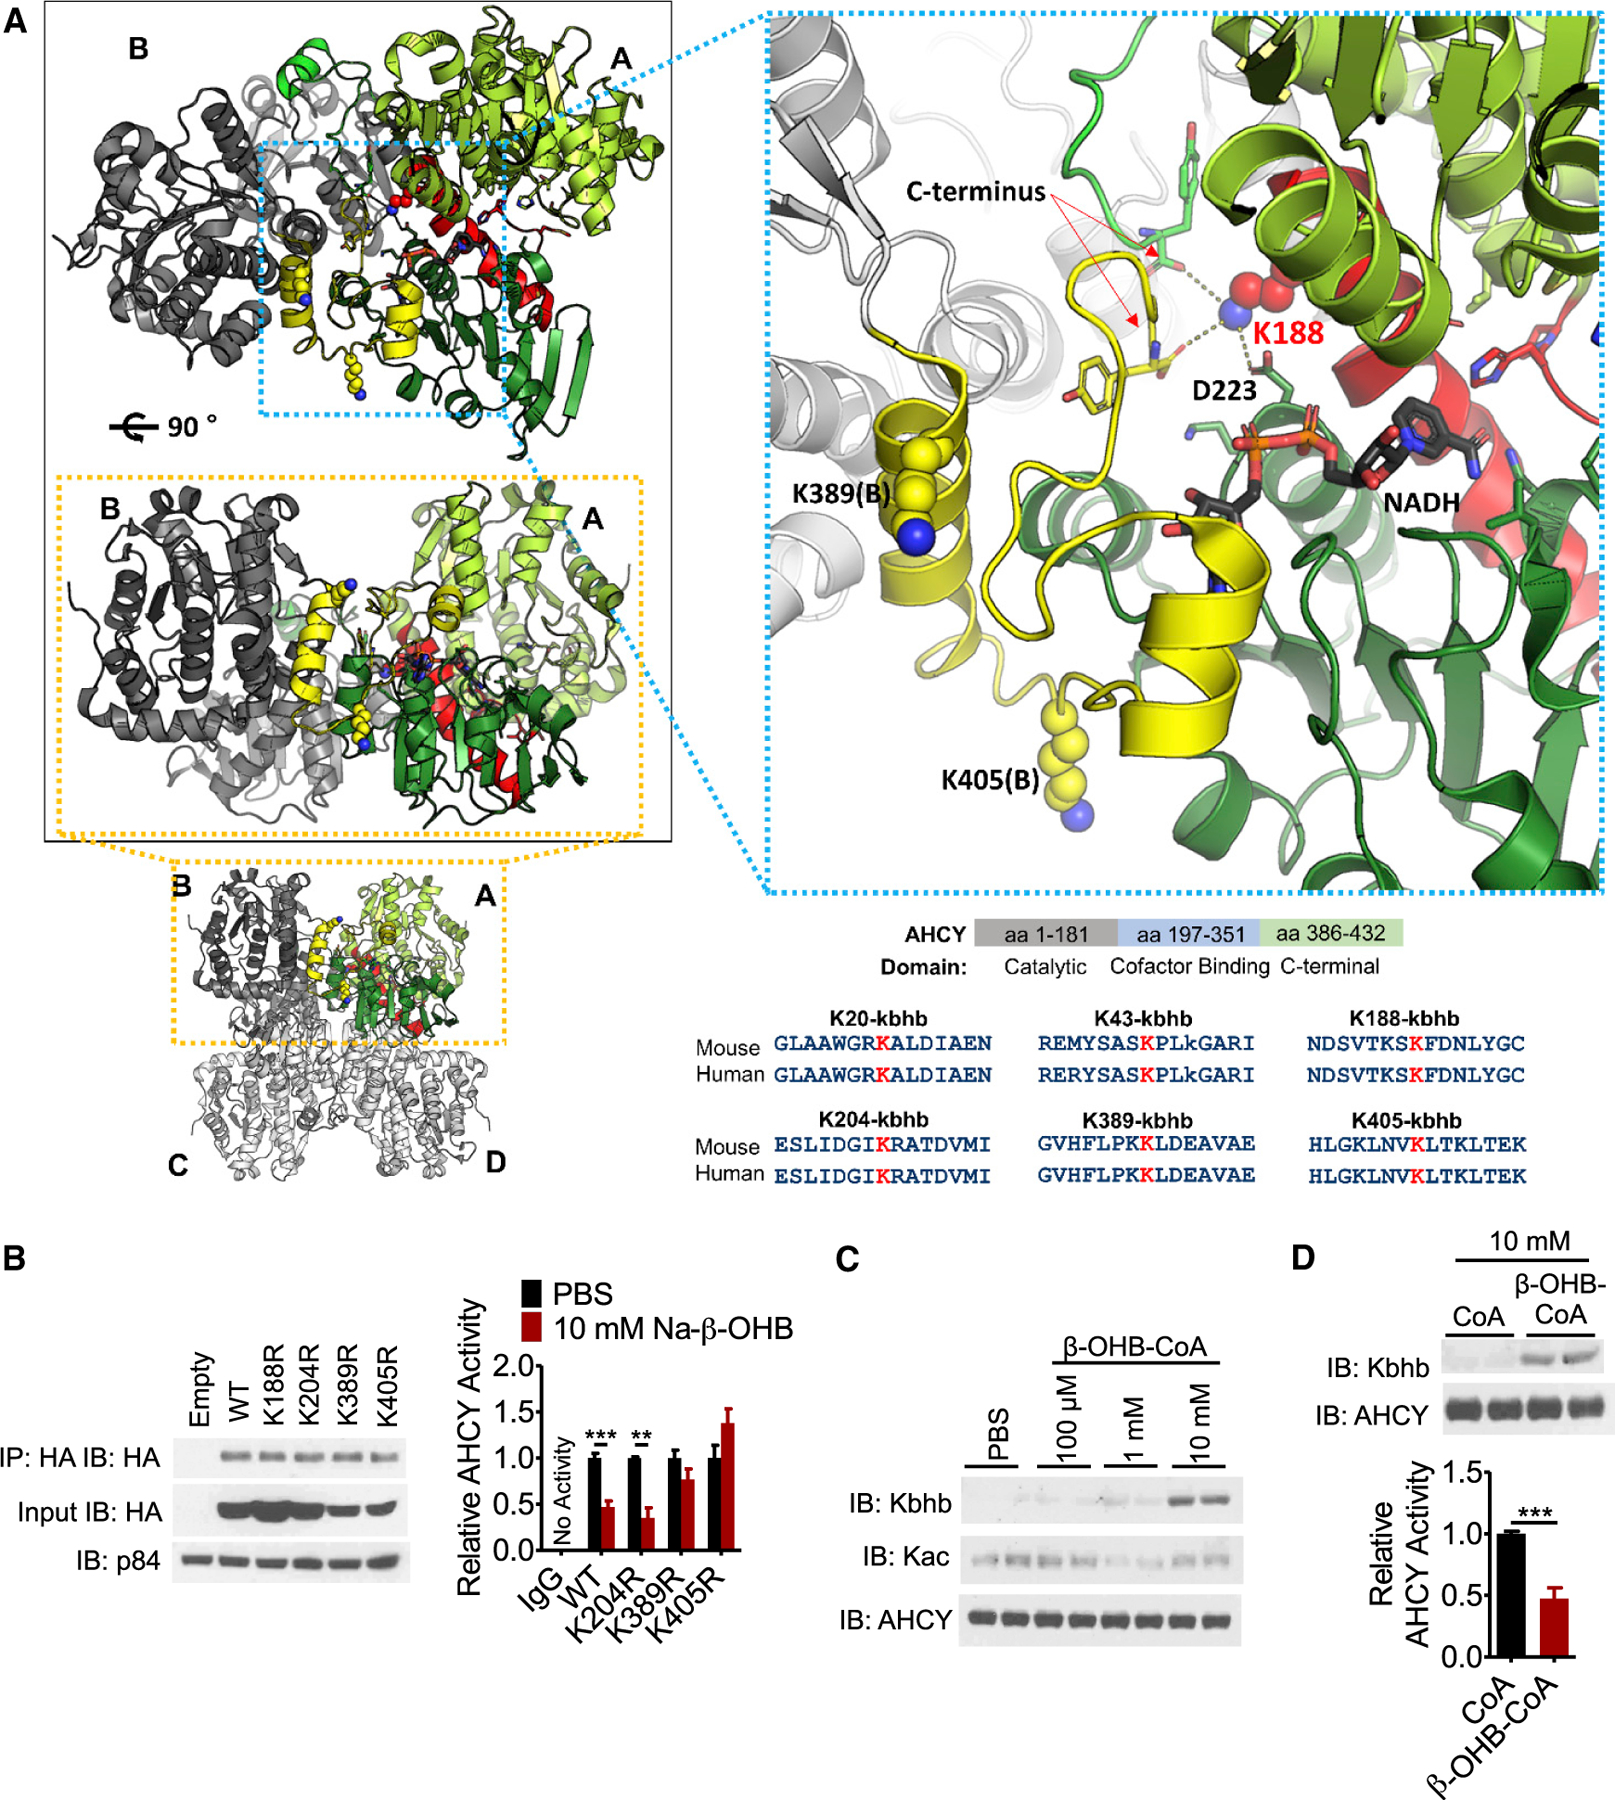
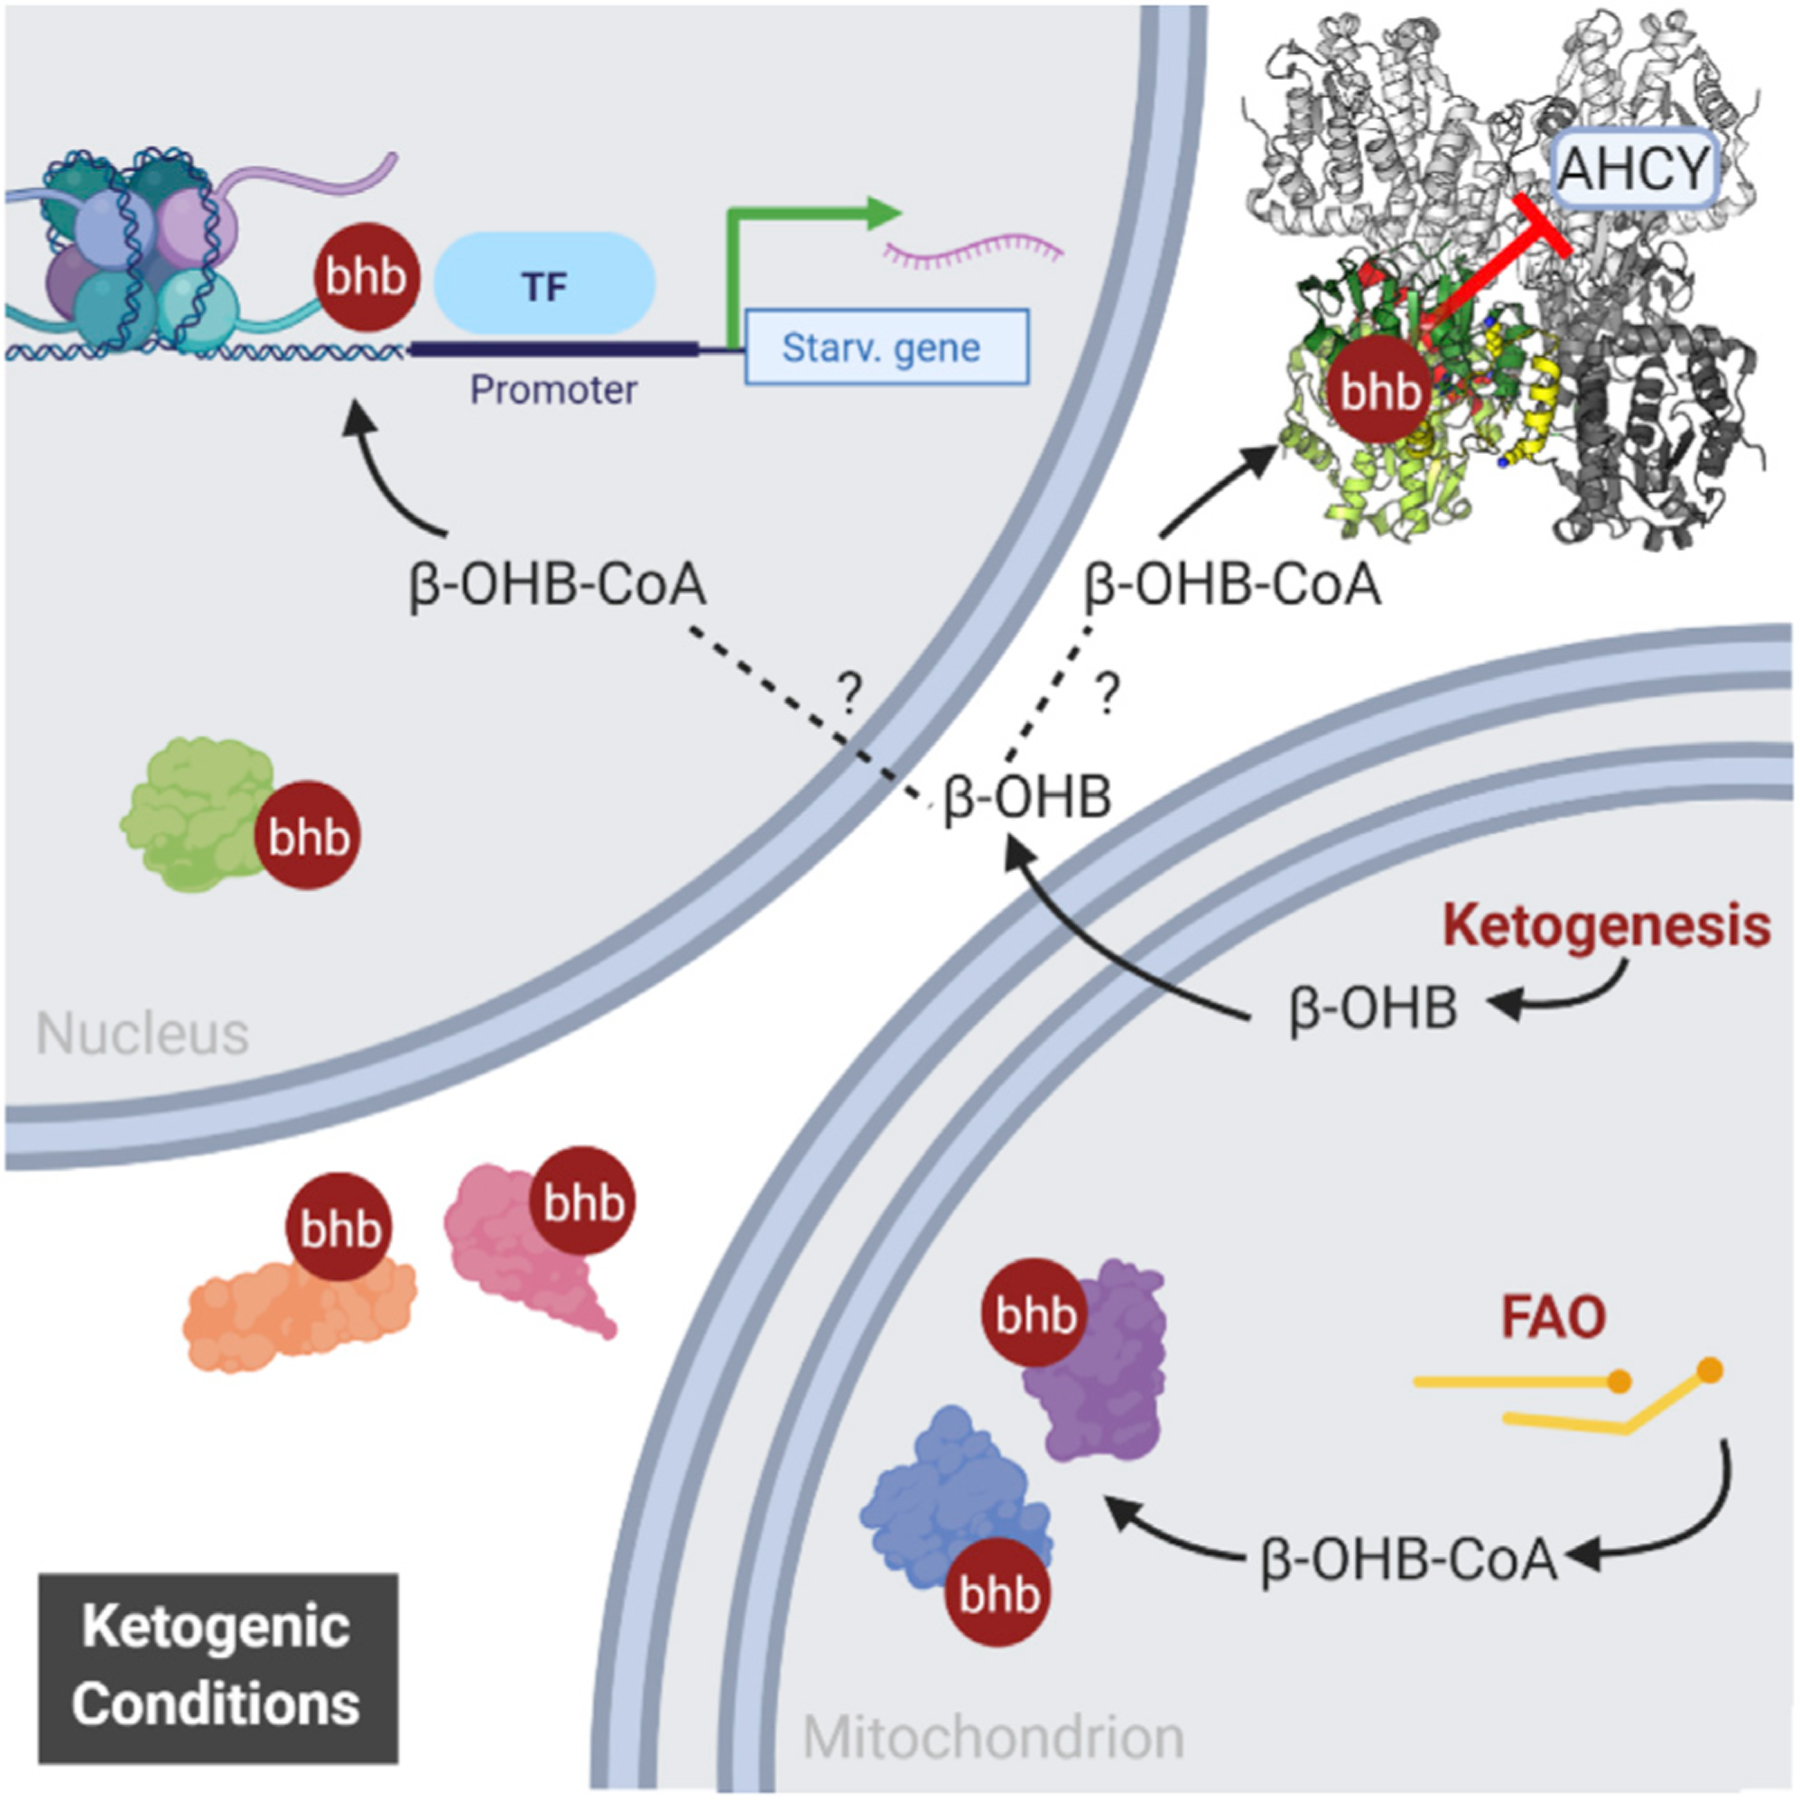
Ketone bodies are bioactive metabolites that function as energy substrates, signaling molecules, and regulators of histone modifications. β-hydroxybutyrate (β-OHB) is utilized in lysine β-hydroxybutyrylation (Kbhb) of histones, and associates with starvation-responsive genes, effectively coupling ketogenic metabolism with gene expression. The emerging diversity of the lysine acylation landscape prompted us to investigate the full proteomic impact of Kbhb. Global protein Kbhb is induced in a tissue-specific manner by a variety of interventions that evoke β-OHB. Mass spectrometry analysis of the β-hydroxybutyrylome in mouse liver revealed 891 sites of Kbhb within 267 proteins enriched for fatty acid, amino acid, detoxification, and one-carbon metabolic pathways. Kbhb inhibits S-adenosyl-L-homocysteine hydrolase (AHCY), a rate-limiting enzyme of the methionine cycle, in parallel with altered metabolite levels. Our results illuminate the role of Kbhb in hepatic metabolism under ketogenic conditions and demonstrate a functional consequence of this modification on a central metabolic enzyme.

Keywords: AHCY; S-adenosyl-L-homocysteine hydrolase; ketogenesis; ketogenic diet; liver metabolism; lysine acylation; methionine cycle; β-hydroxybutyrate; β-hydroxybutyrylation.


Conflict of interest statement

Declaration of interests The authors declare no competing interests.

Figures

Figure 1.
Figure 1.. β-hydroxybutyrate is linked to global protein Kbhb in vivo and in vitro
(A) Blood β-hydroxybutyrate (β-OHB) levels in fed versus starved (48-h fast) mice. n = 3–6, unpaired Student’s t test, ***p < 0.001. (B) Western blot for pan-β-hydroxybutyryllysine (Kbhb) from liver whole-cell lysates. n = 3 replicates are quantified (right). Unpaired Student’s t test, **p < 0.01. (C) Western blot from livers fractionated into cytosolic (Cyto), mitochondrial (Mito), and nuclear (Nuc) compartments. Fraction enrichment is demonstrated by compartment-specific loading controls. (D) Whole-cell lysates were prepared from metabolic tissues to probe Kbhb by western blot. (E) Representative western blots from cultured cell lines treated with dose-response amounts of sodium-β-hydroxybutyrate (Na-β-OHB) for 24 h. n = 3 replicates are quantified (right). One-way ANOVA, *p < 0.05, **p < 0.01. Data are represented as mean ± SEM. See also Figure S1.
Figure 2.
Figure 2.. Various ketogenic conditions present with global protein β-hydroxybutyrylation
(A) Left: blood β-OHB levels in mice fed control (Ctrl) or ketogenic diet (KD) for 4 weeks. n = 6, unpaired Student’s t test, ***p < 0.001. Right: western blot for pan-β-hydroxybutyryllysine (Kbhb) from liver whole-cell lysates. n = 4 replicates are quantified (right), unpaired Student’s t test, ***p < 0.001. (B) Whole-cell lysates from Ctrl or KD conditions of the indicated tissue. IECs, intestinal epithelial cells. (C) Type I diabetes mellitus was induced by intraperitoneal injection of vehicle (Veh) or 200 mg/kg streptozotocin (STZ). Blood measurements were taken (left) and tissue whole-cell lysates (right) were prepared 4 d post injection. n = 3 replicates for liver are quantified. Unpaired Student’s t test, **p < 0.01, ***p < 0.01. (D) Liver whole-cell lysates from mice fed Ctrl or 10% (w/w) 1,3-butanediol (1,3-BD) diet were probed by western blot. n = 3 replicates are quantified, unpaired Student’s t test, ***p < 0.001. Data are represented as mean ± SEM. See also Figure S2.
Figure 3.
Figure 3.. Characterizing the lysine β-hydroxybutyrylome in mouse liver
(A) Schematic of β-hydroxybutyryllysine (Kbhb)-modified peptide identification. LC, liquid chromatography; MS, mass spectrometry. (B) The number of Kbhb sites and proteins and their subcellular distribution as determined by the COMPARTMENTS database. (C) Histogram of the number of Kbhb sites per protein. Proteins with more than 10 sites of Kbhb are listed above the corresponding bar. (D) Sequence logo of Kbhb sites determined by iceLogo. Amino acids are colored by side-chain properties: blue, positively charged; red, negatively charged; green, polar uncharged; black, hydrophobic. 0, modification site. (E) Results from DAVID Gene Ontology (GO) analysis. Significantly enriched pathways (p < 0.001) were categorized by cellular function for visualization. (F) Overlap of Kbhb proteins and sites with Kac proteins and sites from Rardin et al. (2013b) (24-h starved mouse liver mitochondrial fractions). Only mitochondrial proteins (determined by MitoMiner) were compared. See also Table S1.
Figure 4.
Figure 4.. β-hydroxybutyrate inhibits AHCY enzymatic activity
(A) Simplified schematic of the methionine cycle. Enzymes are in red, metabolites are in black, and blue squares indicate identification of Kbhb sites. MAT, S-adenosylmethionine synthetase; BHMT, betaine-homocysteine methyltransferase; AHCY, S-adenosyl-L-homocysteine hydrolase; PEMT, phosphatidylethanolamine N-methyltransferase; GNMT, glycine N-methyltransferase; INMT, indolethylamine N-methyltransferase; AMT, aminomethyltransferase; MET, methionine; SAM, S-adenosylmethionine; SAH, S-adenosylhomocysteine; HCY, homocysteine. (B) Immunoprecipitation (IP) of AHCY from liver whole-cell lysates. FD, fed; Starv., 48-h fast. (C) Time course of Kbhb induction in HA-AHCY MEF cells. (D) Time course of Kbhb of AHCY in HA-AHCY MEF cells revealed by immunoprecipitation. (E) AHCY activity was measured as the rate of adenosine production from SAH hydrolysis in HA-AHCY MEF whole-cell lysates. One-way ANOVA, *p < 0.05, **p < 0.01, n = 3. (F) AHCY activity was measured from liver whole-cell lysates as in (E). Unpaired Student’s t test, *p < 0.05, **p < 0.01, n = 8. AHCY protein levels from liver whole-cell lysates are shown below. (G) Relative S-adenosylhomocysteine levels in liver measured by LC-MS. Unpaired Student’s t test, *p < 0.05, n = 8–9. (H) Homocysteine concentration in serum. Unpaired Student’s t test, ***p < 0.001, n = 5–6. Data are represented as mean ± SEM. See also Figures S3 and S4.
Figure 5.
Figure 5.. β-hydroxybutyrylation of K389 and K405 inhibits AHCY enzymatic activity
(A) Crystal structure of AHCY (PDB: 4YVF) bound to NAD+/NADH. Four identical monomers form 2 dimers (AB and CD) and, in turn, 1 tetramer. The substrate-binding domain (light green) and cofactor-binding domain (dark green) of A, and the C-terminal loop of B (yellow), constitute one active site. The connecting helix and loop between the substrate-binding and cofactor-binding domains are shown in red. Kbhb sites are blue spheres (K188, K389[B], and K405[B]). The stick model of NAD+/NADH has black carbons. Dashed lines mark residues within hydrogen-bond distance from K188. Structures were generated with PyMOL. Bottom right: conservation of AHCY Kbhb sites from mouse to human. (B) HEK293T cells were transfected with WT or the indicated lysine mutant plasmid, treated for 10 h with 10 mM Na-β-OHB to induce Kbhb, and then transfected AHCY was immunoprecipitated by its HA tag and assayed for enzymatic activity; values are normalized to PBS for each plasmid (see also Figure S5B). Unpaired Student’s t test, **p < 0.01, ***p < 0.001; WT, n = 6; mutants, n = 3. (C) Recombinant AHCY protein was incubated with increasing concentrations of β-hydroxybutyryl-CoA (β-OHB-CoA) for 2 h at 37°C, pH 8.0. (D) AHCY activity was measured from recombinant protein incubated with CoA or β-OHB-CoA as in (C). Unpaired Student’s t test, ***p < 0.001; n = 4. Data are represented as mean ± SEM. See also Figure S5.
Figure 6.
Figure 6.. Model of Kbhb under ketogenic conditions
In ketogenic liver, as the concentration of β-OHB rises, so does the concentration of its activated CoA form β-OHB-CoA, which serves as the substrate for Kbhb. β-OHB-CoA may be generated by mitochondrial enzymes that participate in fatty acid β-oxidation or by ACSS2, a nucleo-cytoplasmic enzyme that generates other short-chain acyl-CoA species. Kbhb has the potential to feed back on the hepatic proteome and impact metabolism—as demonstrated for AHCY and the methionine cycle—as well as alter gene expression through modification of histones.

Comment in

References

    1. Balasse EO, and Féry F (1989). Ketone body production and disposal: effects of fasting, diabetes, and exercise. Diabetes Metab. Rev 5, 247–270. - PubMed
    1. Barić I (2009). Inherited disorders in the conversion of methionine to homocysteine. J. Inherit. Metab. Dis 32, 459–471. - PubMed
    1. Belužić L, Grbeša I, Belužić R, Park JH, Kong HK, Kopjar N, Espadas G, Sabidó E, Lepur A, Rokić F, et al. (2018). Knock-down of AHCY and depletion of adenosine induces DNA damage and cell cycle arrest. Sci. Rep 8, 14012. - PMC - PubMed
    1. Cahill GF Jr. (2006). Fuel metabolism in starvation. Annu. Rev. Nutr 26, 1–22. - PubMed
    1. Carrico C, Meyer JG, He W, Gibson BW, and Verdin E (2018). The mitochondrial acylome emerges: proteomics, regulation by sirtuins, and metabolic and disease implications. Cell Metab. 27, 497–512. - PMC - PubMed

Publication types