. 2021 Aug 3;36(5):109496.
doi: 10.1016/j.celrep.2021.109496.

Slow AMPA receptors in hippocampal principal cells

Affiliations

Slow AMPA receptors in hippocampal principal cells

Niccolò P Pampaloni et al. Cell Rep. .

Abstract

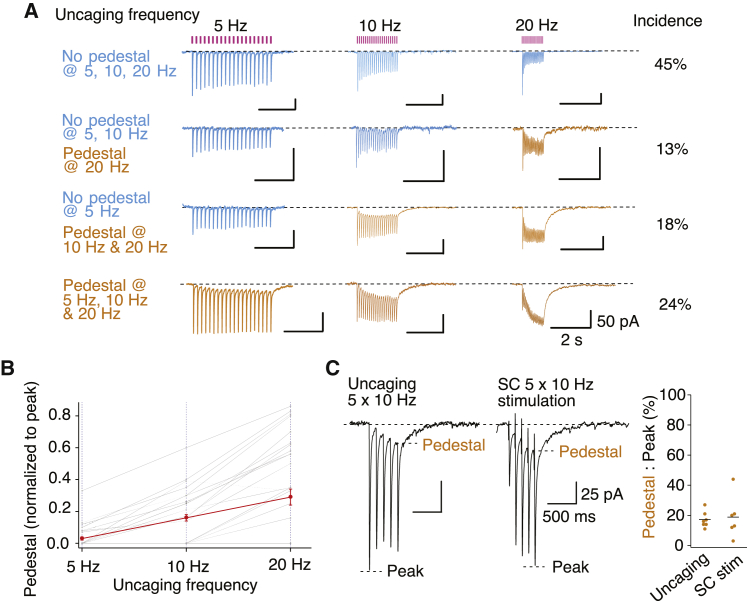
Glutamate receptor ion channels, including α-amino-3-hydroxy-5-methyl-4-isoxazolepropionic acid (AMPA) receptors, mediate fast excitatory neurotransmission in the CNS. Previous work suggested that AMPA receptors produce a synaptic current with a millisecond duration. However, we find that about two-thirds of principal cells in the hippocampal CA1 region also express AMPA receptors with reduced desensitization that can stay active for half a second after repetitive stimuli. These slow AMPA receptors are expressed at about half of the synapses, with a flat spatial distribution. The increased charge transfer from slow AMPA receptors allows short-term potentiation from a postsynaptic locus and reliable triggering of action potentials. Biophysical and pharmacological observations imply slow AMPA receptors incorporate auxiliary proteins, and their activation lengthens miniature synaptic currents. These data indicate that AMPA receptors are a major source of synaptic diversity. Synapses harboring slow AMPA receptors could have unique roles in hippocampal function.


Conflict of interest statement

Declaration of interests The authors declare no competing interests.

Figures

None
Graphical abstract
Figure 1
Figure 1
Slow pedestal responses in CA1 pyramidal cells (A) Tiled fluorescence micrograph of a CA1 pyramidal cell in organotypic slice cultures with voltage-clamp responses from 10 Hz uncaging at 10 sites. Dotted white lines are used to divide the hippocampal layers in the CA1 area: o, oriens; p, pyramidale; r, radiatum; l-m, lacunosum moleculare. (B) Examples of typical fast classical responses (blue, no pedestal) and pedestal responses (orange, with an additional slow inward current and slow decay), with uncaging pulses indicated as purple circles. (C) Spatial distribution of a normalized pedestal (steady state) current at the end of 20 uncaging pulses at 10 Hz against the distance of the site from the nucleus (dashed line; r2 = 0.003, n = 285 sites, 43 cells). The pie chart shows the fraction of uncaging sites with (orange) and without (blue) pedestal responses. (D) Incidence and prevalence of pedestal currents with 10 Hz uncaging. Nearly two-thirds of CA1 pyramids present a mosaic distribution of pedestal currents, with one-third apparently lacking pedestal responses. (E) Pedestal and non-pedestal responses generated from classical 10 Hz Schaffer collateral (SC) electrical stimulation in organotypic slice cultures. (F) Distribution of pedestal magnitudes in SC stimulation experiments. The pie chart shows the fraction of cells with (orange) or without (blue) pedestal responses from electrical stimulation.
Figure 2
Figure 2
Frequency and stimulus dependence of pedestal currents (A) Uncaging at 5–20 Hz in CA1 pyramidal cells in organotypic slice cultures reveals nearly half of sites have no pedestal response, about a quarter show a prominent pedestal response at all frequencies, and another quarter show an intermediate, frequency-dependent response. (B) Summary of the pedestal magnitude across 33 uncaging sites from 4 neurons. (C) In cases of an identified pedestal response, 5 pulse stimulation, either with uncaging (n = 7 sites) or with Schaffer collateral stimulation (n = 6 cells) at 10 Hz, generates a similar pedestal level of about 20% and an anomalous slow decay.
Figure 3
Figure 3
The kinetic fingerprint of pedestal responses (A) Slow tail current follows 10 Hz uncaging at pedestal sites in CA1 pyramidal neurons in organotypic slice cultures, whereas responses at no-pedestal sites have fast decay kinetics like canonical AMPA currents. (B) Distribution of weighted time constants fitted to the decay after the final pulse following 10 Hz uncaging. (C) At sites identified to give pedestal currents, the decays of responses to single uncaging events are slower, whereas rise times were indistinguishable. (D) Distribution of weighted time constants fitted to the current decay after a single uncaging stimulus. The distribution of rise times, which did not change, is also shown. (E) In neurons showing a pedestal response, a slow tail current followed 10 Hz SC stimulation, whereas responses at no-pedestal cells had fast decay kinetics like canonical AMPA currents. (F) Distribution of weighted time constants fitted to the decay after the final response following 10 Hz SC stimulation. (G) Comparison of decays after pedestal responses generated by 5 stimuli at 10 Hz (see Figure 2C). (H) Dentate gyrus granule cells have no pedestal currents. Tiled fluorescence micrograph of uncaging sites with color-coded recordings of currents driven by 10 Hz uncaging, composited with a differential interference contrast image of the granule cell bodies. (I) Pedestal responses are absent and decays following uncaging stimuli are universally fast, matching canonical AMPA responses. (J) Comparison across neuronal types and stimuli, showing the distinction between fast (no pedestal) decays and the slow pedestal response decays, which depend on stimulus intensity.
Figure 4
Figure 4
Pedestal currents have aberrant AMPA receptor pharmacology (A) In CA1 pyramidal cells in organotypic slice cultures, steady-state (pedestal) currents that develop during a 20 × 10 Hz uncaging stimulation are selectively spared by NBQX (10 μM), compared with the peak response to the first stimulation, but abolished following addition of GYKI 52466 (100 μM). (B) Equivalent experiment to (A) but with stimulation of SC gave similar results with NBQX (1 μM). (C) Peak and steady-state currents from heteromeric GluA1:A2 receptors are inhibited by GYKI (100 μM) and NBQX (3 μM) in a voltage-independent manner. Auxiliary proteins γ-2 and γ-8 each endow heteromeric AMPA receptors expressed in HEK293 cells with steady-state pedestal responses that are spared by NBQX (3 μM) but abolished by GYKI (100 μM). Note the slow superactivation in the γ-8 example. Recordings were made at +50 mV to exclude GluA1 homomeric receptors not complexed by TARPs, which are blocked at this voltage by 50 μM spermine.
Figure 5
Figure 5
Pedestal connections are instructive, providing a large depolarizing drive (A) Pedestal responses produced by 10 Hz uncaging in CA1 pyramidal cells in organotypic slice cultures evoke charge transfer of increased amplitude and duration (shaded region). (B) At amplitude-matched sites in the same cell, pedestal responses produce about 3 times more charge transfer in response to 10 Hz train stimulation. Values in picoampere milliseconds are equivalent to nanocoulombs (nC). (C) Current-clamp recordings (upper traces) show that uncaging at pedestal sites reliably triggers action potentials, whereas similar amplitude canonical responses almost never do. Lower traces are the responses of the same sites in voltage clamp. (D) Relation between pedestal magnitude and reliability of action potential firing during a train. The large blue circle indicates 17 classical sites where zero action potentials were fired from 10 Hz stimulation. The coefficient of determination (r2) for the line fitted to pedestal responses was 0.64. (E) Application of GYKI 52466 abolished both uncaging excitatory postsynaptic potentials (EPSPs) and consequent firing of spikes.
Figure 6
Figure 6
Pedestal currents correspond to slow individual miniature synaptic currents (A) Experimental design. Miniature currents were recorded for >5 min in a naive cell in organotypic slice cultures, preceding an uncaging survey to classify the pedestal prevalence. (B) Aligned miniature currents from 4 exemplary cells. Each average miniature current was constructed from (left to right) 63, 88, 129, and 85 minis, respectively. (C) Uncaging surveys from 12 sites for each cell in (B). Cells that had 2 or more sites with <20% normalized pedestal amplitude were classified as weak pedestal (incidence range = 13%–33%), and cells with 2 or more sites with >20% pedestal amplitude were classified as strong pedestal (incidence range = 17%–50%). (D) Distributions of fitted 90%–10% decay times of individual miniature currents. Each column represents a cell classified according to the post hoc uncaging results, and each point is the decay time of an individual current. Black bars are the mean values. Numbers of miniature currents averaged in each group are as follows (left to right): no pedestal, 63, 91, 141, 208, 315, 454, 116, 31, 73, 33, 135, 49; weak pedestal, 26, 361, 36, 88, 37, 32; pedestal, 148, 37, 10, 129, 49, 24, 107, 35; γ-8 overexpression, 101, 26, 85, 14. (E) Summary of miniature currents with decays longer than 20 ms. Increasing intensity of pedestal currents correlates with detection of more miniature currents with long decays (r2 = 0.67). (F) Miniature current amplitudes according to the same classification. Each point represents the amplitude of an individual miniature current, bars are averages (no pedestal, 13 ± 2 pA; weak pedestal, 9.8 ± 0.5 pA, p versus no pedestal = 0.75; strong pedestal, 17 ± 2 pA, p versus no pedestal = 0.49; γ-8 overexpression, 17 ± 3 pA, p versus no pedestal = 0.7), and the number of cells in each group is indicated in brackets.
Figure 7
Figure 7
Overexpression of γ-8 converts almost all synaptic responses to pedestal responses (A) Glutamate uncaging at 10 Hz at 9 sites on a neuron electroporated with the auxiliary subunit γ-8. In the example shown, all sites tested exhibited pedestal responses, although the magnitude of the pedestal response at site 9 was small. Tiled micrograph of Alexa Fluor 594 fluorescence. (B) Overexpression of γ-8 increased the fraction of pedestal responses to 95% (n = 4 cells) and significantly increased the mean pedestal level (Dunnett’s test for multiple comparisons). Overexpression of dominant-negative forms of gamma-8 and gamma-2 eliminated large pedestal responses but did not change the mean pedestal response, because the fraction of sites giving no pedestal response was reduced. (C) Gamma-8 overexpression slowed the pedestal rise time, whereas dominant-negative TARP expression sped it up. Each point represents a single response to uncaging. (D) Pedestal current off-kinetics were almost insensitive to TARP overexpression.

References

    1. Bats C., Groc L., Choquet D. The interaction between Stargazin and PSD-95 regulates AMPA receptor surface trafficking. Neuron. 2007;53:719–734. - PubMed
    1. Bats C., Soto D., Studniarczyk D., Farrant M., Cull-Candy S.G. Channel properties reveal differential expression of TARPed and TARPless AMPARs in stargazer neurons. Nat. Neurosci. 2012;15:853–861. - PMC - PubMed
    1. Bittner K.C., Grienberger C., Vaidya S.P., Milstein A.D., Macklin J.J., Suh J., Tonegawa S., Magee J.C. Conjunctive input processing drives feature selectivity in hippocampal CA1 neurons. Nat. Neurosci. 2015;18:1133–1142. - PMC - PubMed
    1. Buzsáki G. Theta oscillations in the hippocampus. Neuron. 2002;33:325–340. - PubMed
    1. Carbone A.L., Plested A.J.R. Superactivation of AMPA receptors by auxiliary proteins. Nat. Commun. 2016;7:10178. - PMC - PubMed

Publication types

Substances

LinkOut - more resources