

Identification of potential targets of triptolide in regulating the tumor microenvironment of stomach adenocarcinoma patients using bioinformatics
- PMID: 34348580
- PMCID: PMC8806726
- DOI: 10.1080/21655979.2021.1945522
Identification of potential targets of triptolide in regulating the tumor microenvironment of stomach adenocarcinoma patients using bioinformatics
Abstract
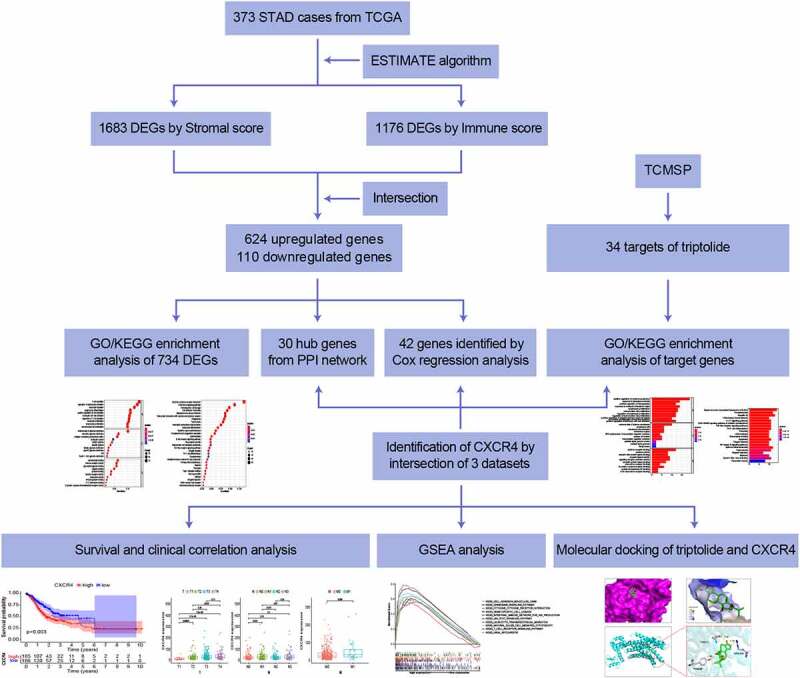
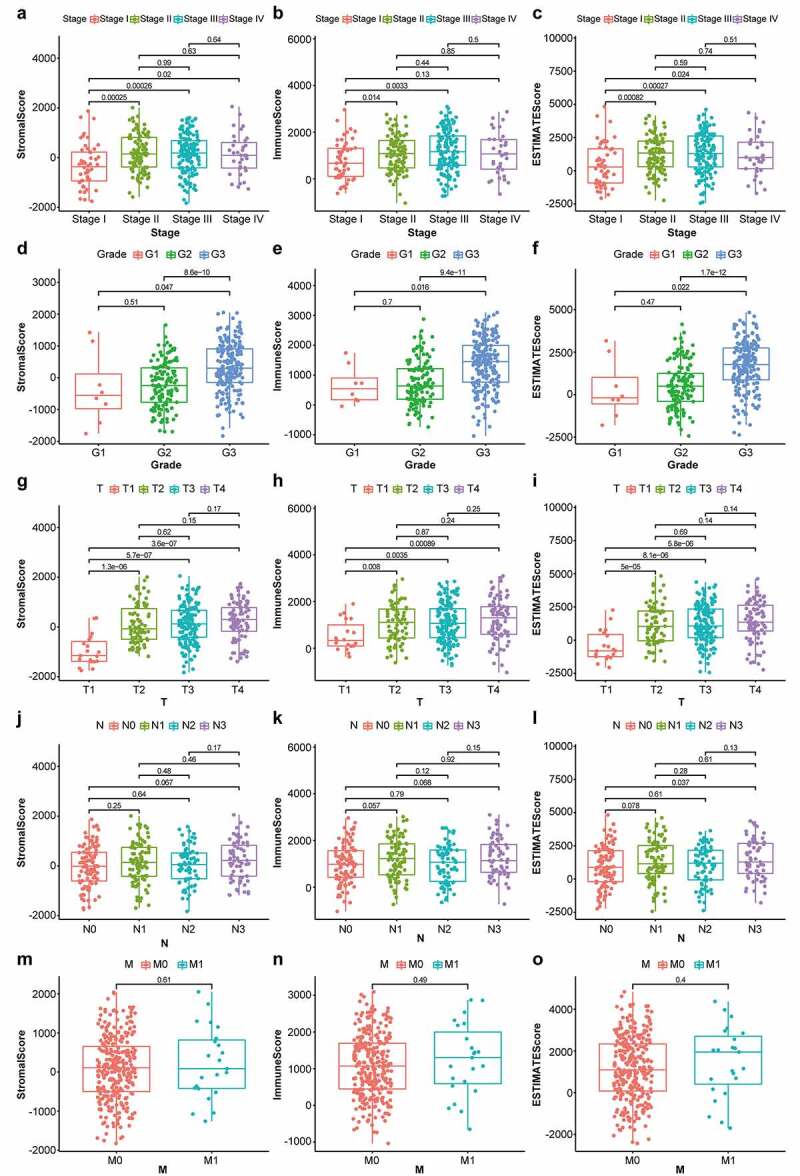
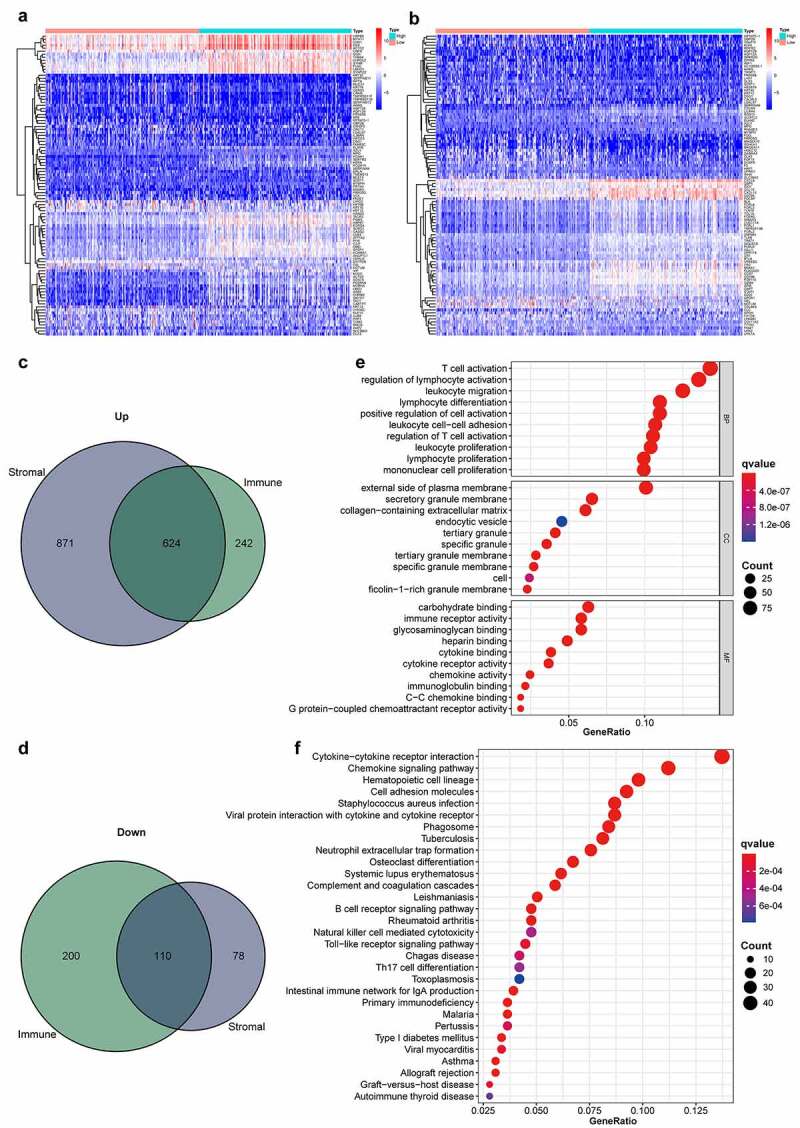
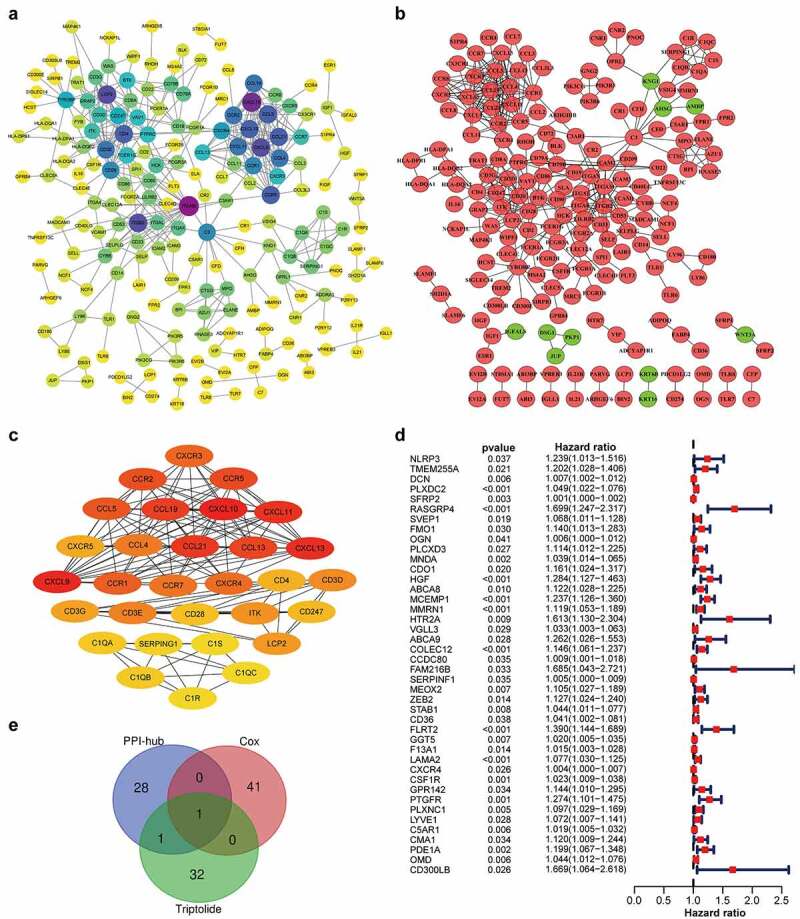
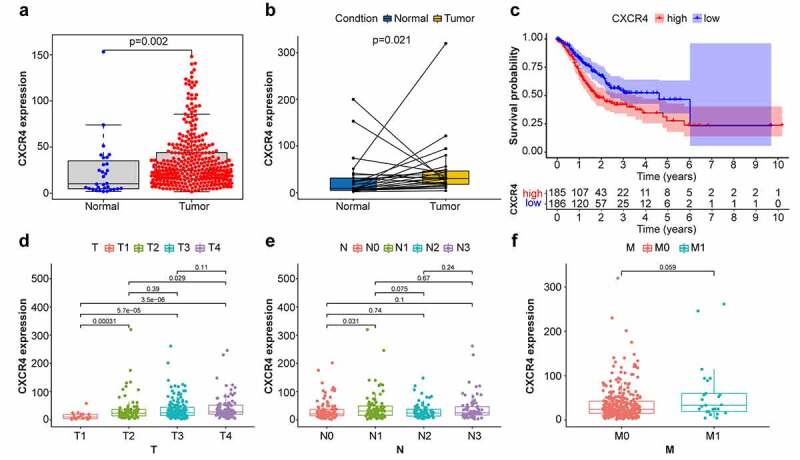
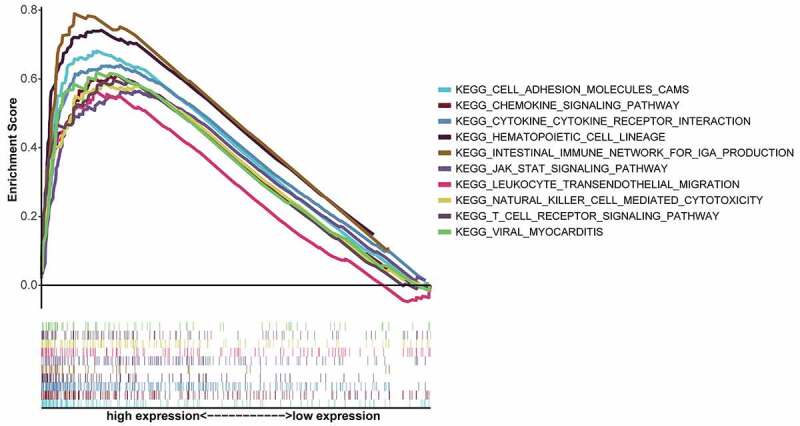
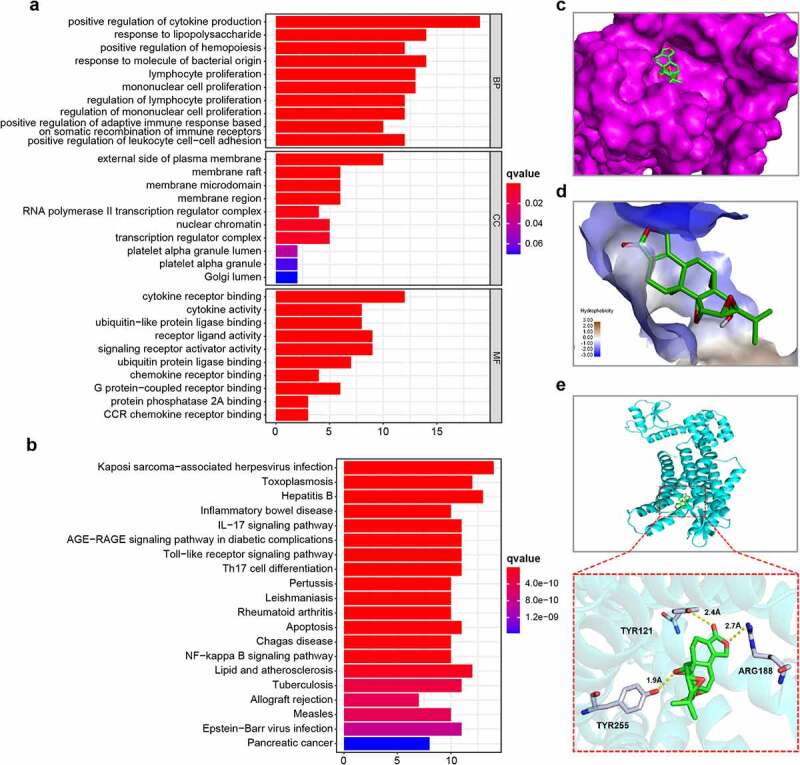
This study aimed to identify potential pharmacological targets of triptolide regulating the tumor microenvironment (TME) of stomach adenocarcinoma (STAD) patients. A total of 343 STAD cases from The Cancer Genome Atlas (TCGA) were assigned into high- or low-score groups applying Estimation of STromal and Immune cells in MAlignant Tumor tissues using Expression data (ESTIMATE). Hub genes were identified from differentially expressed genes (DEGs) shared by stromal- and immune-related components in the TME of STAD patients using R software. Cox regression analysis was used to identify genes significantly correlated with STAD patient survival. Triptolide target genes were predicted from the Traditional Chinese Medicine Systems Pharmacology Database and Analysis Platform (TCMSP). Top 30 genes filtered by Cytohubba from 734 DEGs were screened as hub genes. Forty-two genes were found to be at high risk for STAD prognosis. Thirty-four targets of triptolide were predicted using the TCMSP database. Importantly, C-X-C chemokine receptor type 4 (CXCR4) was identified as a potential target of triptolide associated with the TME in STAD. Analysis of survival highlighted the association between CXCR4 upregulation with STAD progression and poor prognosis. Gene Set Enrichment Analysis (GSEA) confirmed that genes in the CXCR4- upregulated group had significant enrichment in immune-linked pathways. Additionally, triptolide targets were found to be significantly enriched in CXCR4-related chemokine and cancer-related p53 signaling pathways. Molecular docking demonstrated a high affinity between triptolide and CXCR4. In conclusion, CXCR4 may be a therapeutic target of triptolide in the treatment of STAD patients by modulating the TME.
Keywords: The cancer genome atlas (TCGA); bioinformatics; estimation of stromal and immune cells in malignant tumors using expression data (estimate); stomach adenocarcinoma; triptolide; tumor microenvironment.
Conflict of interest statement
No potential conflict of interest was reported by the author(s).
Figures
Similar articles
-
Identification of prognosis-related genes in the tumor microenvironment of stomach adenocarcinoma by TCGA and GEO datasets.Biosci Rep. 2020 Oct 30;40(10):BSR20200980. doi: 10.1042/BSR20200980. Biosci Rep. 2020. PMID: 33015704 Free PMC article.
-
Amino acid metabolism-related genes as potential biomarkers and the role of MATN3 in stomach adenocarcinoma: A bioinformatics, mendelian randomization and experimental validation study.Int Immunopharmacol. 2024 Dec 25;143(Pt 1):113253. doi: 10.1016/j.intimp.2024.113253. Epub 2024 Sep 30. Int Immunopharmacol. 2024. PMID: 39353384
-
Construction of store-operated calcium entry-related gene signature for predicting prognosis and indicates immune microenvironment infiltration in stomach adenocarcinomas.Sci Rep. 2024 Sep 27;14(1):22342. doi: 10.1038/s41598-024-73324-9. Sci Rep. 2024. PMID: 39333689 Free PMC article.
-
Identify potential prognostic indicators and tumor-infiltrating immune cells in pancreatic adenocarcinoma.Biosci Rep. 2022 Feb 25;42(2):BSR20212523. doi: 10.1042/BSR20212523. Biosci Rep. 2022. PMID: 35083488 Free PMC article. Review.
-
Identification and characterization of nucleotide metabolism and neuroendocrine regulation-associated modification patterns in stomach adenocarcinoma with auxiliary prognostic assessment and immunotherapy response prediction.Front Endocrinol (Lausanne). 2023 Jan 16;13:1076521. doi: 10.3389/fendo.2022.1076521. eCollection 2022. Front Endocrinol (Lausanne). 2023. PMID: 36726460 Free PMC article. Review.
Cited by
-
Natural Compounds Targeting Cancer-Associated Fibroblasts against Digestive System Tumor Progression: Therapeutic Insights.Biomedicines. 2022 Mar 19;10(3):713. doi: 10.3390/biomedicines10030713. Biomedicines. 2022. PMID: 35327514 Free PMC article. Review.
-
Clinical correlations and prognostic value of Nudix hydroxylase 10 in patients with gastric cancer.Bioengineered. 2021 Dec;12(2):9779-9789. doi: 10.1080/21655979.2021.1995104. Bioengineered. 2021. PMID: 34696672 Free PMC article. Clinical Trial.
-
Unlocking the power of nanomedicine: the future of nutraceuticals in oncology treatment.Front Nutr. 2023 Nov 17;10:1258516. doi: 10.3389/fnut.2023.1258516. eCollection 2023. Front Nutr. 2023. PMID: 38045808 Free PMC article. Review.
-
TNFRSF12A expression in stomach adenocarcinoma and its preliminary role in predicting immunotherapy response.Front Immunol. 2025 May 5;16:1578068. doi: 10.3389/fimmu.2025.1578068. eCollection 2025. Front Immunol. 2025. PMID: 40391219 Free PMC article.
-
A pan-cancer analysis of the prognostic and immunological role of β-actin (ACTB) in human cancers.Bioengineered. 2021 Dec;12(1):6166-6185. doi: 10.1080/21655979.2021.1973220. Bioengineered. 2021. PMID: 34486492 Free PMC article.
References
-
- Bray F, Ferlay J, Soerjomataram I, et al. Global cancer statistics 2018: GLOBOCAN estimates of incidence and mortality worldwide for 36 cancers in 185 countries. CA Cancer J Clin. 2018;68(6):394–424. - PubMed
-
- Bray F, Jemal A, Grey N, et al. Global cancer transitions according to the Human Development Index (2008-2030): a population-based study. Lancet Oncol. 2012;13(8):790–801. - PubMed
-
- Chen W, Zheng R, Baade PD, et al. Cancer statistics in China, 2015. CA Cancer J Clin. 2016;66(2):115–132. - PubMed
-
- Van Cutsem E, Sagaert X, Topal B, et al. Gastric cancer. Lancet. 2016;388(10060):2654–2664. - PubMed
MeSH terms
Substances
LinkOut - more resources
Full Text Sources
Medical
Research Materials
Miscellaneous