

Plastin-3 is a diagnostic and prognostic marker for pancreatic adenocarcinoma and distinguishes from diffuse large B-cell lymphoma
- PMID: 34348730
- PMCID: PMC8336331
- DOI: 10.1186/s12935-021-02117-1
Plastin-3 is a diagnostic and prognostic marker for pancreatic adenocarcinoma and distinguishes from diffuse large B-cell lymphoma
Abstract
Background: Altered Plastin-3 (PLS3; an actin-binding protein) expression was associated with human carcinogenesis, including pancreatic ductal adenocarcinoma (PDA). This study first assessed differentially expressed genes (DEGs) and then bioinformatically and experimentally confirmed PLS3 to be able to predict PDA prognosis and distinguish PDA from diffuse large B-cell lymphoma.
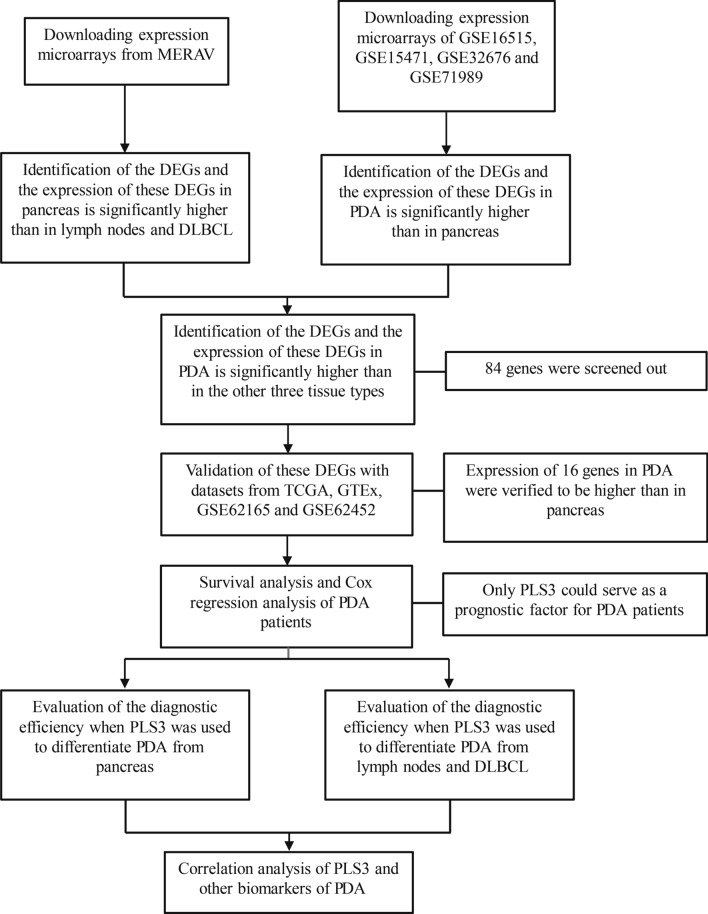
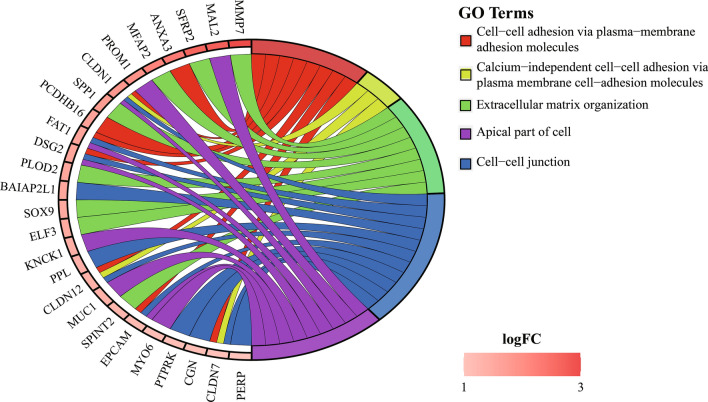
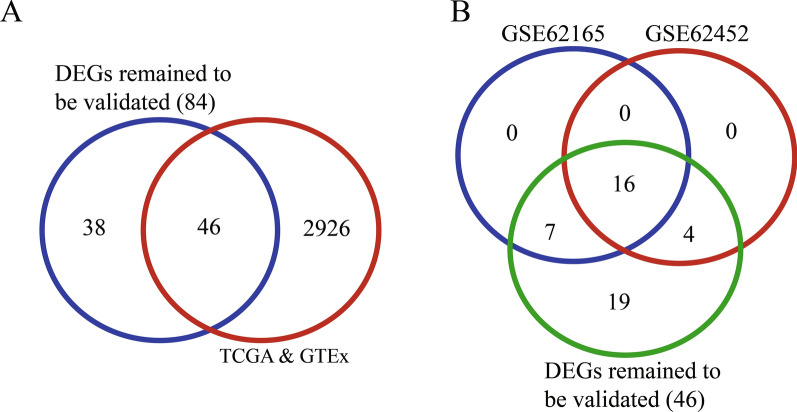
Methods: This study screened multiple online databases and revealed DEGs among PDA, normal pancreas, diffuse large B-cell lymphoma (DLBCL), and normal lymph node tissues and then focused on PLS3. These DEGs were analyzed for Gene Ontology (GO) terms, Kaplan-Meier curves, and the log-rank test to characterize their association with PDA prognosis. The receiver operating characteristic curve (ROC) was plotted, and Spearman's tests were performed. Differential PLS3 expression in different tissue specimens (n = 30) was evaluated by reverse transcription quantitative polymerase chain reaction (RT-qPCR).
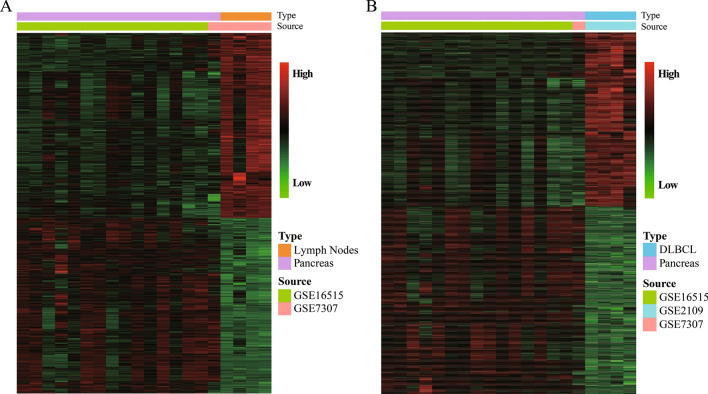
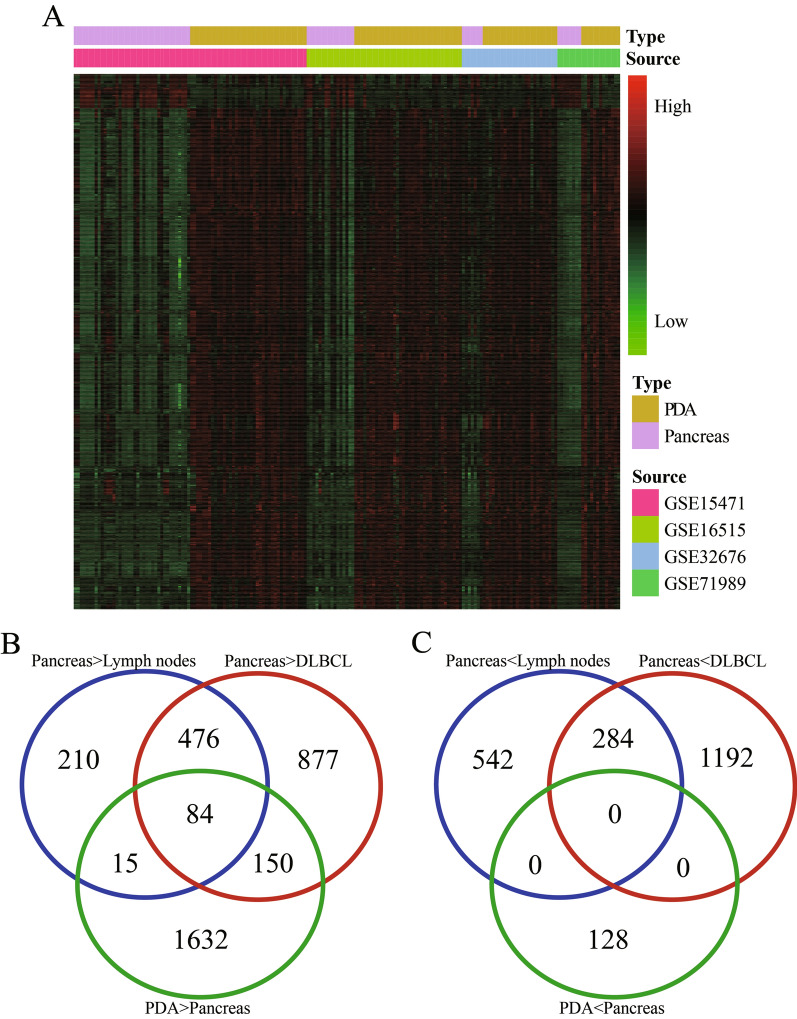
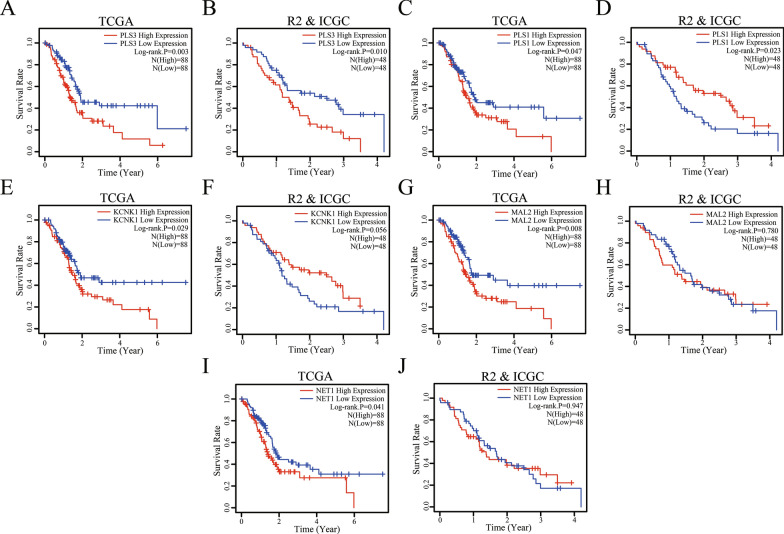
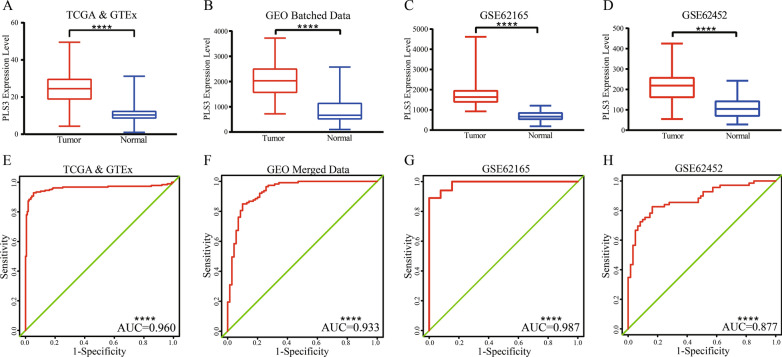
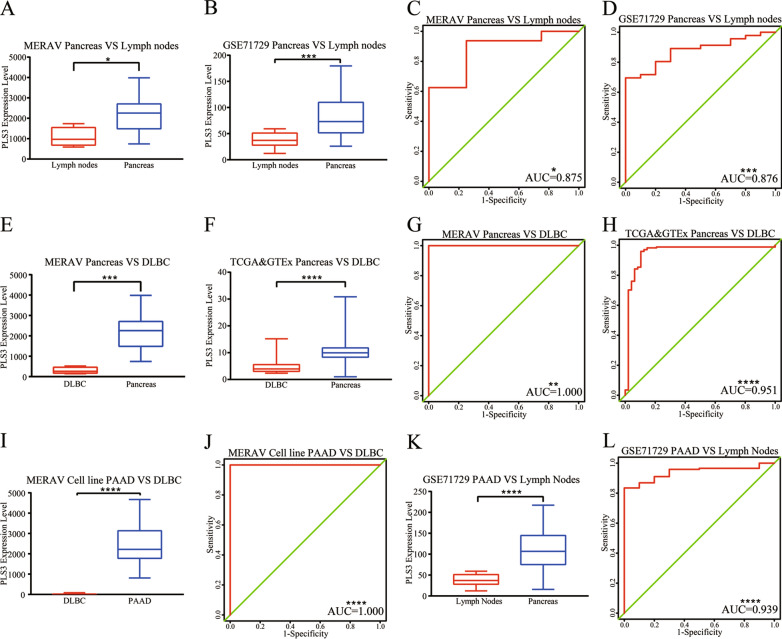
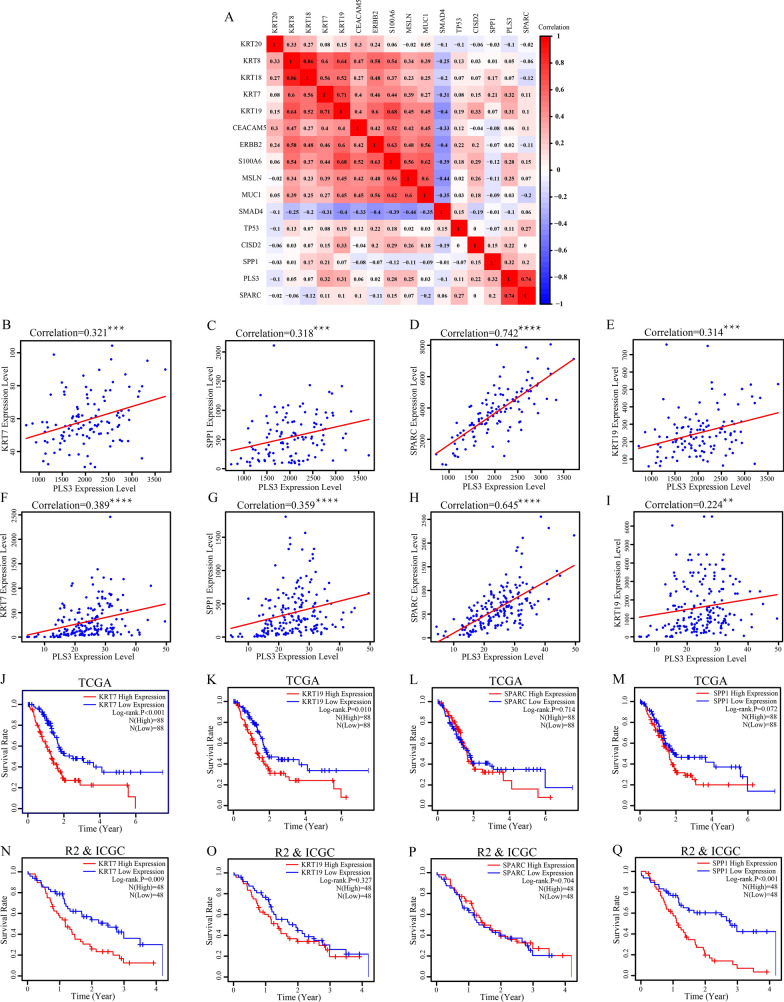
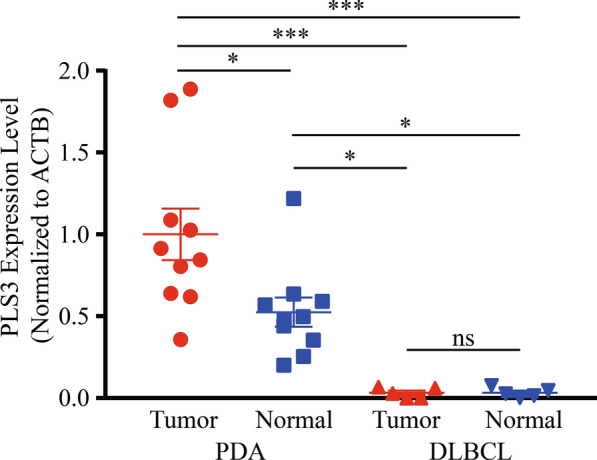
Results: There were a great number of DEGs between PDA and lymph node, between PDA and DLBCL, and between PDA and normal pancreatic tissues. Five DEGs (NET1, KCNK1, MAL2, PLS1, and PLS3) were associated with poor overall survival of PDA patients, but only PLS3 was further verified by the R2 and ICGC datasets. The ROC analysis showed a high PLS3 AUC (area under the curve) value for PDA diagnosis, while PLS3 was able to distinguish PDA from DLBCL. The results of Spearman's analysis showed that PLS3 expression was associated with levels of KRT7, SPP1, and SPARC. Differential PLS3 expression in different tissue specimens was further validated by RT-qPCR.
Conclusions: Altered PLS3 expression was useful in diagnosis and prognosis of PDA as well as to distinguish PDA from DLBCL.
Keywords: Bioinformatic analysis; Biomarker; Differentially expressed genes; Diffuse large B-cell lymphoma; Pancreatic adenocarcinoma.
© 2021. The Author(s).
Conflict of interest statement
The authors declare that there is no conflict of interest in this work.
Figures
Similar articles
-
Diagnostic and prognostic value of secreted protein acidic and rich in cysteine in the diffuse large B-cell lymphoma.World J Clin Cases. 2021 Aug 6;9(22):6287-6299. doi: 10.12998/wjcc.v9.i22.6287. World J Clin Cases. 2021. PMID: 34434995 Free PMC article.
-
Integrated bioinformatics analysis of potential biomarkers for pancreatic cancer.J Clin Lab Anal. 2022 May;36(5):e24381. doi: 10.1002/jcla.24381. Epub 2022 Apr 11. J Clin Lab Anal. 2022. PMID: 35403252 Free PMC article.
-
CCL8 as a promising prognostic factor in diffuse large B-cell lymphoma via M2 macrophage interactions: A bioinformatic analysis of the tumor microenvironment.Front Immunol. 2022 Aug 22;13:950213. doi: 10.3389/fimmu.2022.950213. eCollection 2022. Front Immunol. 2022. PMID: 36072582 Free PMC article.
-
[Screening of Differential Expression Autophagy Genes Related to the Prognosis of Diffuse Large B-Cell Lymphoma and Establishment of an Autophagy Model].Zhongguo Shi Yan Xue Ye Xue Za Zhi. 2022 Aug;30(4):1101-1108. doi: 10.19746/j.cnki.issn.1009-2137.2022.04.019. Zhongguo Shi Yan Xue Ye Xue Za Zhi. 2022. PMID: 35981368 Chinese.
-
Plastin 3 in health and disease: a matter of balance.Cell Mol Life Sci. 2021 Jul;78(13):5275-5301. doi: 10.1007/s00018-021-03843-5. Epub 2021 May 23. Cell Mol Life Sci. 2021. PMID: 34023917 Free PMC article. Review.
Cited by
-
Overexpressed KCNK1 regulates potassium channels affecting molecular mechanisms and biological pathways in bladder cancer.Eur J Med Res. 2024 Apr 30;29(1):257. doi: 10.1186/s40001-024-01844-1. Eur J Med Res. 2024. PMID: 38689322 Free PMC article.
-
Actin Bundles Dynamics and Architecture.Biomolecules. 2023 Feb 28;13(3):450. doi: 10.3390/biom13030450. Biomolecules. 2023. PMID: 36979385 Free PMC article. Review.
-
Characterization and comparison of insulinoma tumor model and pancreatic damage caused by the tumor, and identification of possible markers.Mol Biol Rep. 2024 Jan 16;51(1):109. doi: 10.1007/s11033-023-08942-z. Mol Biol Rep. 2024. PMID: 38227104
-
Single Cell RNA Sequencing of Papillary Cancer Mesenchymal Stem/Stromal Cells Reveals a Transcriptional Profile That Supports a Role for These Cells in Cancer Progression.Int J Mol Sci. 2025 May 21;26(10):4957. doi: 10.3390/ijms26104957. Int J Mol Sci. 2025. PMID: 40430098 Free PMC article.
-
Research advances of MAL family members in tumorigenesis and tumor progression (Review).Mol Med Rep. 2024 Apr;29(4):57. doi: 10.3892/mmr.2024.13181. Epub 2024 Feb 16. Mol Med Rep. 2024. PMID: 38362940 Free PMC article. Review.
References
-
- Wild C, Weiderpass E, Stewart BW. Pancreatic cancer, world cancer report: cancer research for cancer prevention. Lyon: World Health Organization; 2020. pp. 367–373.
-
- Rahib L, Smith BD, Aizenberg R, Rosenzweig AB, Fleshman JM, Matrisian LM. Projecting cancer incidence and deaths to 2030: the unexpected burden of thyroid, liver, and pancreas cancers in the United States. Cancer Res. 2014;74:2913–2921. - PubMed
-
- Kamisawa T, Wood LD, Itoi T, Takaori K. Pancreatic cancer. Lancet. 2016;388:73–85. - PubMed
Grants and funding
LinkOut - more resources
Full Text Sources
Research Materials
Miscellaneous
