. 2021 Aug 4;16(1):345.
doi: 10.1186/s13023-021-01957-4.

10 years of CEMARA database in the AnDDI-Rares network: a unique resource facilitating research and epidemiology in developmental disorders in France

Collaborators, Affiliations

10 years of CEMARA database in the AnDDI-Rares network: a unique resource facilitating research and epidemiology in developmental disorders in France

Claude Messiaen et al. Orphanet J Rare Dis. .

Abstract

Background: In France, the Ministry of Health has implemented a comprehensive program for rare diseases (RD) that includes an epidemiological program as well as the establishment of expert centers for the clinical care of patients with RD. Since 2007, most of these centers have entered the data for patients with developmental disorders into the CEMARA population-based registry, a national online data repository for all rare diseases. Through the CEMARA web portal, descriptive demographic data, clinical data, and the chronology of medical follow-up can be obtained for each center. We address the interest and ongoing challenges of this national data collection system 10 years after its implementation.

Methods: Since 2007, clinicians and researchers have reported the "minimum dataset (MDS)" for each patient presenting to their expert center. We retrospectively analyzed administrative data, demographic data, care organization and diagnoses.

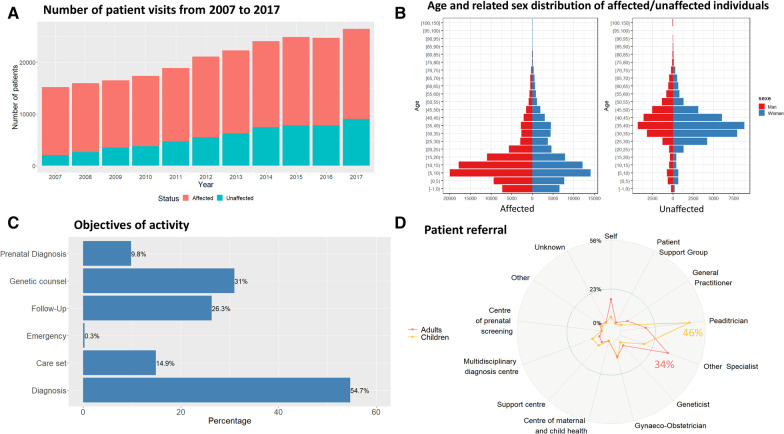
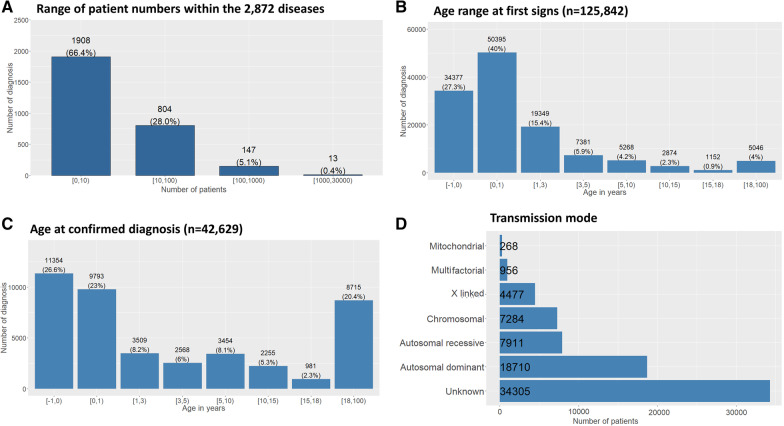
Results: Over 10 years, 228,243 RD patients (including healthy carriers and family members for whom experts denied any suspicion of RD) have visited an expert center. Among them, 167,361 were patients affected by a RD (median age 11 years, 54% children, 46% adults, with a balanced sex ratio), and 60,882 were unaffected relatives (median age 37 years). The majority of patients (87%) were seen no more than once a year, and 52% of visits were for a diagnostic procedure. Among the 2,869 recorded rare disorders, 1,907 (66.5%) were recorded in less than 10 patients, 802 (28%) in 10 to 100 patients, 149 (5.2%) in 100 to 1,000 patients, and 11 (0.4%) in > 1,000 patients. Overall, 45.6% of individuals had no diagnosis and 6.7% had an uncertain diagnosis. Children were mainly referred by their pediatrician (46%; n = 55,755 among the 121,136 total children referrals) and adults by a medical specialist (34%; n = 14,053 among the 41,564 total adult referrals). Given the geographical coverage of the centers, the median distance from the patient's home was 25.1 km (IQR = 6.3 km-64.2 km).

Conclusions: CEMARA provides unprecedented support for epidemiological, clinical and therapeutic studies in the field of RD. Researchers can benefit from the national scope of CEMARA data, but also focus on specific diseases or patient subgroups. While this endeavor has been a major collective effort among French RD experts to gather large-scale data into a single database, it provides tremendous potential to improve patient care.

Keywords: Data warehouse; Developmental disorders; Epidemiology; Rare disease.


Conflict of interest statement

The authors declare that they have no competing interests.

Figures

Fig. 1
Fig. 1
Demographic information, Care pathways. A Number of patient visits from 2007 to 2017, comprising affected individuals (red) and non-affected relatives (blue). B Age and related sex distribution of affected/unaffected individuals. The median age in affected individuals was 11 years, and the median age in non-affected individuals was 37 years. Within the affected population, 51.6% (n = 86,304) of the affected patients were males and 44.4% females (n = 74,319). C Objectives of activity. 55% (n = 208,433) of activities were for diagnosis purposes, 31% (n = 118,244) for genetic counseling, and only 36% (n = 136,286) for follow-up (FU) care, 9.7% (n = 37,397) for prenatal diagnosis, and 0.3% (n = 999) for emergency, taking into account that the same patient can be seen for more than one reason. D Patient referral. Patients are mainly referred to a RCRD/CERD by a pediatrician when the index case is a child (n = 55,755; 46%), and by a specialist when the affected patient is an adult (n = 14,053; 34%). For Children: Self: 4% (n = 5242); Patient Support Group: 0% (n = 373); General Practitioner: 2% (n = 2399); Pediatrician: 46% (n = 55,755); Other Specialist: 17% (n = 20,555); Geneticist: 3% (n = 3372); Gynecologist-Obstetrician: 12% (n = 14,778); Centre of maternal and child health: 0% (n = 340); Support center: 6% (n = 7345); Multi-disciplinary diagnosis center: 7% (n = 8599); Prenatal screening centre: 0% (n = 163); Other: 1% (n = 1322); Unknown: 1% (n = 893). For Adults: Self: 16% (n = 6452); Patient Support Group: 1% (n = 324); General Practitioner: 7% (n = 3073); Pediatrician: 17% (n = 7050); Other Specialist: 34% (n = 14,053); Geneticist: 6% (n = 2495); Gynecologist-Obstetrician: 11% (n = 4434); Centre of maternal and child health: 0% (n = 51); Support center: 3% (n = 1219); Multi-disciplinary diagnosis center: 2% (n = 713); Prenatal screening centre: 0% (n = 11); Other: 3% (n = 1186); Unknown: 1% (n = 503)
Fig. 2
Fig. 2
Frequency of diseases / diagnosis. A Range of patient numbers within the 2,872 diseases part of the AnDDI-Rares spectrum. The majority of diseases were found in 0–10 patients (66.5%, n = 1,907). 28% (n = 802) were found in 10–100 patients, 5.2% (n = 149) in 100–1,000 patients, and 0.4% (n = 11) in 1,000–10,000 patients. B Age range at first signs (n = 125,842). The median age at first signs is at birth (IQR = 2.5 years). The beginning of symptoms was noted within the first year of life in 67.3% of cases (n = 84,772). C Diagnostic status within the network. A confirmed diagnosis was found in 34% of cases (n = 56,515), undetermined in 27% (n = 10,923), ongoing in 19% of cases (n = 30,465), probable in 11% (n = 17,651), non-classifiable in 7% (n = 3,669) of patients, non-available in 2% (n = 3,669). D Mode of inheritance of diseases within the network. The mode of inheritance was undetermined in 46% of cases (n = 34,305), autosomal dominant in 25% of cases (n = 18,710), autosomal recessive in 11% of cases (n = 7,911), chromosomal in 10% of cases (n = 7,284), X-linked in 6% of cases (n = 4,477), suspected multifactorial in 1.3% of cases (n = 956), and mitochondrial in 0.4% of cases (n = 268). This information was optional
Fig. 3
Fig. 3
Focus on two chromosomal diseases (Williams (n = 681) and 22q11 microdeletion (n = 2,008) syndromes) and two monogenic diseases (Rubinstein-Taybi syndrome (n = 290) and Cornelia de Lange syndrome (n = 246)) as examples. A Birth measurements and term at birth. For each measurement by disease, number of patients. Cornelia de Lange syndrome: birth height (n = 99), birth weight (n = 110), head circumference (n = 97), term at birth (n = 252). 22q11 microdeletion syndrome: birth height (n = 764), birth weight (n = 862), head circumference (n = 710), term at birth (n = 2,033). Rubinstein Taybi syndrome: birth height (n = 171), birth weight (n = 184), head circumference (n = 150), term at birth (n = 295). Williams syndrome: birth height (n = 317), birth weight (n = 352), head circumference (n = 291), term at birth (n = 680). B Patient’s age at last visit. For each disease, number of patients: Cornelia de Lange syndrome (n = 246), 22q11 microdeletion syndrome (n = 1,998), Rubinstein-Taybi syndrome (n = 288), Williams syndrome (n = 680). C Patient’s age at first symptoms. For each disease, number of patients: Cornelia de Lange syndrome (n = 222), 22q11 microdeletion syndrome (n = 1,701), Rubinstein-Taybi syndrome (n = 256), Williams syndrome (n = 574). D Patients’ age at diagnosis. For each disease, number of patients: Cornelia de Lange syndrome (n = 123), 22q11 microdeletion syndrome (n = 1,251), Rubinstein-Taybi syndrome (n = 165), Williams syndrome (n = 395). On all graphs, Williams syndrome is represented in purple, 22q11 microdeletion syndrome in green, Rubinstein-Taybi syndrome in blue and Cornelia de Lange syndrome in red
Fig. 4
Fig. 4
Focus on chromosomal anomalies. A Chromosomal anomalies described (n = 11,950). The unbalanced structural anomalies are mostly described (59.4%, n = 7103) whereas number anomalies only represent 18.8% (n = 2247). B Unbalanced chromosomal anomalies described (n = 7,103). Distal deletion: 22.6% (n = 1603); proximal deletion: 34.9% (n = 2480); distal duplication: 10.2% (n = 724); proximal duplication 17.1% (n = 1218); duplication and deletion (only one chromosome): 3.3% (n = 234); proximal duplication (inserted elsewhere): 0.6% (n = 46); isochromosome: 1.4% (n = 98); Marker: 2.4% (n = 167); Missing data: 2.6% (n = 187); Other: 1.7% (n = 119); ring chromosome: 1.6%(n = 114); partial triplication/tetrasomy: 1.6% (n = 113).C Frequency of implication of each chromosome (n = 12,614). Chromosomal anomalies are more frequent for all acrocentric chromosomes as compared to non-acrocentric chromosomes, the more represented being chromosome 21 (n = 1,086; 8.6%), chromosome 15 (n = 856; 6.7%), and chromosome 22 (n = 849; 6.7%)
Fig. 5
Fig. 5
Distribution of chromosomal anomaly for the 3 most frequent chromosomes implicated, as well as chromosome 1, as an example of non-acrocentric chromosome. For these graphs, "del dist": distal deletion; "del prox": proximal deletion; "dup dist": distal duplication; "dup prox": proximal duplication on the same chromosome; "dup + del": duplication and deletion (only one chromosome); "dup + ins": proximal duplication (inserted elsewhere); "invpara": paracentric inversion; "invperi": pericentric inversion; "iso": isochromosome; "mar": Marker; "mat": maternal; "mono": monosomy; "pat": paternal;"ploid": triploidy/tetraploidy; "rec": reciprocal translocation; "ring": ring chromosome; "rob": robertsonian translocation; "tri": trisomy; "trip": partial triplication/tetrasomy; "Other": other anomalies. A Chromosome 1, reciprocal translocation was the most frequent chromosomal anomaly, followed by proximal and distal deletions. B Chromosome 15, proximal deletions or duplications were the most frequent chromosomal anomalies. C Chromosome 21, the trisomy of the whole chromosome was the most frequent chromosomal anomaly. D Chromosome 22, proximal deletions or duplications were the most frequent chromosomal anomalies

References

    1. Ministère des Solidarités et de la Santé. https://solidarites-sante.gouv.fr/soins-et-maladies/prises-en-charge-spe.... Accessed 18 May 2021.
    1. ORPHANET. About Rare Diseases: https://www.orpha.net/consor/cgi-bin/Education_AboutRareDiseases.php?lng=EN. Accessed 18 Nov 2020.
    1. Ministère des Solidarités et de la Santé. Building Consensus and Synergies for the Registration of Rare Disease Patients in the European DGOS. About rare diseases: https://solidarites-sante.gouv.fr/soins-et-maladies/prises-en-charge-spe.... Accessed 18 Nov 2020.
    1. Ministère des Solidarités et de la Santé. The “PNMR2”. https://solidarites-sante.gouv.fr/IMG/pdf/hcsp_pnmr2_evaluation.pdf. Accessed 18 Nov 2020
    1. European Commission. The European Reference Networks by the European Commission: https://ec.europa.eu/health/ern. Accessed 18 Nov 2020.