. 2021 Aug 4;7(32):eabf7561.
doi: 10.1126/sciadv.abf7561. Print 2021 Aug.

The exon-junction complex helicase eIF4A3 controls cell fate via coordinated regulation of ribosome biogenesis and translational output

Affiliations

The exon-junction complex helicase eIF4A3 controls cell fate via coordinated regulation of ribosome biogenesis and translational output

Dimitris C Kanellis et al. Sci Adv. .

Abstract

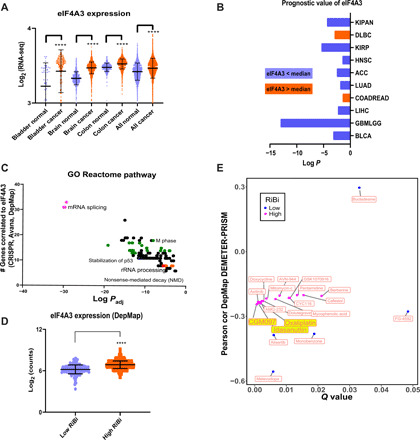
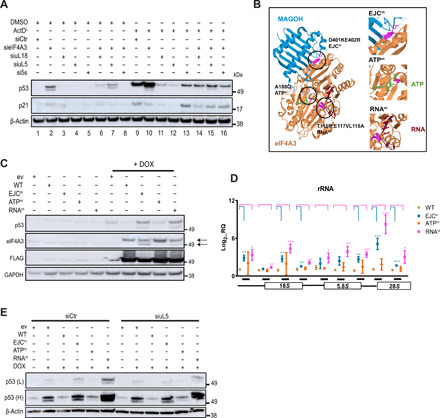
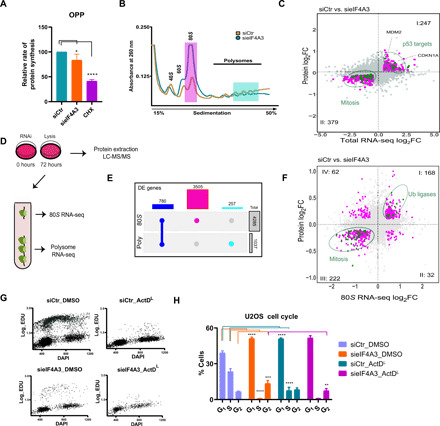
Eukaryotic initiation factor 4A-III (eIF4A3), a core helicase component of the exon junction complex, is essential for splicing, mRNA trafficking, and nonsense-mediated decay processes emerging as targets in cancer therapy. Here, we unravel eIF4A3's tumor-promoting function by demonstrating its role in ribosome biogenesis (RiBi) and p53 (de)regulation. Mechanistically, eIF4A3 resides in nucleoli within the small subunit processome and regulates rRNA processing via R-loop clearance. EIF4A3 depletion induces cell cycle arrest through impaired RiBi checkpoint-mediated p53 induction and reprogrammed translation of cell cycle regulators. Multilevel omics analysis following eIF4A3 depletion pinpoints pathways of cell death regulation and translation of alternative mouse double minute homolog 2 (MDM2) transcript isoforms that control p53. EIF4A3 expression and subnuclear localization among clinical cancer specimens correlate with the RiBi status rendering eIF4A3 an exploitable vulnerability in high-RiBi tumors. We propose a concept of eIF4A3's unexpected role in RiBi, with implications for cancer pathogenesis and treatment.


Figures

Fig. 1
Fig. 1. Elevated eIF4A3 expression in cancer is correlated with high RiBi rate and poor prognosis.
(A) Representative GENT2 (Gene Expression database of Normal and Tumor tissues 2)-derived comparison of eIF4A3 mRNA levels in various cancer types and their normal counterpart tissues (****P < 0.001). (B) Correlation of eIF4A3 mRNA expression levels to survival rates in all TCGA cancer types analyzed in LinkedOmics (abbreviations can be found in table S1A). Only cases with P < 0.05 (Cox regression analysis) are shown in color (blue, better prognosis correlates with lower than the median expression values of eIF4A3; orange, opposite kinetics). (C) Reactome pathway enrichment analysis of the 100 highest correlated genes to eIF4A3 in dependency score. Data were collected from 789 different cancer cell lines (DepMap and Avana 20Q3) and processed with ClueGO in Cytoscape. (D) eIF4A3 mRNA expression in low versus high RiBi addicted cell lines (DepMap and CCLE 2019). (E) Correlation of eIF4A3 dependency score (DepMap and DEMETER2) to the cytotoxicity of chemical compounds from the PRISM database (DepMap; cutoff, Q < 0.05; Pearson r < 0.2).
Fig. 2
Fig. 2. EIF4A3 localizes in transcriptionally active nucleoli and safeguards the nucleolar structure.
(A) Representative IF images of eIF4A3 localization in U2OS cells left either untreated or stimulated with the ribosomal stress facilitators ActDL and BMH-21. Insets depict magnifications of the regions designated in squares. Scale bar, 5 μm. DMSO, dimethyl sulfoxide. (B) Violin plot of high-content microscopy–based eIF4A3 nucleolar signal quantification under the experimental conditions described in (A). Nucleolar signal was calculated as the mean integrated intensity of endogenous eIF4A3 colocalizing with the nucleolar marker FBL. A total of 1000 to 2000 cells were analyzed per experiment (data are shown as means ± SD; n = 3 biological replicates; ****P < 0.001). a.u., arbitrary units. (C) Representative IF images of nucleolar structure in U2OS left untreated or treated with sieIF4A3, ActDL, or their combination. FBL and UBF were used as fibrillar center and dense fibrillar component markers, respectively. Insets depict magnifications of the regions designated in squares. Scale bar, 5 μm. (D) Representative IF images of the nucleolus under the same experimental conditions (A) using nucleophosmin 1 (NPM1) as a granular component (GC) marker. Scale bar, 5 μm. (E) Electron microscopy (EM) images showing the impact of sieIF4A3 ± ActDL on nucleolar morphology of U2OS cells. Dashed borders designate nucleoli. Scale bar, 2 μm. (F) Detection of eIF4A3 protein levels with immunocytochemistry in samples from patients with normal brain or glioblastoma. Regions in yellow squares are presented magnified in the bottom panel. Scale bar, 100 μm. (G) Same methodology in normal cervix or cervical squamous cell carcinoma specimens.
Fig. 3
Fig. 3. eIF4A3 knockdown induces p53 and alters the expression of genes regulating rRNA processing.
(A) Illustration depicting U2OS carrying the double DOX-inducible system (table S4B). Administration of DOX suppresses the endogenous eIF4A3, while inducing the ectopic expression of WT FLAG-eIF4A3. ev, empty vector. (B) p53 and eIF4A3 protein levels measured by immunoblotting in engineered U2OS following DOX-induced eIF4A3 knockdown using two different shRNAs and concomitant ectopic expression of FLAG-tagged eIF4A3. Arrows depict endogenous and ectopically expressed FLAG-eIF4A3. L, low exposure; H, high exposure. (C) Reactome pathway enrichment analysis of DE genes between siCtr- versus sieIF4A3-treated cells (DESeq2). Z score shows the overall expression trend (up- or down-regulation) of the genes included in a specific gene ontology (GO) term. Magenta points refer to cell cycle terms and green points to splicing. Data were produced with ClueGO in Cytoscape using the default parameters. (D) GO biological process (BP) analysis of genes referring to the term RNA metabolism (C) using ClueGO and Cytoscape. (E) Log2 fold change (log2FC) in mRNA levels of genes referring to term rRNA processing (D). (F) Starburst plot comparing expression of DE genes following sieIF4A3 or ActDL treatment of U2OS cells (R = 0.57, P < 0.001). (G) Reactome pathway enrichment analysis in common up-regulated genes among sieIF4A3 or ActDL (F, points shown in quadrant I). The inset explains the scaling used. TNF, tumor necrosis factor.
Fig. 4
Fig. 4. EIF4A3 binds the SSU processome and clears excessive R loops to secure unperturbed rRNA processing.
(A) Expression levels of different rRNA species in U2OS treated with siCtr or sieIF4A3 using multiple primer sets. The inset below the graph depicts primer positioning relative to 47S rRNA. RQ, relative quantification. (B) rDNA transcription rate in U2OS cells treated with siRNA against eIF4A3 ± ActDL measured with a luciferase reporter attached to rDNA promoter. (C) EU levels calculated following IF and high-content imaging of U2OS undergoing same treatments as in (B). A total of 1000 to 2000 cells were analyzed per experiment. (D) 5.8S rRNA levels calculated following IF and high-content imaging of U2OS undergoing same treatments as in (B). A total of 1000 to 2000 cells were analyzed per experiment. (E) U3 snoRNA expression levels following immunoprecipitation of eIF4A3 (RIP). (F) 18S rRNA expression levels following immunoprecipitation of eIF4A3 (RIP). (G) Scatterplot showing DE genes following cross-linking immunoprecipitation sequencing (CLIP-seq) data comparison between eIF4A3 and CASC3. The red dot designates U3 snoRNA (SNORD3A) enriched only in eIF4A3 CLIP. (H) Correlation plot between eIF4A3 and early rRNA processing factor BMS1 (DepMap and CCLE 2019). (I) Nucleolar R loop quantification following sieIF4A3 treatment ± RNAse H1 ectopic expression via DOX administration. R loops were detected using S9.6 IF and high-content imaging. All data in (B), (F), and (I) are shown as means ± SD, n = 3 biological replicates, *P < 0.05, **P < 0.01, ***P = 0.01, and ****P < 0.001; nonsignificant values are not shown.
Fig. 5
Fig. 5. EIF4A3’s EJC and RNA binding domains are essential for IRBC-mediated p53 induction.
(A) p53 and p21 levels measured by immunoblotting in U2OS treated with sieIF4A3 ± siRNAs against all components of the 5S RNP complex (uL18, uL5, and 5S rRNA) in the presence of ActDL or DMSO vehicle. (B) Left: Graphic illustration of the structural interaction between eIF4A3 (gold) and MAGOH (blue). Encircled residues in magenta refer to eIF4A3 amino acid positions subjected to mutagenesis. Right: Amplification of the mutated regions (green, ATP; red, RNA) (eIF4A3EJCm, D401KE402R; eIF4A3ATPm, A188Q; eIF4A3RNAm, T115R;E117VL118A; table S4A). (C) Immunoblotting showing p53, eIF4A3, and FLAG protein levels in engineered U2OS cells carrying WT or mutant eIF4A3 before and after DOX induction. Arrows depict endogenous and ectopically expressed FLAG-eIF4A3. GAPDH, glyceraldehyde-3-phosphate dehydrogenase. (D) Quantification of different rRNA species in U2OS ectopically expressing WT or mutant eIF4A3 using multiple primer sets. The inset below the graph depicts primer positioning relative to 47S rRNA. Data are shown as means ± SD; n = 3 biological replicates; *P < 0.05, **P < 0.01, and ***P = 0.01; nonsignificant values are not shown. (E) p53 protein levels in engineered U2OS cells following DOX-mediated induction of WT or mutant eIF4A3 ± siRNAs against uL5. (L), low exposure, (H), high exposure.
Fig. 6
Fig. 6. eIF4A3 knockdown promotes 80S monosome–mediated translation of stress-related genes and induces p53-mediated cell cycle arrest.
(A) OPP incorporation followed by high-content microscopy for the quantification of translation rates in U2OS treated with sieIF4A3 or CHX as control. A total of 1000 to 2000 cells were analyzed per experiment (data are shown as means ± SD; n = 3 biological replicates; *P < 0.05, ****P < 0.001). (B) Polysome profiling of U2OS cells following eIF4A3 knockdown and separation of the cell lysates in sucrose gradients. High-lightened regions depict fractions used in downstream analyses (magenta, 80S monosome; cyan, polysomes consisted of more than three ribosomes). (C) Starburst plot comparing DE genes in RNA and protein level following sieIF4A3 treatment of U2OS cells (R = 0.56, P < 0.001). (D) Graphic illustration of the experimental design for polysome profile RNA-seq and proteomic analysis. (E) UpSet plot among the DE genes affected by sieIF4A3 in the 80S monosome or polysome translation level. Blue, the common targets; magenta, the genes associated with 80S monosomes; cyan, the ones bound to the polysomes. (F) Starburst plot comparing DE genes in the translation (80S monosome) and protein level following sieIF4A3 treatment of U2OS cells (R = 0.45, P < 0.001, axis of quadrants I to III). (G) Representative 5-ethynyl-2′-deoxyuridine (EdU)–4′,6-diamidino-2-phenylindole (DAPI) IF intensity scatter plots following Click-IT EdU immunostaining of U2OS cells treated with sieIF4A3 ± ActDL (>1000 cells were analyzed per condition). Green points represent cells in S phase. (H) Cell cycle staging in U2OS following treatment with sieIF4A3 ± ActDL. The analysis was based on EdU incorporation and cyclin A1 immunostaining. A total of 1000 to 2000 cells were analyzed per experiment (data are shown as means ± SD; n = 3 biological replicates; **P < 0.01, ***P = 0.01, and ****P < 0.001; nonsignificant values are not shown).
Fig. 7
Fig. 7. Loss of eIF4A3 triggers apoptosis in a dual p53/non-p53–dependent manner.
(A) Starburst plot comparing expression of DE genes regulated translationally by the 80S monosome or the polysomes following sieIF4A3 treatment of U2OS cells. Common targets with monotonic deregulation are shown in orange (R = 0.79, P < 0.01). (B) Resazurin time course survival assay in U2OS deprived of eIF4A3 using two different shRNAs. (C) Percentage of caspase 3/7–positive apoptotic cells following eIF4A3 knockdown in U2OS cells. (D) Resazurin assay of WT or TP53 knockout HCT116 cells following eIF4A3 knockdown. (E) Resazurin assay in U2OS or ddp53-U2OS cells deprived of eIF4A3 with siRNA. (F) Immunoblotting of cleaved PARP in U2OS or ddp53-U2OS cells following knockdown of eIF4A3 ± siBAX [siRNA targeting BAX (BCL2 associated X, apoptosis regulator)] or/and siPUMA. (G) Comparative analysis of FAS protein levels between U2OS or ddp53-U2OS cells measured by Western blot following sieIF4A3 or siCtr treatment. Neocarzinostatin was used a positive control for induction of apoptosis. The numbers show quantitation of FAS/β-actin signal. (H) Starburst plot comparing DE genes between 80S monosome–based translational and the protein level. Green dots indicate genes affected from the transcriptional throughout the translational and protein level (forward). Magenta dots show genes that are regulated transcriptionally but are subjected to extratranslational regulation control (intensified) (R = 0.83, P < 0.001). (I) Starburst plot comparing DE genes between polysome-based translational and the protein level. The color coding is the same as in (H) (R = 0.76, P < 0.001). All data in (B) to (E) are shown as means ± SD; n = 3 biological replicates; **P < 0.01 and ****P < 0.001).
Fig. 8
Fig. 8. Depletion of eIF4A3 causes p53-mediated production of aberrant MDM2 transcript isoforms.
(A) Venn diagram depicting p53 targets deregulated by sieIF4A3 treatment of U2OS in the translational (80S monosome and polysomes) and the protein level. MDM2 is altered both in the translatome (80S monosomes) and the protein level. (B) MDM2 protein levels in U2OS treated with sieIF4A3, camptothecin (CPT), 5- fluorouracil (5-FU), or ActDL. The arrows depict the sieIF4A3-specific MDM2 protein products, and the asterisk indicates the main MDM2 protein product. n.s., nonspecific band. (C) MDM2 protein levels following eIF4A3 chemical inhibition in U2OS. The arrows depict the sieIF4A3-specific MDM2 protein products, and the asterisk indicates the main MDM2 protein product. (D) MDM2 mRNA levels measured with RT-PCR following sieIF4A3 ± ActDL treatment of U2OS cells. Arrows indicate MDM2 transcript isoforms present only in samples treated with siRNA against eIF4A3. MW, molecular weight. (E) Starburst plot comparing sieIF4A3-induced DE genes in the RNA (Salmon) and the translational level of 80S monosomes. Orange dots designate genes of all biotypes commonly affected in both levels and cyan the common genes that are also NMD targets (R = 0.24, P < 0.001).
Fig. 9
Fig. 9. Illustrated model summary of the role of eIF4A3 in splicing, RiBi, and MDM2-p53 control.
Normal condition (left): eIF4A3 resides both at perispeckles where it assists Pol II–transcribed mRNA splicing and at the nucleoli where it mediates rRNA processing by clearing excessive R loops. Processed rRNA binds RPs to produce ribosomes that subsequently exit the nucleus to translate mRNAs in the cytoplasm. This previously unidentified role of eIF4A3 in RiBi is hijacked in a wide spectrum of human tumors, by mutations, overexpression, or selective nucleolar localization (right): In cases of reduced eIF4A3 levels [e.g., RNAi and RCPS (Richieri Costa-Pereira syndrome)], rRNA processing is compromised and nucleolar morphology changes. This causes ribosomal stress followed by p53-mediated cell cycle arrest and translational reprogramming that favors the production of stress-related proteins (e.g., cell cycle and apoptosis), allowing the cell to adequately react to stress. At the same time, the absence of eIF4A3 affects splicing downstream of Pol II transcription and allows production of alterative transcript isoforms, which, in the case of MDM2 (alt-MDM2), affect the negative p53-MDM2 feedback loop keeping p53 levels high (circled arrows). Nu, nucleolus; Np, nucleoplasm; Cp, cytoplasm; FC, fibrillar center; DFC, dense fibrillar component; GC, granular component.

References

    1. Peña C., Hurt E., Panse V. G., Eukaryotic ribosome assembly, transport and quality control. Nat. Struct. Mol. Biol. 24, 689–699 (2017). - PubMed
    1. Turi Z., Lacey M., Mistrik M., Moudry P., Impaired ribosome biogenesis: Mechanisms and relevance to cancer and aging. Aging 11, 2512–2540 (2019). - PMC - PubMed
    1. Bursać S., Prodan Y., Pullen N., Bartek J., Volarević S., Dysregulated ribosome biogenesis reveals therapeutic liabilities in cancer. Trends Cancer 7, 57–76 (2021). - PubMed
    1. Danilova N., Gazda H. T., Ribosomopathies: How a common root can cause a tree of pathologies. Dis. Model. Mech. 8, 1013–1026 (2015). - PMC - PubMed
    1. Khot A., Brajanovski N., Cameron D. P., Hein N., Maclachlan K. H., Sanij E., Lim J., Soong J., Link E., Blombery P., Thompson E. R., Fellowes A., Sheppard K. E., McArthur G. A., Pearson R. B., Hannan R. D., Poortinga G., Harrison S. J., First-in-human RNA polymerase I transcription inhibitor CX-5461 in patients with advanced hematologic cancers: Results of a phase I dose-escalation study. Cancer Discov. 9, 1036–1049 (2019). - PubMed

Publication types

MeSH terms