. 2021 Sep 14;97(11):e1123-e1131.
doi: 10.1212/WNL.0000000000012482. Epub 2021 Aug 4.

Association of Midlife Plasma Amyloid-β Levels With Cognitive Impairment in Late Life: The ARIC Neurocognitive Study

Affiliations

Association of Midlife Plasma Amyloid-β Levels With Cognitive Impairment in Late Life: The ARIC Neurocognitive Study

Kevin J Sullivan et al. Neurology. .

Abstract

Background and objectives: To evaluate the association between midlife plasma amyloid-β (Aβ1-42, Aβ1-40, Aβ42:Aβ40) and risk of mild cognitive impairment (MCI) and dementia.

Methods: Plasma Aβ42 and Aβ40 were retrospectively measured with a fluorometric bead-based immunoassay in a subsample of the Atherosclerosis Risk in Communities cohort study. We investigated the relationship of plasma Aβ42, Aβ40, and Aβ42:Aβ40 ratio measured in midlife and late life and the change from midlife to late life to risk of MCI, dementia, and combined MCI/dementia outcomes in late life (from 2011-2019). We used multinomial logistic regressions estimating relative risk ratios (RRRs) of these cognitive outcomes vs cognitively normal adjusted for age, sex, education, site-race, APOE, hypertension, diabetes, and body mass index.

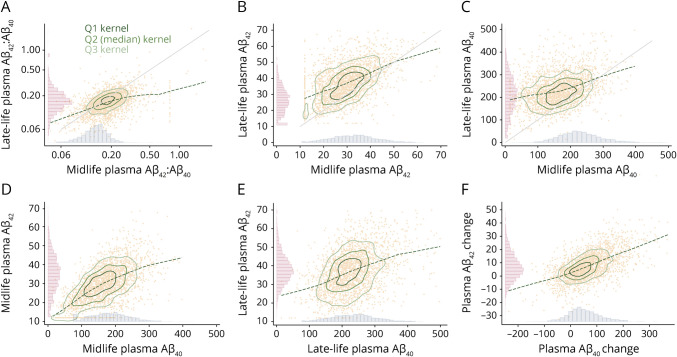
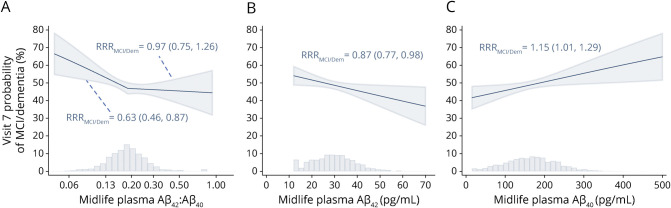
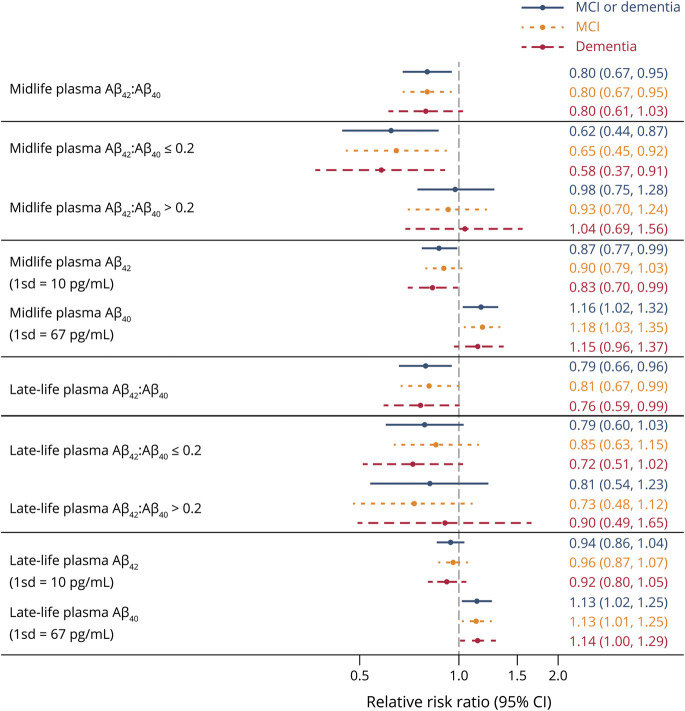
Results: A total of 2,284 participants were included (midlife mean age 59.2 ± 5.2, 57% female, 22% Black). Each doubling of midlife Aβ42:Aβ40 was associated with 37% lower risk of MCI/dementia (RRR 0.63, 95% confidence interval [CI] 0.46-0.87), but only up to approximately the median (spline model threshold 0.20). Every 1-SD increase in plasma Aβ42 (10 pg/mL) was associated with 13% lower risk of MCI/dementia (RRR 0.87, 95% CI 0.77-0.98), whereas every 1-SD increase in plasma Aβ40 (67 pg/mL) was associated with 15% higher risk of MCI/dementia (RRR 1.15, 95% CI 1.01-1.29). Associations were comparable but slightly weaker statistically when models were repeated using late-life plasma Aβ predictors. Aβ42 and Aβ40 increased from midlife to late life, but changes were not associated with cognitive outcomes.

Discussion: Midlife measurement of plasma Aβ may have utility as a blood-based biomarker indicative of risk for future cognitive impairment.


Figures

Figure 1
Figure 1. Midlife and Late-Life Plasma Aβ Distributions and Scatterplots Concurrently and Cross-Temporally
Graphs display histograms of plasma amyloid-β (Aβ) distributions (picograms per milliliter or ratio) at midlife and late life. Change scores (midlife − late life; picograms per milliliter) reflect increases in Aβ42 and Aβ40 from midlife to late life. Individual observations are plotted with a lowess smoother and kernel density plots representing quartiles 1, 2 (median), and 3 of the data. Forty-six observations with Aβ42 or Aβ40 values exceeding 70 or 500 pg/mL, respectively, were removed for enhanced visualization. Ratio distributions in panel A have been log2 transformed to approximate normality. (A) Late-life and midlife plasma Aβ42:Aβ40; correlation 0.487. (B) Late-life and midlife plasma Aβ42 (picograms per milliliter); correlation 0.486. (C) Late-life and midlife plasma Aβ40 (picograms per milliliter); correlation 0.313. (D) Midlife plasma Aβ42 (picograms per milliliter) and Aβ40 (picograms per milliliter); correlation 0.612. (E) Late-life plasma Aβ42 (picograms per milliliter) and Aβ40 (picograms per milliliter); correlation 0.470. (F) Change in plasma Aβ42 (picograms per milliliter) and plasma Aβ40 (picograms per milliliter); correlation 0.612.
Figure 2
Figure 2. Midlife (Visit 3) Plasma Aβ Associations With Visit 7 MCI/Dementia Probabilities
Relative risk ratio (RRRs; normal referent) given with 95% confidence limits. Histograms display the midlife distributions of amyloid-β42 (Aβ42):Aβ40, Aβ42, and Aβ40. Two observations with Aβ42 or Aβ40 values exceeding 70 or 500 pg/mL, respectively, were removed for enhanced visualization. (A) Each doubling of Aβ42:Aβ40 when Aβ42:Aβ40 is ≤0.20 was associated with an RRR of mild cognitive impairment (MCI)/dementia vs normal of 0.63 (p = 0.005). Each doubling of Aβ42:Aβ40 when Aβ42:Aβ40 is >0.2 was associated with an RRR of MCI/dementia vs normal of 0.97 (p = 0.813). (B) Each 1-SD-higher Aβ42 (10 pg/mL) across the entire spectrum of Aβ42 was associated with an RRR of MCI/dementia vs normal of 0.87 (p = 0.026). (C) Each 1-SD-higher Aβ40 (67 pg/mL) across the entire spectrum of Aβ40 was associated with an RRR of MCI/dementia vs normal of 1.15 (p = 0.030).
Figure 3
Figure 3. Midlife (Visit 3) and Late-Life (Visit 5) Plasma Aβ Associations With Visit 7 Cognitive Status
Estimates represent relative risk ratios (RRRs; and 95% confidence intervals [CIs]) from multinomial models adjusted for age, sex, race-site, education, hypertension, diabetes, body mass index, and APOE ε4. Referent group was cognitively normal. All estimates are from separate models for linear amyloid-β (Aβ) ratio, Aβ ratio with splines, and continuous Aβ42 and Aβ40 at each visit.

References

    1. Jack CR Jr, Bennett DA, Blennow K, et al. . NIA-AA Research Framework: toward a biological definition of Alzheimer's disease. Alzheimers Dement. 2018;14(4):535-562. - PMC - PubMed
    1. Verberk IMW, Slot RE, Verfaillie SCJ, et al. . Plasma amyloid as prescreener for the earliest Alzheimer pathological changes. Ann Neurol. 2018;84(5):648-658. doi:10.1002/ana.25334. - DOI - PMC - PubMed
    1. Nakamura A, Kaneko N, Villemagne VL, et al. . High performance plasma amyloid-beta biomarkers for Alzheimer's disease. Nature. 2018;554(7691):249-254. - PubMed
    1. Schindler SE, Bollinger JG, Ovod V, et al. . High-precision plasma beta-amyloid 42/40 predicts current and future brain amyloidosis. Neurology. 2019;93(17):e1647–e1659. - PMC - PubMed
    1. Ovod V, Ramsey KN, Mawuenyega KG, et al. . Amyloid beta concentrations and stable isotope labeling kinetics of human plasma specific to central nervous system amyloidosis. Alzheimers Dement. 2017;13(8):841-849. - PMC - PubMed

Publication types

Substances