. 2021 Aug 4;7(1):60.
doi: 10.1038/s41421-021-00296-9.

Dysregulated hematopoiesis in bone marrow marks severe COVID-19

Affiliations

Dysregulated hematopoiesis in bone marrow marks severe COVID-19

Xin Wang et al. Cell Discov. .

Abstract

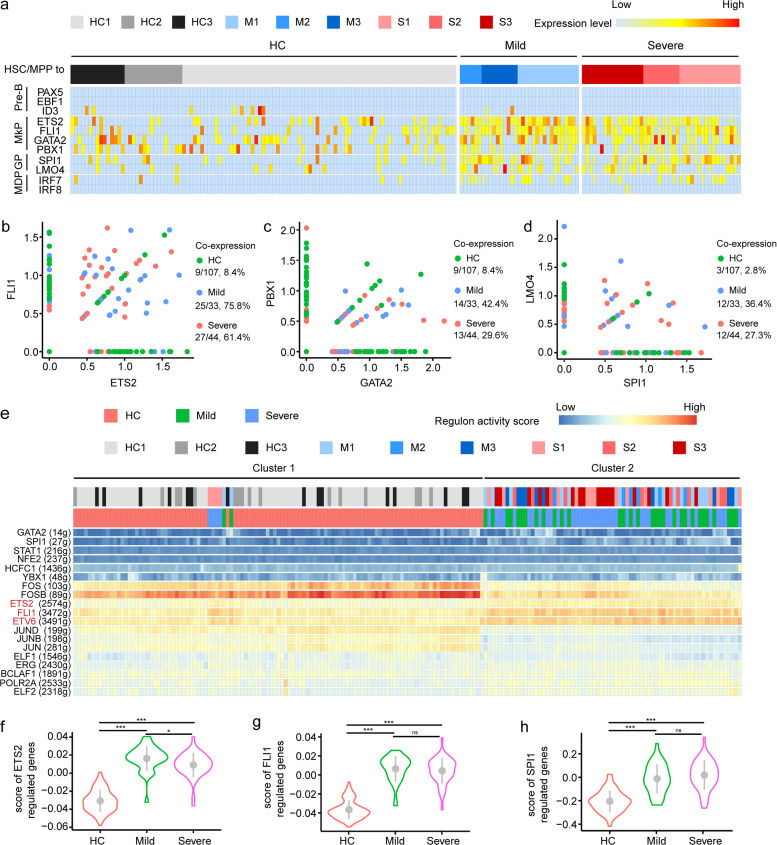
Severe coronavirus disease 2019 (COVID-19) is often indicated by lymphopenia and increased myelopoiesis; however, the underlying mechanism is still unclear, especially the alteration of hematopoiesis. It is important to explore to what extent and how hematopoietic stem cells contribute to the impairment of peripheral lymphoid and myeloid compartments in COVID-19 patients. In this study, we used single-cell RNA sequencing to assess bone marrow mononuclear cells from COVID-19 patients with peripheral blood mononuclear cells as control. The results showed that the hematopoietic stem cells in these patients were mainly in the G1 phase and prone to apoptosis, with immune activation and anti-viral responses. Importantly, a significant accumulation of immature myeloid progenitors and a dramatic reduction of lymphoid progenitors in severe cases were identified, along with the up-regulation of transcription factors (such as SPI1, LMO4, ETS2, FLI1, and GATA2) that are important for the hematopoietic stem cell or multipotent progenitor to differentiate into downstream progenitors. Our results indicate a dysregulated hematopoiesis in patients with severe COVID-19.


Conflict of interest statement

The authors declare no competing interests.

Figures

Fig. 1
Fig. 1. Characterization of BMMC compartments in COVID-19 patients.
a Schematic diagram of the experimental design. ScRNA-seq of BMMCs derived from six COVID-19 patients and three age-matched HCs from public library were analyzed. b Feature plot of transcription activities for the marker genes of major cell types. c UMAP display of a total of 39,090 BMMCs. Five major cell types are indicated. d UMAP display of the distributions of BMMCs from HCs, mild, and severe patients. e Proportions of four major cell types (excluding erythrocytes) in BMMCs for HCs, mild, and severe patients. f UMAP display of 20 clusters. g Heatmap showing the relative expression of marker genes for each cell type. Colors indicate expression, while the size of the circles represents the proportion of expressed cells. h Proportions of total T cells, total monocytes, and total granulocytes in HCs, mild, and severe patients. i Fraction of CD4+ naïve T cells and CD4+ memory T cells among total cells. j Percentage of CD14+ monocyte among total cells. k Proportion of LTF+ granulocytes among total cells. l Ratio of total B cells, plasma cells, and immature B cells among total cells. m The aligned reads of the BMMC scRNA-seq dataset to the SARS-CoV-2 genome. The blue circle represents the genome of SARS-CoV-2, while red and gray circles represent positive control (previously reported BALF scRNA-seq dataset from COVID-19 patients) and BMMC samples, respectively. n Viral-Track analysis of the BMMCs scRNA-seq dataset. Only the positive control dataset (scRNA-seq data from BALF of COVID-19 patients) showed QC passed (diamond dot) signals of SARS-CoV-2. P values for pairwise comparisons were calculated, unpaired two-sided Student’s t-test, *P < 0.05, **P < 0.01, ***P < 0.001, n.s., not significant.
Fig. 2
Fig. 2. Annotation of HSPCs by cell-specific markers and immunophenotype-based reference dataset.
a Violin plots show the expression of cell-specific markers for nine HSPC clusters. b Label transfer of HSC/MPP population according to an immunophenotype-based reference dataset. c UMAP displays the distribution of nine cell clusters of HSPCs. dl The proportion of nine clusters in HSPCs from HC and COVID-19 patients. P values for pairwise comparisons were calculated, unpaired two-sided Student’s t-test, *P < 0.05, **P < 0.01, ***P < 0.001, n.s., not significant.
Fig. 3
Fig. 3. Perturbed differentiation tendency of HSC/MPP in COVID-19 patients.
a Percentages of G1, S, and G2M phase for HSC/MPP population from HC and COVID-19 patients. b Enriched GO terms of up-regulated genes in the HSC/MPP population from COVID-19 patients. Three pathways were clustered into immune response-associated pathways, three were identified associated with virus response, two were related to apoptosis and autophagy, and five pathways participated in the processes of differentiation. c Heatmap showing the significant different expression patterns of IFN-stimulated genes in the HC, mild, and severe groups. d GSEA analysis of transcriptome comparisons in HSC/MPP shows that the KEGG pathway “Apoptosis” (Entry ID: hsa04210) was enriched in COVID-19 patients vs controls. e Proportion of Annexin V+ HSC in total HSC with flow cytometry. Results were compared among the HC, mild group, and severe group and two positive controls (PC). f Stemness signature scores of HSPCs from HC, mild, and severe patients projected onto 2c graph. Red color represents a higher stem score. g, h Gene pairwise Spearman correlation within the 90%–95% (HC) and 95%–100% (Mild group, Severe group) of the stem score. g The projection of corresponding cells onto the core model with corresponding percentile. h The heatmap of gene pairwise Spearman correlation. i RNA velocity analysis of HSPC cells among the HC, mild, and severe group. Upper panel projects the velocity field onto the UMAP plot of HSPC in the three groups. Lower panel shows the numbers and ratios of predicted differentiation endpoint of HSC/MPPs in the three groups.
Fig. 4
Fig. 4. Transcriptional regulation underlies HSC/MPP from COVID-19 patients.
a Heatmap displays the expression levels of lineage-priming TFs for HSC/MPP cells from HCs, mild, and severe patients. Five gene modules involved in hematopoiesis differentiation are presented, including pre-B (PAX5, EBF1, and ID3), MkP (ETS2, FLI1, GATA2, and PBX1), GP (SPI1, LMO4), and MDP (IRF7, IRF8). bd Co-expression of selected TFs was assessed across different groups. e Heatmap showing the regulon activity scores (RASs) of lineage-related TFs for HSC/MPP cells from HCs, mild, and severe patients. 184 HSC/MPP cells were arranged by unsupervised clustering according to their regulon activities. fh Score of specific TF-regulated genes in three groups.
Fig. 5
Fig. 5. Analysis of B cells from BMMCs and paired PBMCs and production of SARS-CoV-2-specific antibody in COVID-19 patients.
a UMAP plot of B cells from BMMCs and PBMCs. b, c Proportion of B cells among total cells and three types of B cells among total B cells, with results from PBMC samples (b) and BMMC samples (c). d Somatic hypermutation rate of IGHV, IGKV, and IGLV from three groups and two origins. e Total SARS-CoV-2-specific antibody titers and SARS-CoV-2-specific IgG titers of six patients at different time points after symptom onset. The BM puncture was done between the 18th and 31st day after symptom onset.
Fig. 6
Fig. 6. Immature and dysfunctional-like GMP was accumulated in severe COVID-19 patients.
a UMAP plot of three clusters of GMP, namely GMP 1, GMP 2, and GMP 3. b Differential expression genes of three GMP clusters. c Density plot of three GMP clusters in three groups. d Up-regulation or down-regulation of GO pathway “Neutrophil-mediated immunity” in three clusters of GMP. e DRP score and NA score of the three GMP types. f, g GSEA analysis of GMP 1, GMP 2, and GMP 3 on the three hallmark pathways.

Similar articles

Cited by

References

    1. Lai C-C, Shih T-P, Ko W-C, Tang H-J, Hsueh P-R. Severe acute respiratory syndrome coronavirus 2 (SARS-CoV-2) and corona virus disease-2019 (COVID-19): the epidemic and the challenges. Int. J. Antimicrob. Agents. 2020;55:105924. doi: 10.1016/j.ijantimicag.2020.105924. - DOI - PMC - PubMed
    1. Mehta P, et al. COVID-19: consider cytokine storm syndromes and immunosuppression. Lancet. 2020;395:1033–1034. doi: 10.1016/S0140-6736(20)30628-0. - DOI - PMC - PubMed
    1. Wu Z, McGoogan JM. Characteristics of and important lessons from the coronavirus disease 2019 (COVID-19) outbreak in China: summary of a report of 72 314 cases from the Chinese Center for Disease Control and Prevention. JAMA. 2020;323:1239–1242. doi: 10.1001/jama.2020.2648. - DOI - PubMed
    1. Gandhi RT, Lynch JB, del Rio C. Mild or moderate COVID-19. N. Engl. J. Med. 2020;383:1757–1766. doi: 10.1056/NEJMcp2009249. - DOI - PubMed
    1. Tan L, et al. Lymphopenia predicts disease severity of COVID-19: a descriptive and predictive study. Signal Transduct. Target. Ther. 2020;5:33. doi: 10.1038/s41392-020-0148-4. - DOI - PMC - PubMed