Review
. 2021 Aug 4;10(1):161.
doi: 10.1038/s41377-021-00599-2.

Advances of surface-enhanced Raman and IR spectroscopies: from nano/microstructures to macro-optical design

Affiliations
Review

Advances of surface-enhanced Raman and IR spectroscopies: from nano/microstructures to macro-optical design

Hai-Long Wang et al. Light Sci Appl. .

Abstract

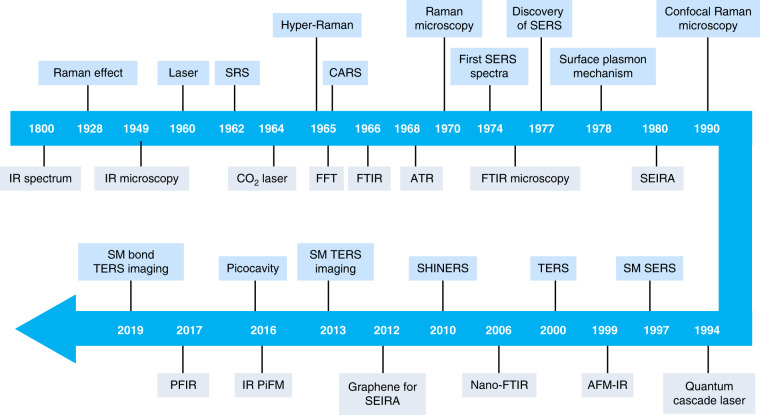
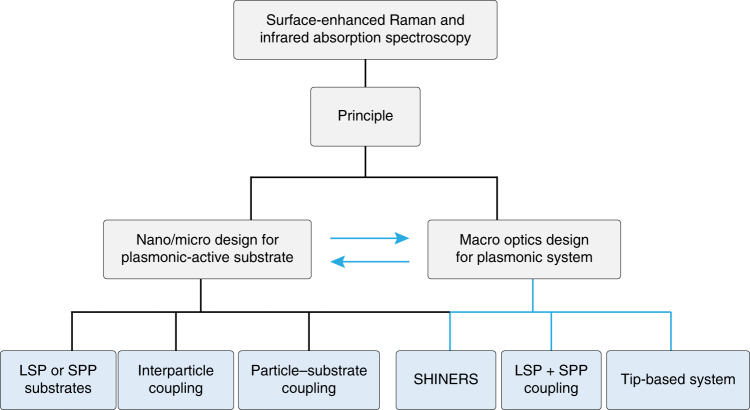
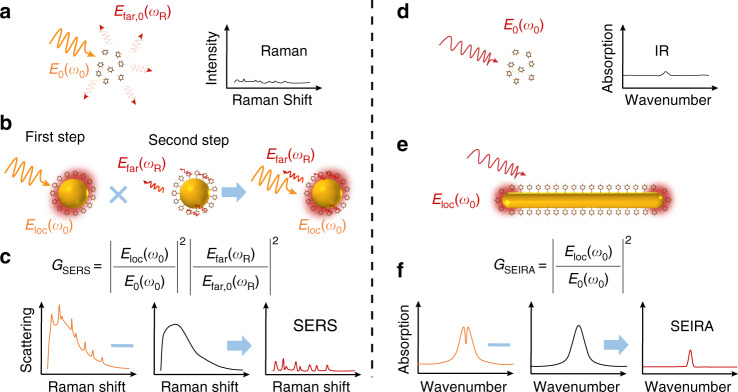
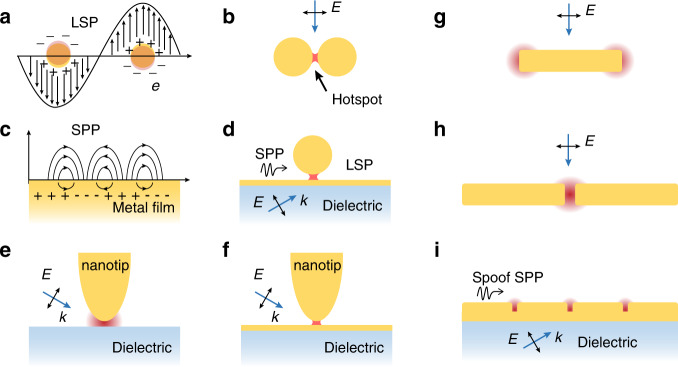
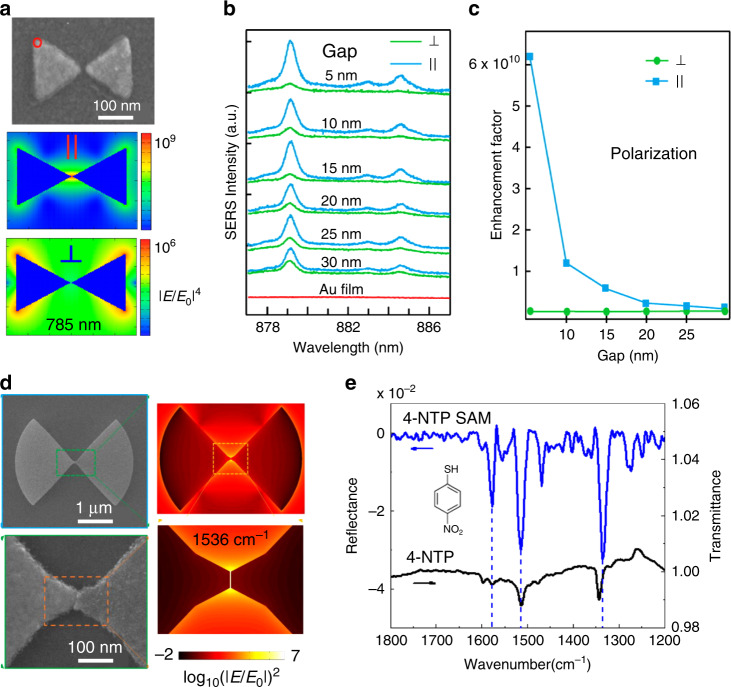
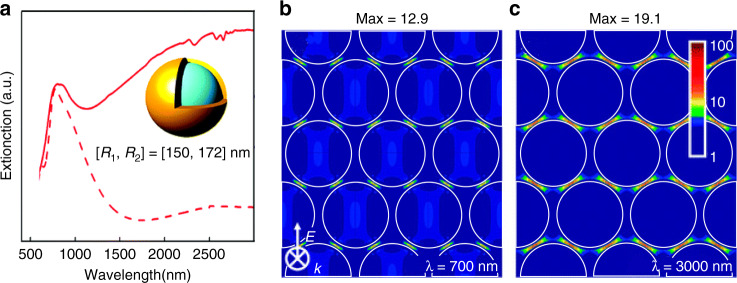
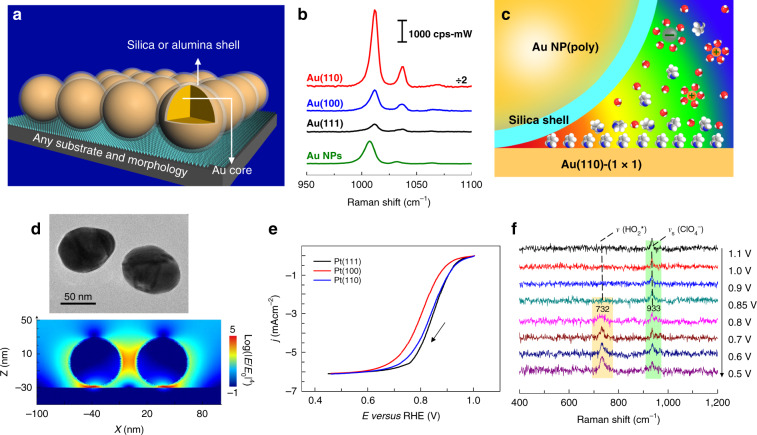
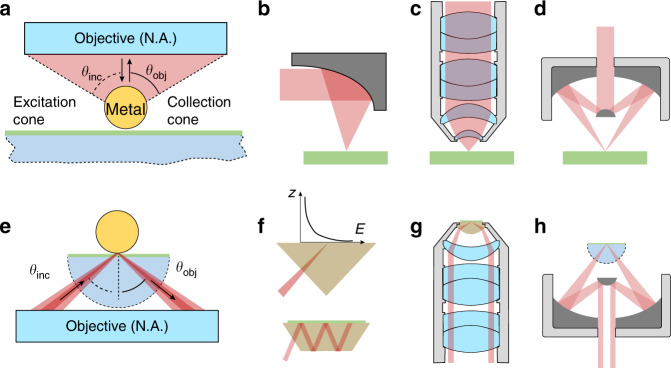
Raman and infrared (IR) spectroscopy are powerful analytical techniques, but have intrinsically low detection sensitivity. There have been three major steps (i) to advance the optical system of the light excitation, collection, and detection since 1920s, (ii) to utilize nanostructure-based surface-enhanced Raman scattering (SERS) and surface-enhanced infrared absorption (SEIRA) since 1990s, and (iii) to rationally couple (i) and (ii) for maximizing the total detection sensitivity since 2010s. After surveying the history of SERS and SEIRA, we outline the principle of plasmonics and the different mechanisms of SERS and SEIRA. We describe various interactions of light with nano/microstructures, localized surface plasmon, surface plasmon polariton, and lightning-rod effect. Their coupling effects can significantly increase the surface sensitivity by designing nanoparticle-nanoparticle and nanoparticle-substrate configuration. As the nano/microstructures have specific optical near-field and far-field behaviors, we focus on how to systematically design the macro-optical systems to maximize the excitation efficiency and detection sensitivity. We enumerate the key optical designs in particular ATR-based operation modes of directional excitation and emission from visible to IR spectral region. We also present some latest advancements on scanning-probe microscopy-based nanoscale spectroscopy. Finally, prospects and further developments of this field are given with emphasis on emerging techniques and methodologies.


Conflict of interest statement

The authors declare no competing interests.

Figures

Fig. 1
Fig. 1. A timeline of historical advances in SERS, SEIRA, and related techniques.
SRS stimulated Raman scattering, Hyper-Raman Hyper-Raman scattering, CARS coherent anti-Stokes Raman scattering, FFT fast Fourier transform, FTIR Fourier transform infrared spectroscopy, ATR Attenuated total reflectance, SEIRA surface-enhanced infrared absorption spectroscopy, SM single molecule, TERS tip-enhanced Raman spectroscopy, SHINERS shell-isolated nanoparticle-enhanced Raman spectroscopy, PFIR, peak force infrared microscopy, IR PiFM, infrared photoinduced force microscopy, Nano-FTIR Fourier transform infrared nanospectroscopy, AFM-IR Atomic force microscopy-based infrared spectroscopy
Fig. 2
Fig. 2. Optical design from nano/micro substrates to macro-optics for SERS and SEIRA.
Nano/micro designs are the key elements of SERS and SEIRA, which determines the sensitivity of SERS and SEIRA. Macro-optical designs depend on the features of nano/micro structured substrates
Fig. 3
Fig. 3. Principles of SERS and SEIRA.
a Normal Raman scattering Efar,0ωR and Raman spectrum of molecules illuminated by narrow band laser. b Surface-enhanced Raman scattering from molecules adsorbed onto the metal nanosphere. Local field Elocω0 around metal nanosphere is enhanced by localized surface polasmon polaritons (LSP) around the metal nanosphere. The excitation and radiation efficiency EfarωR of Raman scattering from molecules are improved in the local field via the interaction with LSP. Thus, the Raman scattering will be enhanced by GSERS. c Data processing for SERS spectrum. Raw spectrum (left) from molecules adsorbed on nanosphere contains photoluminescence (PL) spectrum (middle) and molecular SERS spectrum (right). d Normal IR spectrum of molecules illuminated by IR laser. e LSP around metal nanorod is excited by IR laser. Local field Elocω0 at the nanorod’s two ends is enhanced by LSP. IR absorption of molecules in the local field is enhanced by GSEIRA. f Data processing for SEIRA. Raw spectrum (left) from molecules adsorbed on nanorod contains nanorod (middle) and molecular absorption (right). Owing to the coupling between the plasmon and the molecular vibration, the SEIRA spectrum (left) often shows a asymmetric peak or a dip when the molecules absorb IR laser
Fig. 4
Fig. 4. SERS and SEIRA-active nano/microstructures.
a A single nanoparticle supporting a LSP, and b a nanoparticle dimer with a nanogap supporting a coupled LSP. c A metal film supporting a SPP, and d a particle-on-film coupled structure supporting the SPP-LSP coupling. e A nanotip supporting LSP and acting as a lightning rod, and f a nanotip-film coupled structure. g A nanorod, h A nanorod dimer. i A metal strip with periodic grooves supporting a SPP in IR region, which is called a spoof spp. af the substrates for SERS, gi the substrates for SEIRA
Fig. 5
Fig. 5. Dimers for SERS and SEIRA.
a SEM image of prism dimers and simulated electric field contour plot of both polarizations. b SERS spectra of 2-naphthalenethiol SAM excited by 785 nm laser, and c SERS enhancement factor of prism dimers with varying gaps between prisms for both polarizations. Reproduced with permission from ref. . Copyright (2013) American Chemical Society d SEM and simulated electric field distribution of a bowtie antenna (at 1536 cm–1). e SEIRA of 4-NTP SAM on a single antenna. Reference spectra of solid-state 4-NTP are shown in black with prominent vibrations indicated by dashed lines. Reproduced with permission from ref. . Copyright (2017) American Chemical Society
Fig. 6
Fig. 6. Multi-nanoparticles for SERS and SEIRA.
a Extinction spectra of a typical hexagonal close-packed (hcp) Au nanoshell array (solid line) and that of an isolated nanoshell with the same size (dashed line). The inner radius of the core is 150 nm and the thickness of the gold shell is 22 nm. The separation between adjacent nanoshells is 8 nm. b and c The local electromagnetic field enhancements of an HCP Au nanoshell array at wavelengths of 700 and 3000 nm, respectively. Reproduced ac with permission from ref. . Copyright (2008) American Chemical Society
Fig. 7
Fig. 7. SHINERS for surface detection.
a SHINERS on a substrate. b SHINERS spectra of pyridine adsorbed on Au(111), Au(100), and Au(110) at 0.00 V. Solution: 10 mM pyridine + 0.1 M NaClO4. SERS spectra of pyridine on bare 55 nm gold NPs at different potentials. c Schematic diagrams of the SHINERS experiments. The EM field strength is represented by the following color code: red (strong) and blue (weak). d TEM and simulated images. 3D-FDTD simulations of four SHINs with a model of a 2 × 2 array on a Pt substrate. E and E0 represent the localized electric field and the incident electric field, respectively. e Polarization curves of the ORR process at three Pt(hkl) RDEs in oxygen-saturated 0.1 M HClO4 solutions; the rotation rate was 1600 r.p.m. and the scan rate was 50 mV s−1. j and E represent the current density and potential, respectively. f EC-SHINERS spectra of the ORR system at a Pt(111) electrode surface in a 0.1 M HClO4 solution saturated with O2
Fig. 8
Fig. 8. Excitation and collection optics for SERS and SEIRA.
a Traditional excitation and collection cone for SERS and SEIRA. b Reflective focus mirror, c traditional refractive, and d reflective objectives to excite and collect SERS and SEIRA. e Fine designed excitation and collection hollow cone for SERS and SEIRA. f Prism and waveguide-based excitation optics, g prism integrated refractive, and h reflective objectives to excite and collect SERS and SEIRA signals
Fig. 9
Fig. 9. ATR-SERS and ATR-SEIRA optics for LSP and SPP coupling.
a Schematic diagram of a Kretschmann SPR sensor. b AOI-dependent SERS spectra on silver film and nanoparticle-modified silver film modified by 4-Mpy single-layer molecule. c The SERS spectra of 4-Mpy on silver film and nanoparticle-modified silver film at an incident angle of SPR angle. Adapted ac with permission from ref. Copyright (2011) Royal Society of Chemistry. d Schematic diagram of ATR-SEIRAS configuration containing a ZnSe hemicylindrical prism and metal island film. e ATR-SEIRA spectra of a Pt film electrode in CO-saturated 0.1 M HClO4 at −0.2 V. Spectra 1a and 2a were recorded at the incidence angle θ = 20°, and spectra 1b and 2b at θ = 70° with ZnSe/air/Si (1a and 1b) and ZnSe/water/Si (2a and 2b) windows, respectively. f SEIRA band intensity for COL on the Pt electrode as a function of θ, measured with the ZnSe hemicylindrical prism. Reprinted df with permission from ref. Copyright (2008) American Chemical Society
Fig. 10
Fig. 10. Angle-resolved SERS optics for NP aggregations.
a Scheme of the angle-resolved SERS detection. b SEM image of the dimer antenna. c SEM image of the trimer antenna. d SERS Fourier image of gold dimer nanoantenna. e SERS Fourier image of gold trimer nanoantenna. Reprinted with permission from ref. . Copyright (2011) American Chemical Society
Fig. 11
Fig. 11. Excitation and collection optics for nanoparticle on a film.
a Custom-designed objective for excitation and collection of nanoparticle on a film for SERS. p-ATP monomolecular layer was assembled on the surface of silver film. b AOI dependent SERS spectra of NOF decorated by p-ATP monomolecular layer. c and d Directional emission of SERS signal (690 cm−1 and 2212 cm−1) from nanoparticle on a film substrate. e Schematics of the ATRc-SHINERS optics. Directional emission of SERS signal in Otto ATR-Raman, SHINERS and ATRc-SHINERS configurations from f Mica and g Si substrates. h Directional emission of SERS signal in ATR-Raman, SHINERS and ATRc-SHINERS configurations from an Au substrate. The Raman-scattered wavelength is 700 nm, corresponding to the Raman shift at 1,500 cm−1. i Incident angle and thickness of water space-dependent electrical field on the Au surface. Excitation wavelength is 633 nm. j Local field enhancement with different excitation optics
Fig. 12
Fig. 12. Macro-optics for EC-TERS.
a Schematic illustration of the EC-TERS. b Calculated plasmonic electric field (E2) distribution when the Ag tip is positioned on the Au surface. Inset: scanning electron microscope image of the Ag tip. c Calculated E2 profile on the substrate surface in the plasmonic gap. Red line is fitted using a Gaussian function. d Color-coded intensity map of the line-trace TERS spectra across a reaction region. The reaction was induced at the sample potential of −0.4 V under a laser power of 0.7 mW. The line-trace TERS spectra were acquired with the sample potential at −0.7 V. Bias: 100 mV, Itunneling: 800 pA. e Plots of intensities of the 998 cm−1 peak (top) and 1400 cm−1 peak (bottom) with the tip position. The open triangle, circle symbols represent the intensities in the trace and retrace spectra. The solid square symbols represent the average intensities of the trace and retrace spectra. f Profile of the reaction induced at −0.6 and −0.4 V for comparison
Fig. 13
Fig. 13. Fiber-coupled TERS tip.
a The phase-matching zones for TM0 and HE1 modes are separated for the selective excitation of the former. b Simulation of the nanofocusing at the AgNW tip (tip angle 37°), with TM0 input from the left. The light wavelength is 532 nm for all calculations. c False-color SEM images of a fabricated AgNW-OF probe. The OF tip region (blue) is uncovered for the selective and effective excitation of the TM0 SPP on a sharp-tip silver nanowire (200 nm in diameter, ~5 nm in tip radius). Inset of c: enlarged view of the AgNW tip. d STM topographic image of SWCNTs on an Au film. Top inset: cross-sectional profile along the dashed line. Bottom inset: the possible configurations of the bundle. e Intensity of the Raman peak at 1526 cm−1 along the white dashed line in (d). A, B, C in d and e indicate the position of the Raman spectra in (f). Reprinted with permission from ref. from Springer Nature: Nature Photonics, Copyright (2019)

Similar articles

Cited by

References

    1. Sheppard, N. The historical development of experimental techniques in vibrational spectroscopy. in Handbook of Vibrational Spectroscopy (eds Chalmers, J. M. & Griffiths, P.R., 2006).
    1. Chabal YJ. Surface infrared spectroscopy. Surf. Sci. Rep. 1988;8:211–357. doi: 10.1016/0167-5729(88)90011-8. - DOI
    1. Fleischmann M, Hendra PJ, McQuillan AJ. Raman spectra of pyridine adsorbed at a silver electrode. Chem. Phys. Lett. 1974;26:163–166. doi: 10.1016/0009-2614(74)85388-1. - DOI
    1. Albrecht MG, Creighton JA. Anomalously intense Raman spectra of pyridine at a silver electrode. J. Am. Chem. Soc. 1977;99:5215–5217. doi: 10.1021/ja00457a071. - DOI
    1. Jeanmaire DL, Van Duyne RP. Surface Raman spectroelectrochemistry: part I. Heterocyclic, aromatic, and aliphatic amines adsorbed on the anodized silver electrode. J. Electroanal. Chem. Interfacial Electrochem. 1977;84:1–20. doi: 10.1016/S0022-0728(77)80224-6. - DOI