. 2021 Aug 4;11(1):15782.
doi: 10.1038/s41598-021-95245-7.

Deciphering the biology of KIR2DL3+ T lymphocytes that are associated to relapse in haploidentical HSCT

Affiliations

Deciphering the biology of KIR2DL3+ T lymphocytes that are associated to relapse in haploidentical HSCT

Gaëlle David et al. Sci Rep. .

Abstract

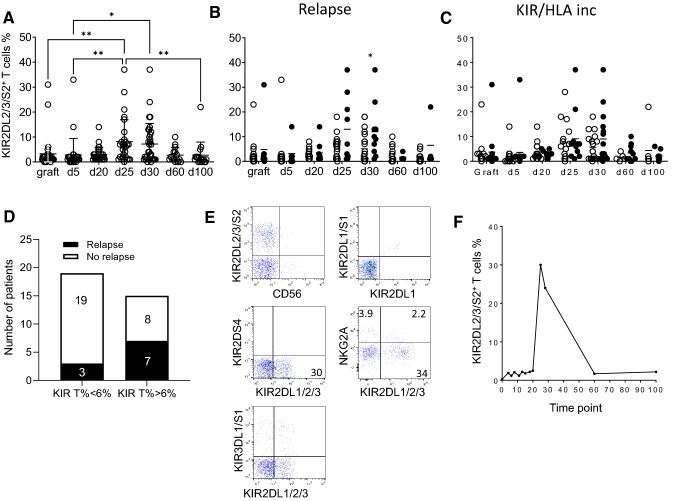
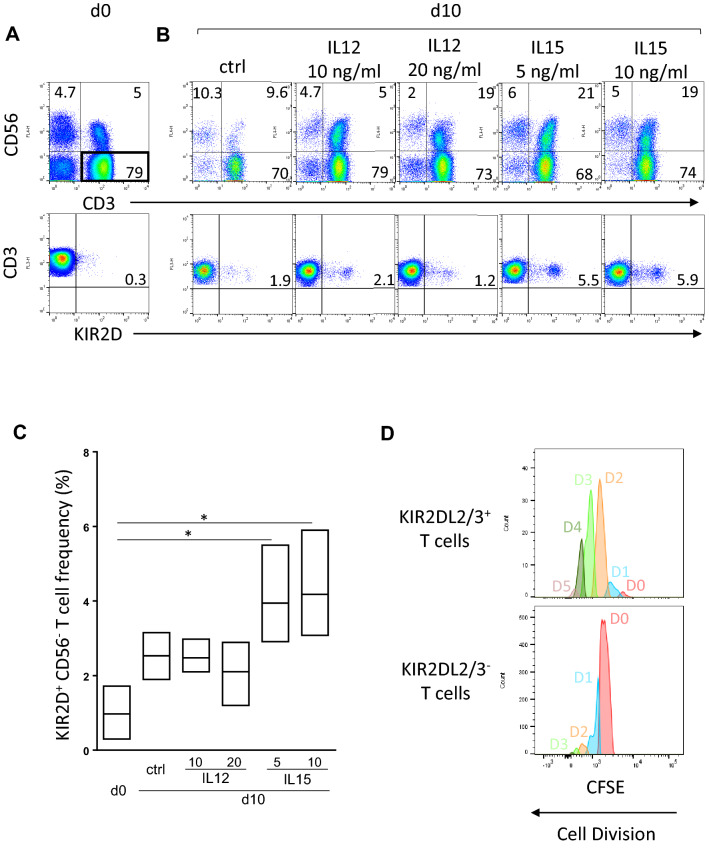
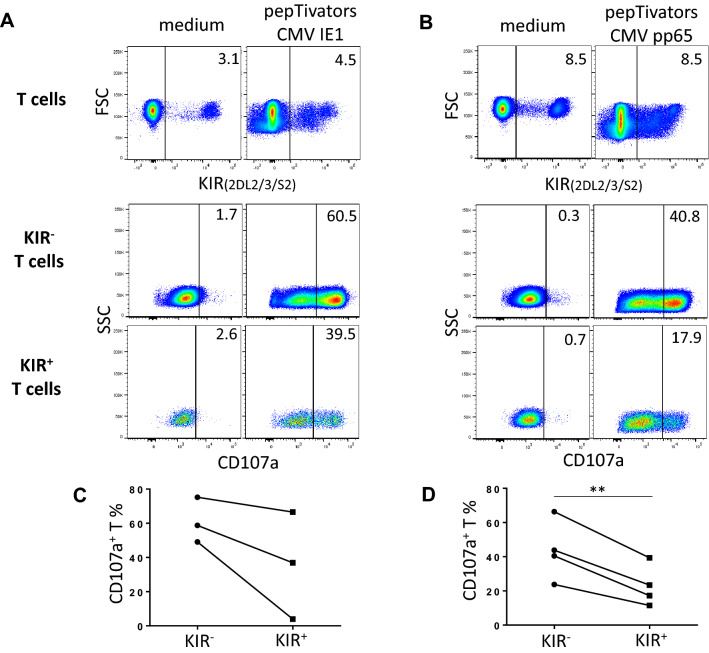
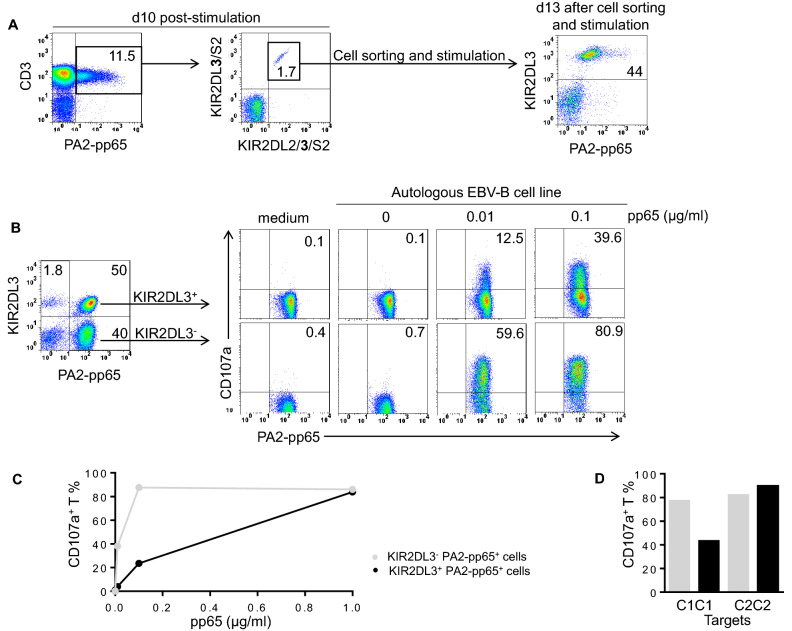
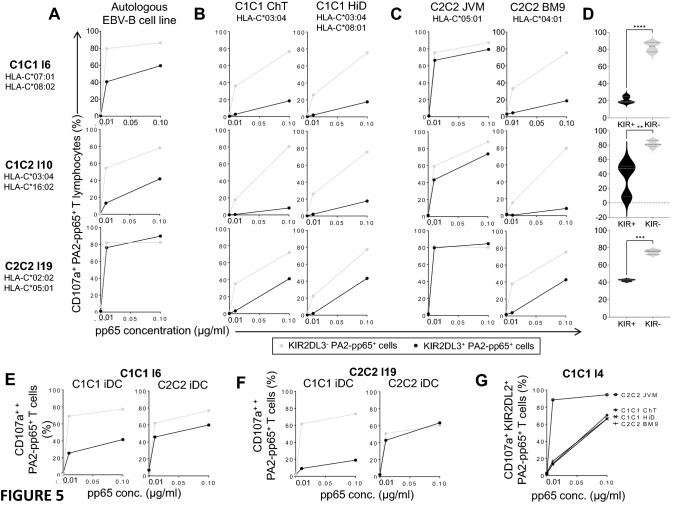
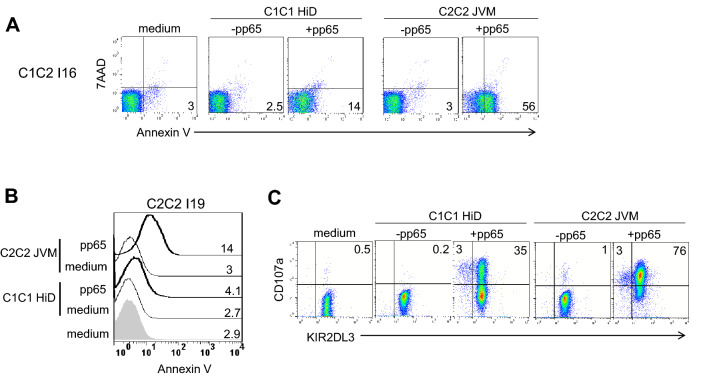
KIR are mainly expressed on NK cells and to a lesser extent on T lymphocytes. Although the KIR NK cell repertoire was well explored in haploidentical Hematopoietic Stem Cell Transplantation (HSCT), KIR T cell compartment remains to be investigated in this context. In this study, the investigation of NK receptors on T lymphocytes during immune reconstitution after T-cell-replete haploidentical HSCT with Post-Transplant Cyclophosphamide (PTCy) has shown a significant increase of KIR2DL2/3+ T cell frequency at day 25. This was especially observed at day 30 in recipients who relapsed. IL-15 but not IL-12 increased in vitro KIR+ T cell expansion suggesting that the raised IL-15 serum concentration observed after PTCy in haploidentical HSCT might increase KIR+ T cell frequency. Moreover, investigations from healthy blood donors showed a higher inhibiting effect of KIR2DL3 on CMV specific T cell response against allogeneic than autologous C1+ target cells. The association of KIR+ T cell subset with relapse may suggest that inhibitory KIR2DL2/3 limit anti-leukemic effect of specific T lymphocytes at this early step of immune reconstitution. Further phenotypic and mechanistic investigations on this cell subset from a broader cohort of HSCT recipients should clarify its potential implication in relapse occurrence. Our results demonstrate that KIR-HLA interactions known to modulate NK cell functions also modulate T cell immune responses in the context of allogeneic HSCT.


Conflict of interest statement

The authors declare no competing interests.

Figures

Figure 1
Figure 1
Increased frequency of KIR2DL2/3/2DS2+ T lymphocytes at days 25–30 associated with relapse occurrence. (A) KIR2DL2/3/2DS2+ T cell frequencies determined by flow cytometry from grafts and recipients (n = 34) after T-replete haploidentical HSCT with PTCy, following the post transplantation kinetic (days 5, 20, 25, 30, 60 and 100), (B) according to relapse occurrence (white circle for no relapse and black circle for relapse) and (C) inh. KIR/HLA inc. (white circle for no inc. and black circle for inc.). Comparisons of KIR2DL2/3+ T cell frequencies (mean rank) at different time points were performed using a nonparametric test (Kruskal–Wallis test) with no matching or pairing. Comparisons of KIR2DL2/3+ T cell frequencies between patients with relapse or not were performed by multiple Mann–Whitney tests of two-way-ANOVA using the method of two-stage step-up (Benjamini, Krieger, and Yekutieli) * and **indicate p < 0.05 and p < 0.001 respectively. (D) A contingency analysis was performed using Chi-square test to compare patients with relapse or not in groups with less and more than 6% of KIR2DL2/3+ T cells. (E) Density plots illustrating the T cell phenotype at day 25 for a representative patient. (F) Kinetic of KIR2DL2/3/2DS2+ T cell appearance determined by flow cytometry from a representative recipient following post-transplantation time points (days 0, 4, 6, 8, 11, 13, 15, 18, 20, 25, 28, 60 and 100).
Figure 2
Figure 2
IL-15 stimulates KIR+ lymphocyte expansion. (A) Representative density plots illustrating KIR2DL1/2/3/2DS1/2 expression on CD56 T cell subsets targeted using CD3 and CD56 combination at day 0 by flow cytometry (B) and day 10 after PBMC culture with IL-2 at 50 U/ml alone or in combination with IL-12 (10 and 20 ng/ml) or IL-15 (5 and 10 ng/ml). The cell frequency is indicated on all density plots. (C) Floating bars (min to max) compiling results of different experiments realized from 3 healthy blood donors. *Indicates p < 0.05, ANOVA. (D) Representative histograms of KIR and KIR+ T cell proliferation by the method of CFSE that allows the identification of dividing cells stimulated for 6 days with 10 ng/ml IL-15. Generation’s gates are indicated (DO to D5).
Figure 3
Figure 3
Lower ex vivo degranulation of CMV specific KIR+ T lymphocytes compared to KIR counterpart in HSCT recipients. Density plots illustrating the ex vivo degranulation of (A) IE1 and (B) pp65 specific KIR2DL2/3 and KIR2DL2/3+ T lymphocytes from HSCT recipients. PBMC at day 100 post-graft were incubated with IE1 or pp65 peptivators during 6 h. T cell degranulation observed in 5 recipients against CMV with 3 specific responses against IE1 (C) and 4 specific responses against pp65 (D). Student’s t test. **Indicates p < 0.01.
Figure 4
Figure 4
KIR2DL3 inhibits the degranulation of HLA-A2-pp65 specific T lymphocytes. (A) PBMC from HLA-A2+ CMV+ individuals were stimulated using pp65 loaded autologous PBMC following the ratio E: T of 1:1. After 10 days of stimulation, HLA-A2-pp65 specific T lymphocytes were targeted using specific pentamer (PA2-pp65) in combination with KIR2DL2/3/S2 specific mAb (GL183) and KIR2DS2/KIR2DL3 specific mAb (1F12). KIR2DL3+ PA2-pp65+ lymphocytes were cell sorted and in vitro amplified by stimulation as illustrating for one representative individual (I10) of 3. (B) After day 15, the frequency of PA2-pp65 increased and simultaneously, KIR2DL3+ HLA-A2-pp65 specific lymphocytes frequency decreased leading to investigate in parallel the function of KIR2DL3 and KIR2DL3+ HLA-A2-pp65 specific lymphocytes. Density plots of KIR2DL3+ and KIR2DL3 HLA-A2-pp65 specific T cell degranulation observed after 5 h incubation alone (medium) or in the presence of pp65 (0, 0.01 and 0.1 µg/ml) loaded autologous EBV-B cell line, at an effector: target ratio of 10:1 for one representative individual (I10) of 3. (C) KIR2DL3+ and KIR2DL3 HLA-A2-pp65 specific T cell degranulation observed after 5 h incubation alone (medium) or in the presence of pp65 (0, 0.01, 0.1 and 1 µg/ml) loaded autologous EBV-B cell line, at an effector: target ratio of 10:1 for one representative individual (I1) of 5. (D) KIR2DL3+ and KIR2DL3 HLA-A2-pp65 specific T cell degranulation observed after 5 h incubation in the presence of pp65 (0.01 µg/ml) loaded C1C1 EBV-B cell line (HiD) or C2C2 autologous EBV-B cell lines, at an effector: target ratio of 10:1 for one representative individual (I19) of 5.
Figure 5
Figure 5
KIR2DL3 inhibits conventional T lymphocyte response against target cells expressing C1 ligands and HLA-C*04 C2 ligand with higher effect on allogeneic than autologous ligands. (A) KIR2DL3+ and KIR2DL3 HLA-A2-pp65 specific T cell degranulation observed after 5 h incubation in the presence of pp65 (0, 0.01, and 0.1 µg/ml) loaded autologous EBV-B cell line, (B) allogeneic C1C1 ChT (HLA-C*03:04) and HiD (HLA-C*03:04; C*08:01) EBV-B cell lines, (C) C2C2 JVM (HLA-C*05:01) and BM9 (HLA-C*04:01) EBV-B cell lines at an effector: target ratio of 10:1 for three representative individuals (C1C1 I6, C1C2 I10 and C2C2 I19). Experiments were performed from 5 C1C1, 3 C1C2 and 2 C2C2 blood donors. (D) Violin plots of KIR2DL3+ and KIR2DL3 HLA-A2-pp65 specific T cell degranulation observed after 5 h incubation in the presence of pp65 (0.1 µg/ml) loaded C1C1 EBV-B cell lines for 5 C1C1, 3 C1C2 and 2 C2C2 blood donors. Paired t test was used to evaluate whether values between KIR2DL3+ and KIR2DL3 T cell degranulation were significantly different. **, *** and ****indicate p < 0.01, p < 0.001 and p < 0.0001 respectively. (E) KIR2DL3+ and KIR2DL3 HLA-A2-pp65 specific T cell degranulation observed after 5 h incubation in the presence of pp65 (0, 0.01, and 0.1 µg/ml) loaded allogeneic C1C1 and C2C2 immature dendritic cells at an effector: target ratio of 10:1 for one representative C1C1 (I6) and (F) C2C2 individuals (I19). (G) KIR2DL2+ HLA-A2-pp65 specific T cell degranulation observed after 5 h incubation in the presence of pp65 (0, 0.01, and 0.1 µg/ml) loaded allogeneic C1C1 (ChT, HiD) and C2C2 (JVM, BM9) EBV-B cell lines for one representative C1C1 individual (I4).
Figure 6
Figure 6
KIR2DL3 inhibits T lymphocyte apoptosis. (A) Density plots illustrating apoptotic HLA-A2-pp65 specific KIR2DL2/3+ T lymphocytes as annexin V+ 7AAD after 3 h incubation alone or in presence of pp65 (0.1 µg/ml) loaded allogeneic C1C1 (ChT, HiD) and C2C2 (JVM, BM9) EBV-B cell lines for one representative C1C2 individual (I16) performed twice and for 2 C1C2 individuals. Mean Fluorescent Intensity (MFI) of Annexin V+ cells is indicated on all density plots. (B) Histograms representing annexin V expression by HLA-A2-pp65 specific KIR2DL3+ T lymphocytes after 3 h incubation alone or in presence of pp65 (0 and 0.1 µg/ml) loaded allogeneic C1C1 (ChT, HiD) and C2C2 (JVM, BM9) EBV-B cell lines for one C2C2 individual (I19). Mean Fluorescent Intensity (MFI) of Annexin V+ cells is indicated for all conditions. (C) Density plots illustrating HLA-A2-pp65 specific KIR2DL3+ T cell degranulation in the presence of pp65 (0 and 0.1 µg/ml) loaded allogeneic C1C1 (ChT, HiD) and C2C2 (JVM, BM9) EBV-B cell lines for one C2C2 individual (I19).

References

    1. Mandelboim O, et al. Protection from lysis by natural killer cells of group 1 and 2 specificity is mediated by residue 80 in human histocompatibility leukocyte antigen C alleles and also occurs with empty major histocompatibility complex molecules. J. Exp. Med. 1996;184:913–922. doi: 10.1084/jem.184.3.913. - DOI - PMC - PubMed
    1. Moesta AK, et al. Synergistic polymorphism at two positions distal to the ligand-binding site makes KIR2DL2 a stronger receptor for HLA-C than KIR2DL3. J. Immunol. Baltim. 2008;180:3969–3979. doi: 10.4049/jimmunol.180.6.3969. - DOI - PubMed
    1. Pende D, et al. Anti-leukemia activity of alloreactive NK cells in KIR ligand-mismatched haploidentical HSCT for pediatric patients: Evaluation of the functional role of activating KIR and redefinition of inhibitory KIR specificity. Blood. 2009;113:3119–3129. doi: 10.1182/blood-2008-06-164103. - DOI - PubMed
    1. Schönberg K, Sribar M, Enczmann J, Fischer JC, Uhrberg M. Analyses of HLA-C-specific KIR repertoires in donors with group A and B haplotypes suggest a ligand-instructed model of NK cell receptor acquisition. Blood. 2011;117:98–107. doi: 10.1182/blood-2010-03-273656. - DOI - PubMed
    1. David G, et al. Large spectrum of HLA-C recognition by killer Ig-like receptor (KIR)2DL2 and KIR2DL3 and restricted C1 SPECIFICITY of KIR2DS2: Dominant impact of KIR2DL2/KIR2DS2 on KIR2D NK cell repertoire formation. J. Immunol. Baltim. 2013;191:4778–4788. doi: 10.4049/jimmunol.1301580. - DOI - PubMed

Publication types