. 2021 Aug 4;11(1):15833.
doi: 10.1038/s41598-021-95190-5.

Manganese systemic distribution is modulated in vivo during tumor progression and affects tumor cell migration and invasion in vitro

Affiliations

Manganese systemic distribution is modulated in vivo during tumor progression and affects tumor cell migration and invasion in vitro

Mariana Paranhos Stelling et al. Sci Rep. .

Abstract

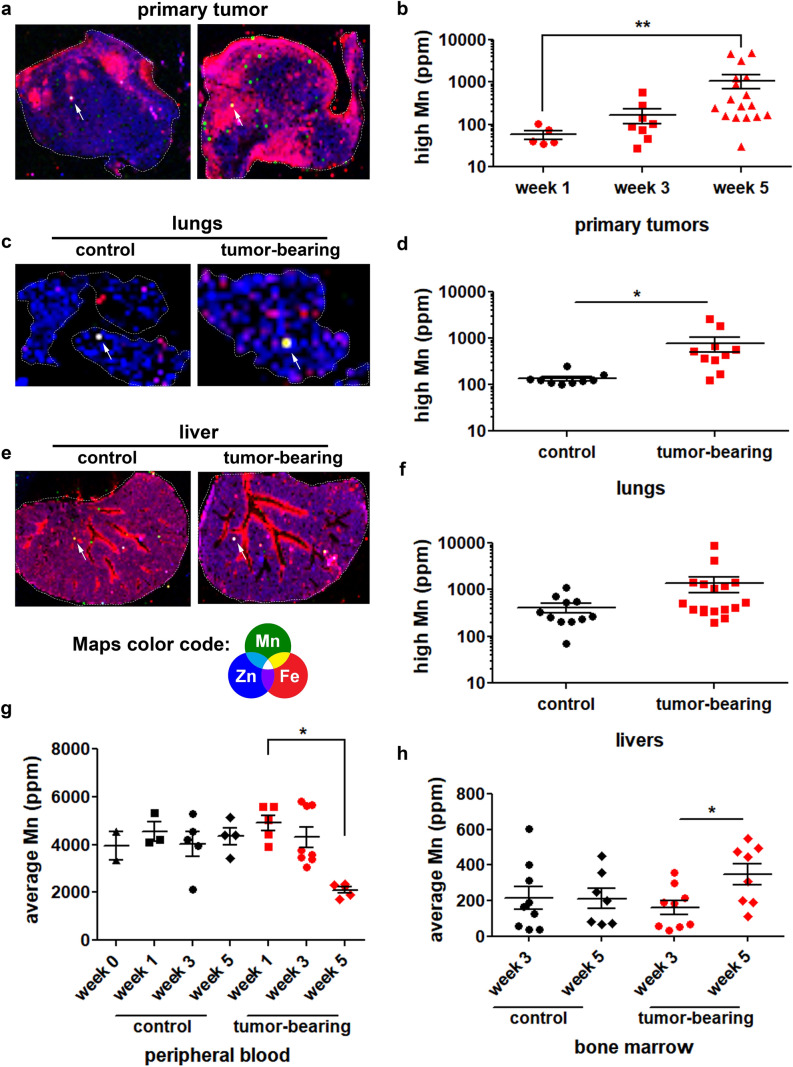
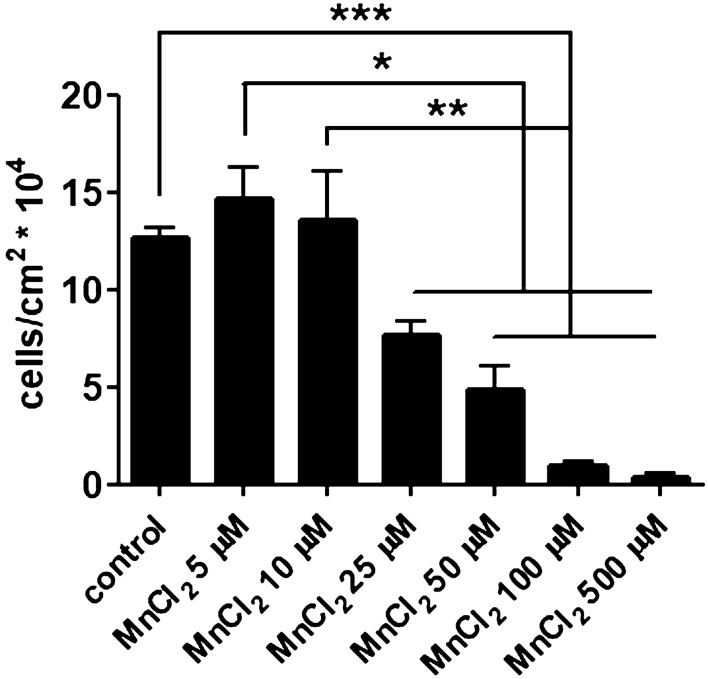
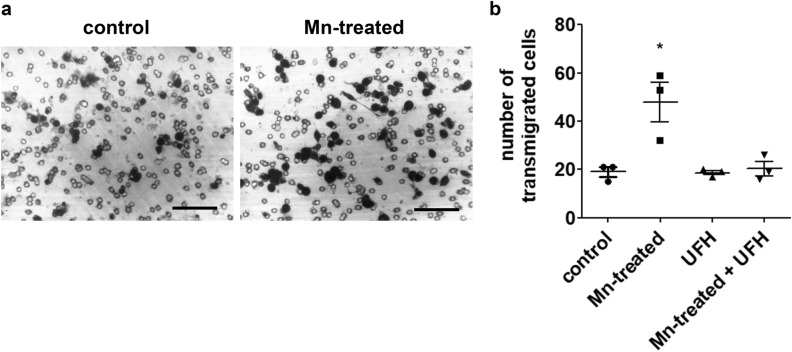
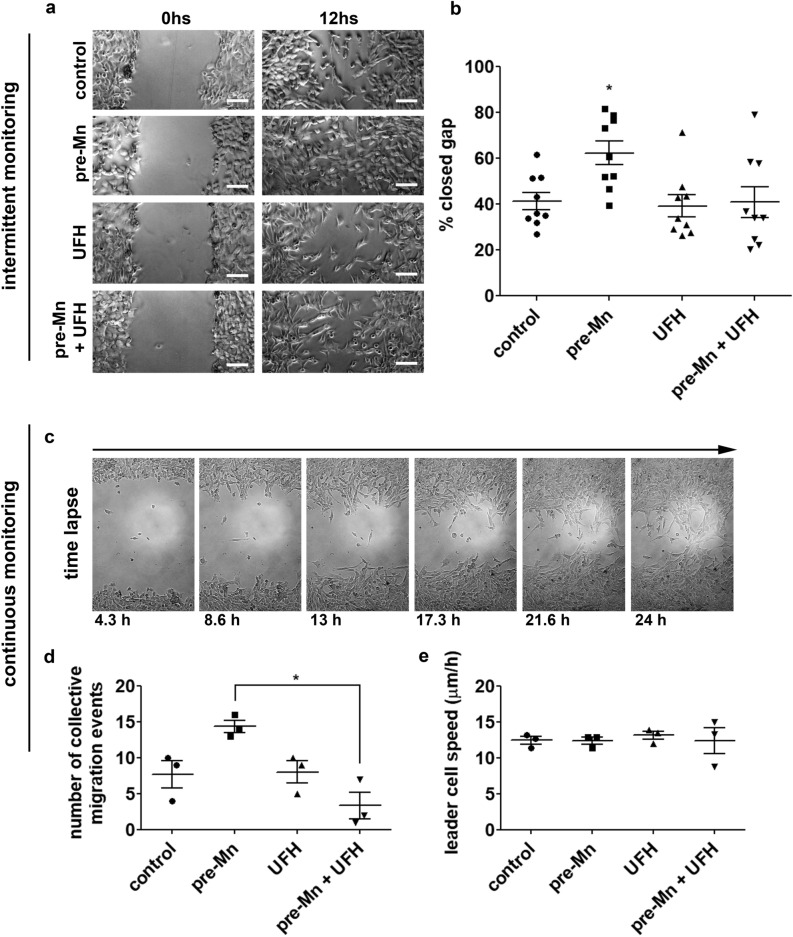
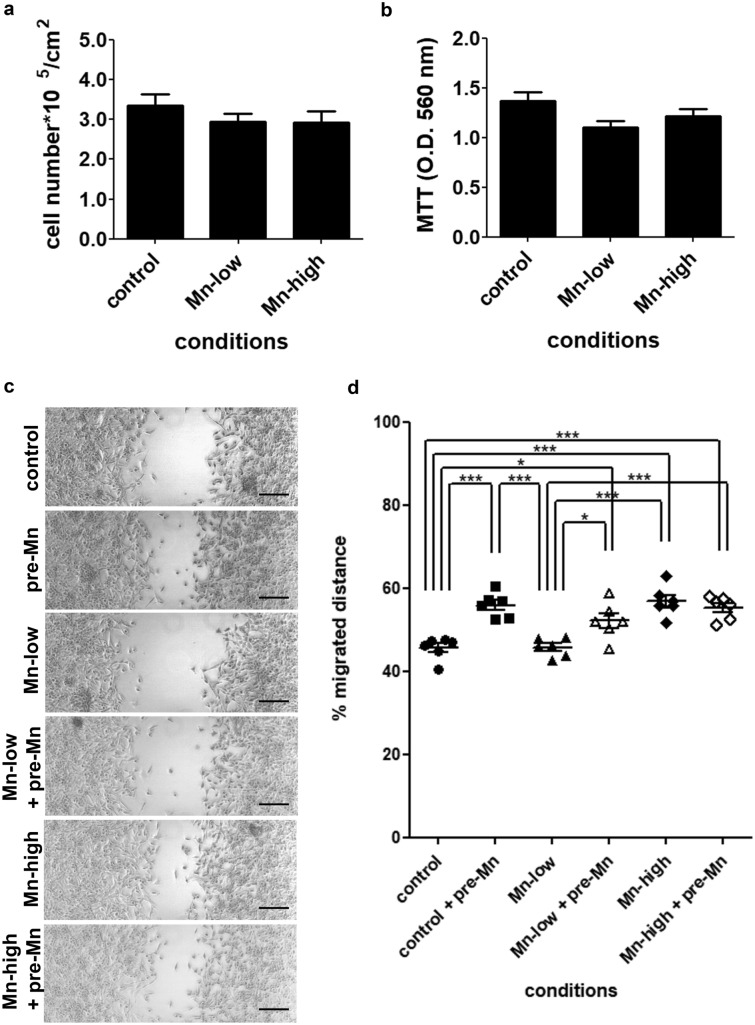
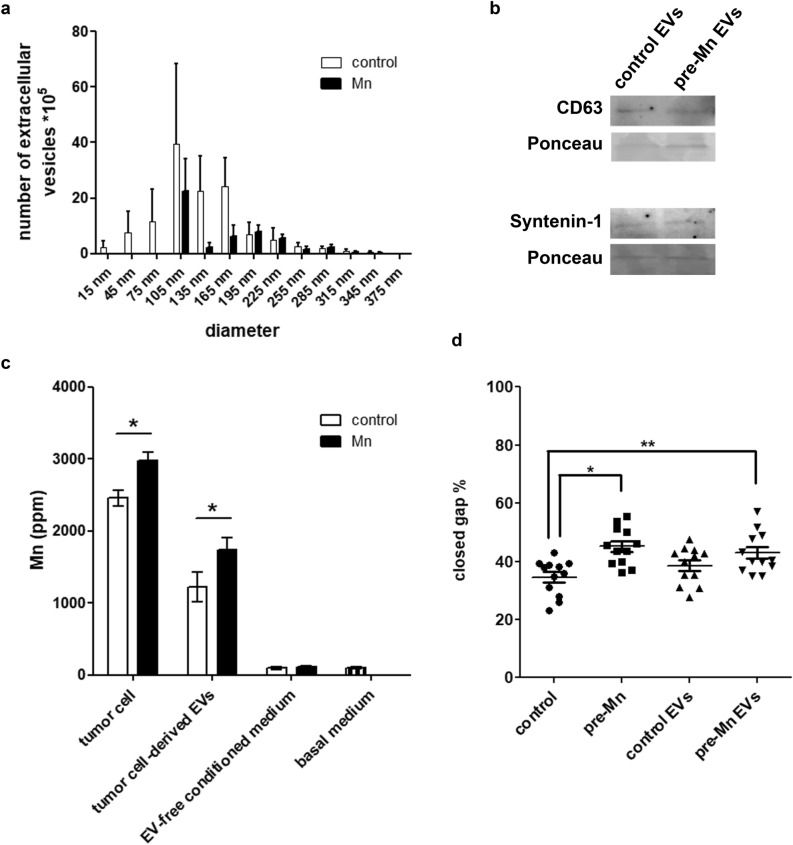
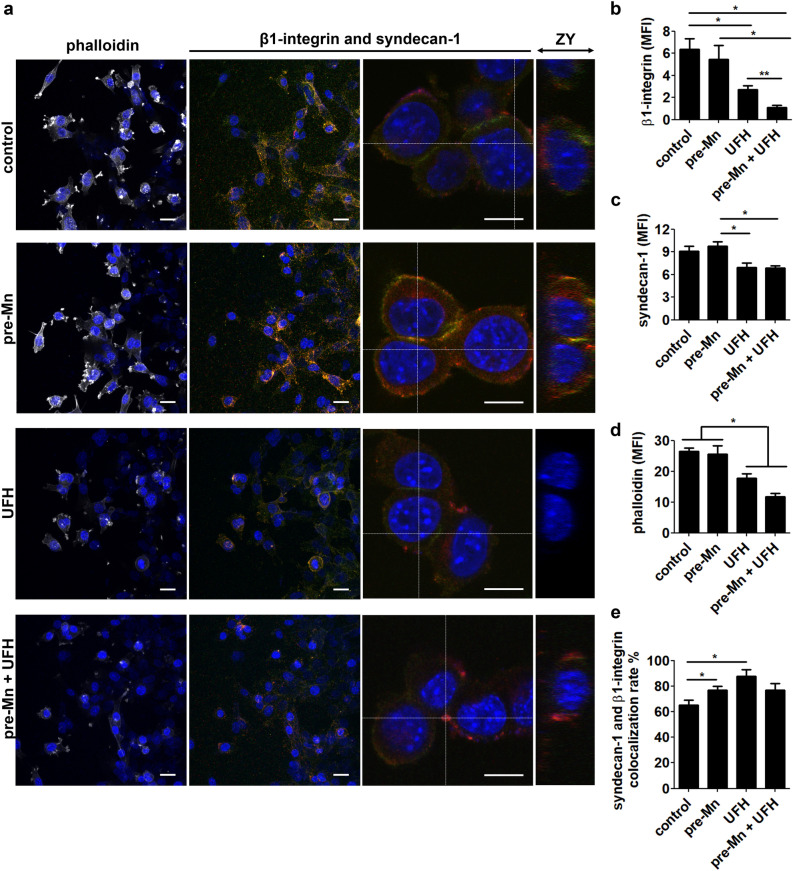
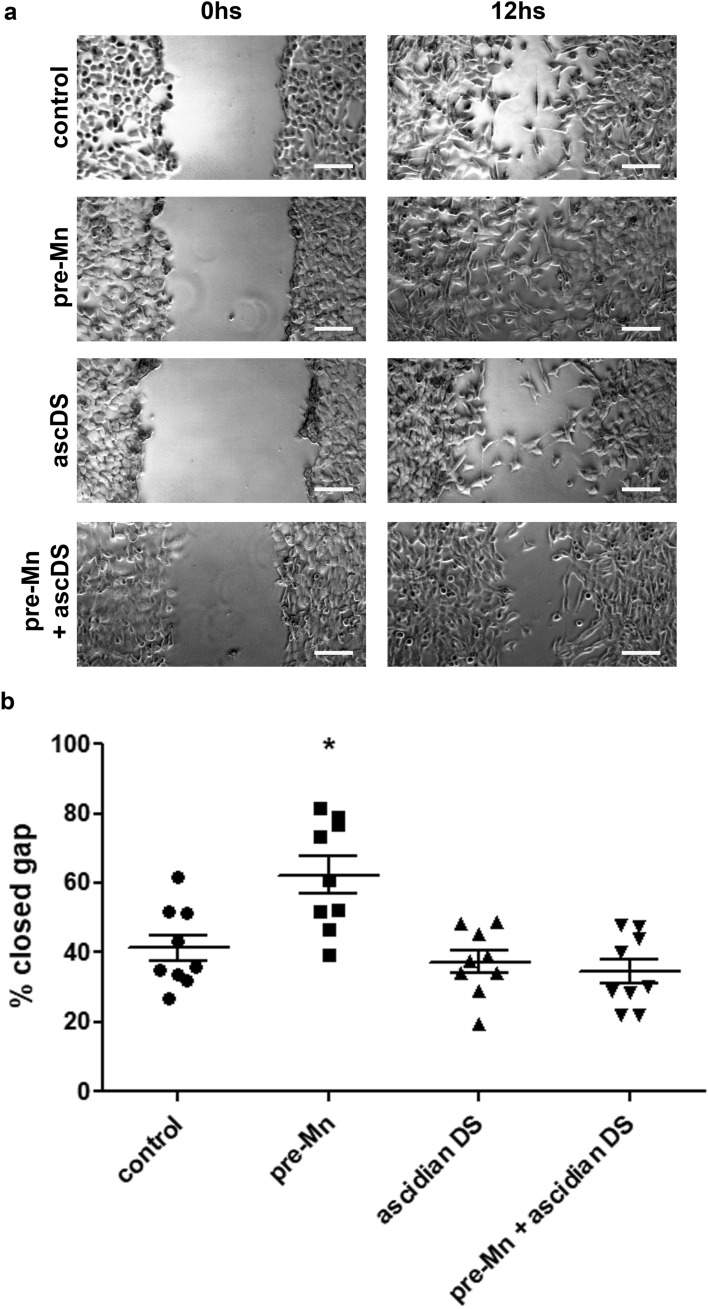
Metastatic disease remains the leading cause of death in cancer and understanding the mechanisms involved in tumor progression continues to be challenging. This work investigates the role of manganese in tumor progression in an in vivo model of tumor growth. Our data revealed that manganese accumulates within primary tumors and secondary organs as manganese-rich niches. Consequences of such phenomenon were investigated, and we verified that short-term changes in manganese alter cell surface molecules syndecan-1 and β1-integrin, enhance collective cell migration and invasive behavior. Long-term increased levels of manganese do not affect cell growth and viability but enhance cell migration. We also observed that manganese is secreted from tumor cells in extracellular vesicles, rather than in soluble form. Finally, we describe exogenous glycosaminoglycans that counteract manganese effects on tumor cell behavior. In conclusion, our analyses describe manganese as a central element in tumor progression by accumulating in Mn-rich niches in vivo, as well as in vitro, affecting migration and extracellular vesicle secretion in vitro. Manganese accumulation in specific regions of the organism may not be a common ground for all cancers, nevertheless, it represents a new aspect of tumor progression that deserves special attention.


Conflict of interest statement

The authors declare no competing interests.

Figures

Figure 1
Figure 1
Manganese distribution is affected during tumor progression. Control and tumor-bearing mice were analyzed regarding elemental tissue content and distribution by X-ray fluorescence. Elemental distribution maps from (a) primary tumors—examples from two tumor-bearing mice; (c) lungs—from one control and one tumor-bearing mice; and (e) livers—from one control and one tumor-bearing mice were built from the acquired spectra; map color code: green (Mn—manganese), red (Fe—iron) and blue (Zn—zinc). Maps’ dimensions for primary tumor: 7.6 mm × 6.0 mm (left panel) and 6.9 mm × 7.7 mm (right panel); lungs: 8.6 mm × 6.2 mm (control) and 3.2 mm × 4.5 mm (tumor-bearing); livers: 11.0 mm × 14.0 mm (control) and 9.3 mm × 13.7 mm (tumor-bearing). White arrows indicate regions where manganese was found to be in highest concentration (high-Mn niches). Elemental concentration of manganese from these regions were plotted for all (b) primary tumors, (d) lungs, (f) livers, (g) peripheral blood and (h) bone marrow. Primary tumors were analyzed from week 1 to week 5, lungs and livers were analyzed at week 5 of tumor progression; peripheral blood was analyzed from week 0 to week 5 of tumor progression and bone marrows were analyzed at weeks 3 and 5 of tumor progression. Control mice samples are represented in black symbols, tumor-bearing mice samples are represented in red symbols. Units are expressed in concentration as ppm (parts per million). *p < 0.05; **p < 0.01, Kruskal–Wallis test and Dunn’s multiple comparison post-test. Primary tumors (week 1) N = 5, (week 3) N = 9, (week 5) N = 17; Lungs (control) N = 9, (tumor-bearing) N = 10; Livers (control) N = 11, (tumor-bearing) N = 17; Peripheral blood (week 0) N = 3, (week 1/control) N = 3, (week 1/tumor-bearing) N = 5, (week 3/control) N = 5, (week 3/tumor-bearing) N = 8, (week 5/control) N = 4, (week 5/tumor-bearing) N = 5; Bone marrow (week 3/control) N = 9, (week 3/tumor-bearing) N = 9, (week 5/control) N = 7, (week 5/tumor-bearing) N = 8.
Figure 2
Figure 2
Manganese affects tumor cell survival. LLC cell survival was evaluated after 24 h of incubation with different MnCl2 concentrations. Cell number represents adhered live cells only. *p < 0.05; **p < 0.01; ***p<0.001, two-way ANOVA and Bonferroni’s multiple comparison post-test. N = 3.
Figure 3
Figure 3
Manganese promotes tumor cell migration in vitro and heparin counteracts its effects at a non-anticoagulant concentration. LLC cells migration was evaluated in matrigel-covered transwell chambers. Transmigration was analyzed after 3 h of incubation in control and Mn-treated (MnCl2 5 µM) conditions. Transwell inserts were (a) stained and imaged for (b) cell quantification. N = 3. UFH (bovine unfractionated heparin—0.1 ng/mL). Scale bars 50 µm. *p < 0.05, one-way ANOVA and Bonferroni’s multiple comparison post-test.
Figure 4
Figure 4
Manganese modulates tumor cell migration pattern. LLC cells migration pattern was evaluated in wound healing assays by intermittent (a, b) and continuous (ce) monitoring. Cells were (a) imaged and (b) total migrated distance was quantified. N = 9. (c) Time lapse images—example from a Mn-pretreated cells migration video—were also acquired and compilated into videos for (d) collective migration quantification. (e) Single-cell speed was calculated from videos. N = 3. UFH (bovine unfractionated heparin—0.1 ng/mL); pre-Mn (MnCl2 5 µM 1 h pretreatment prior to migration). Scale bars 50 µm. *p < 0.05, one-way ANOVA test and Bonferroni’s multiple comparison post-test.
Figure 5
Figure 5
Tumor cells cultured in manganese-low and manganese-high conditions present different migration patterns. LLC cells were cultured in Mn-low and Mn-high conditions for 48 h and (a) cell growth was evaluated by counting live, adhered cells using trypan blue. (b) Cell viability was evaluated by the MTT assay. LLC cell migration pattern was evaluated in wound healing assays by intermittent monitoring at 0 h and 12 h. Cells were (c) imaged and migrated distance was (d) quantified. Mn-low (standard high glucose DMEM + Mn-low FBS); Mn-high (standard high glucose DMEM + Mn-high FBS). Scale bars 200 µm. Cell growth assay N = 4; MTT assay N = 6; wound healing assay N = 6. *p<0.05; ***p<0.0001, one-way ANOVA test and Bonferroni’s multiple comparison post-test.
Figure 6
Figure 6
Tumor cell-derived extracellular vesicles are enriched in manganese and affect tumor cell migration. LLC cells-derived extracellular vesicles were concentrated by ultracentrifugation. (a) EVs quantification and size determination. N = 6. (b) CD63 and syntenin-1 detection by Western blotting. Ponceau was used as total protein control. (c) Tumor cells, EV-enriched fraction, EV-free conditioned medium and basal medium were analyzed by X-Ray Fluorescence. N = 6. Units are expressed in concentration as ppm (parts per million). Control cells—white bars; Mn-pretreated cells (Mn) – black bars. *p < 0.05, Student’s T test. (d) Wound healing assays of LLC cells incubated with extracellular vesicle-enriched medium from control and Mn-pretreated LLC cells. N = 12. *p < 0.05; **p < 0.01, one-way ANOVA and Bonferroni's Multiple Comparison Test.
Figure 7
Figure 7
Manganese affects β1-integrin and syndecan-1 expression in tumor cells. Confocal microscopy images of (a) immunostainings for β1-integrin, syndecan-1 and F-actin (phalloidin). DAPI (blue), β1-integrin (red), syndecan-1 (green) and phalloidin (white). ZY axis projections were generated from higher magnification images of β1-integrin and syndecan-1 merged stainings. Scale bars are 25 µm (lower magnification) and 10 µm (higher magnification). N = 6. Images were quantified regarding fluorescence intensity for (b) β1-integrin, (c) syndecan-1 and (d) phalloidin-Alexa 488. (e) β1-integrin and syndecan-1 colocalization rates. MFI, mean fluorescence intensity. One-way ANOVA with Bonferroni’s post test. *p < 0.05; **p < 0.01.
Figure 8
Figure 8
Ascidian dermatan sulfate counteracts migration-promoting effects of manganese on tumor cells. LLC cell migration was evaluated by wound healing assays after brief exposure to manganese followed by treatment with an ascidian dermatan sulfate (DS). Cells were (a) imaged at 0 h and 12 h and migrated distance was (b) quantified. N = 9. Scale bars 50 µm. *p < 0.05, one-way ANOVA test and Bonferroni’s multiple comparison post-test.

References

    1. Friedl P, Wolf K. Tumour-cell invasion and migration: Diversity and escape mechanisms. Nat. Rev. Cancer. 2003;3:362–374. doi: 10.1038/nrc1075. - DOI - PubMed
    1. Salvatore V, et al. The tumor microenvironment promotes cancer progression and cell migration. Oncotarget. 2017;8:9608–9616. doi: 10.18632/oncotarget.14155. - DOI - PMC - PubMed
    1. Maziveyi M, Alahari SK. Cell matrix adhesions in cancer: The proteins that form the glue. Oncotarget. 2017;8:48471–48487. doi: 10.18632/oncotarget.17265. - DOI - PMC - PubMed
    1. Xiong J-P, et al. Crystal structure of the extracellular segment of integrin alpha Vbeta3 in complex with an Arg-Gly-Asp ligand. Science. 2002;296:151–155. doi: 10.1126/science.1069040. - DOI - PubMed
    1. Zhang K, Chen J. The regulation of integrin function by divalent cations. Cell Adhes. Migr. 2012;6:20–29. doi: 10.4161/cam.18702. - DOI - PMC - PubMed

Publication types