. 2021 Aug;596(7872):393-397.
doi: 10.1038/s41586-021-03779-7. Epub 2021 Aug 4.

Genetic insights into biological mechanisms governing human ovarian ageing

Katherine S Ruth #  1 Felix R Day #  2 Jazib Hussain #  3 Ana Martínez-Marchal #  4   5 Catherine E Aiken  6   7 Ajuna Azad  3 Deborah J Thompson  8 Lucie Knoblochova  9   10 Hironori Abe  11 Jane L Tarry-Adkins  6   7 Javier Martin Gonzalez  12 Pierre Fontanillas  13 Annique Claringbould  14 Olivier B Bakker  15 Patrick Sulem  16 Robin G Walters  17   18 Chikashi Terao  19   20   21 Sandra Turon  22 Momoko Horikoshi  23 Kuang Lin  17 N Charlotte Onland-Moret  24 Aditya Sankar  3 Emil Peter Thrane Hertz  3   25 Pascal N Timshel  26 Vallari Shukla  3 Rehannah Borup  3 Kristina W Olsen  3   27 Paula Aguilera  3   28 Mònica Ferrer-Roda  4   5 Yan Huang  4   5 Stasa Stankovic  2 Paul R H J Timmers  29   30 Thomas U Ahearn  31 Behrooz Z Alizadeh  32 Elnaz Naderi  32 Irene L Andrulis  33   34 Alice M Arnold  35 Kristan J Aronson  36   37 Annelie Augustinsson  38 Stefania Bandinelli  39 Caterina M Barbieri  40 Robin N Beaumont  1 Heiko Becher  41 Matthias W Beckmann  42 Stefania Benonisdottir  16 Sven Bergmann  43   44 Murielle Bochud  45 Eric Boerwinkle  46 Stig E Bojesen  47   48   49 Manjeet K Bolla  8 Dorret I Boomsma  50   51   52 Nicholas Bowker  2 Jennifer A Brody  53 Linda Broer  54 Julie E Buring  55   56 Archie Campbell  57 Harry Campbell  29 Jose E Castelao  58 Eulalia Catamo  59 Stephen J Chanock  31 Georgia Chenevix-Trench  60 Marina Ciullo  61   62 Tanguy Corre  43   44   45 Fergus J Couch  63 Angela Cox  64 Laura Crisponi  65 Simon S Cross  66 Francesco Cucca  65   67 Kamila Czene  68 George Davey Smith  69   70 Eco J C N de Geus  50   51   52 Renée de Mutsert  71 Immaculata De Vivo  72   73 Ellen W Demerath  74 Joe Dennis  8 Alison M Dunning  75 Miriam Dwek  76 Mikael Eriksson  77 Tõnu Esko  78   79 Peter A Fasching  42   80 Jessica D Faul  81 Luigi Ferrucci  82 Nora Franceschini  83 Timothy M Frayling  1 Manuela Gago-Dominguez  84   85 Massimo Mezzavilla  86 Montserrat García-Closas  31 Christian Gieger  87   88   89 Graham G Giles  90   91   92 Harald Grallert  87   88   89 Daniel F Gudbjartsson  16 Vilmundur Gudnason  93   94 Pascal Guénel  95 Christopher A Haiman  96 Niclas Håkansson  97 Per Hall  68 Caroline Hayward  30 Chunyan He  98   99 Wei He  77 Gerardo Heiss  83 Miya K Høffding  3 John L Hopper  91 Jouke J Hottenga  50   51   52 Frank Hu  72   73   100 David Hunter  17   73   100   72   101 Mohammad A Ikram  102 Rebecca D Jackson  103 Micaella D R Joaquim  1 Esther M John  104   105 Peter K Joshi  29 David Karasik  56   106 Sharon L R Kardia  107 Christiana Kartsonaki  17   18 Robert Karlsson  77 Cari M Kitahara  108 Ivana Kolcic  109 Charles Kooperberg  110 Peter Kraft  72   111 Allison W Kurian  104   105 Zoltan Kutalik  44   45 Martina La Bianca  59 Genevieve LaChance  112 Claudia Langenberg  2 Lenore J Launer  113 Joop S E Laven  114 Deborah A Lawlor  69   70 Loic Le Marchand  115 Jingmei Li  68 Annika Lindblom  116   117 Sara Lindstrom  118 Tricia Lindstrom  119 Martha Linet  108 YongMei Liu  120 Simin Liu  121   122 Jian'an Luan  2 Reedik Mägi  79 Patrik K E Magnusson  77 Massimo Mangino  112   123 Arto Mannermaa  124   125   126 Brumat Marco  86 Jonathan Marten  30 Nicholas G Martin  127 Hamdi Mbarek  50   51   52 Barbara McKnight  35 Sarah E Medland  127 Christa Meisinger  88   128 Thomas Meitinger  129 Cristina Menni  112 Andres Metspalu  79 Lili Milani  79 Roger L Milne  90   91   92 Grant W Montgomery  130 Dennis O Mook-Kanamori  71   131 Antonella Mulas  65 Anna M Mulligan  132   133 Alison Murray  134 Mike A Nalls  135 Anne Newman  136   137 Raymond Noordam  138 Teresa Nutile  61 Dale R Nyholt  139 Andrew F Olshan  140 Håkan Olsson  38 Jodie N Painter  127 Alpa V Patel  141 Nancy L Pedersen  77 Natalia Perjakova  79 Annette Peters  88   89 Ulrike Peters  110 Paul D P Pharoah  8   75 Ozren Polasek  109   142 Eleonora Porcu  65 Bruce M Psaty  53 Iffat Rahman  143 Gad Rennert  144 Hedy S Rennert  144 Paul M Ridker  55   56 Susan M Ring  69   70 Antonietta Robino  59 Lynda M Rose  55 Frits R Rosendaal  71 Jacques Rossouw  145 Igor Rudan  29 Rico Rueedi  43   44 Daniela Ruggiero  61   62 Cinzia F Sala  40 Emmanouil Saloustros  146 Dale P Sandler  147 Serena Sanna  65 Elinor J Sawyer  148 Chloé Sarnowski  149 David Schlessinger  150 Marjanka K Schmidt  151   152 Minouk J Schoemaker  153 Katharina E Schraut  29   154 Christopher Scott  119 Saleh Shekari  1 Amruta Shrikhande  3 Albert V Smith  93   94 Blair H Smith  155 Jennifer A Smith  107 Rossella Sorice  61 Melissa C Southey  90   92   156 Tim D Spector  112 John J Spinelli  157   158 Meir Stampfer  72   73   100 Doris Stöckl  88   159 Joyce B J van Meurs  54 Konstantin Strauch  160   161   162 Unnur Styrkarsdottir  16 Anthony J Swerdlow  153   163 Toshiko Tanaka  82 Lauren R Teras  141 Alexander Teumer  164 Unnur Þorsteinsdottir  16   165 Nicholas J Timpson  69   70 Daniela Toniolo  40 Michela Traglia  40 Melissa A Troester  140 Thérèse Truong  95 Jessica Tyrrell  1 André G Uitterlinden  54   102 Sheila Ulivi  59 Celine M Vachon  166 Veronique Vitart  30 Uwe Völker  167 Peter Vollenweider  168 Henry Völzke  164 Qin Wang  8 Nicholas J Wareham  2 Clarice R Weinberg  169 David R Weir  81 Amber N Wilcox  31 Ko Willems van Dijk  170   171   172 Gonneke Willemsen  50   51   52 James F Wilson  29   30 Bruce H R Wolffenbuttel  173 Alicja Wolk  97   174 Andrew R Wood  1 Wei Zhao  107 Marek Zygmunt  175 Biobank-based Integrative Omics Study (BIOS) ConsortiumeQTLGen ConsortiumBiobank Japan ProjectChina Kadoorie Biobank Collaborative GroupkConFab InvestigatorsLifeLines Cohort StudyInterAct consortium23andMe Research TeamZhengming Chen  17   18 Liming Li  176   177 Lude Franke  15   178 Stephen Burgess  179   180 Patrick Deelen  15   181 Tune H Pers  26 Marie Louise Grøndahl  27 Claus Yding Andersen  182 Anna Pujol  22 Andres J Lopez-Contreras  3   28 Jeremy A Daniel  25 Kari Stefansson  16   165 Jenny Chang-Claude  183   184 Yvonne T van der Schouw  24 Kathryn L Lunetta  149   185 Daniel I Chasman  55   56 Douglas F Easton  8   75 Jenny A Visser  54 Susan E Ozanne  6 Satoshi H Namekawa  11 Petr Solc  9 Joanne M Murabito  185   186 Ken K Ong  2   187 Eva R Hoffmann  188 Anna Murray  189 Ignasi Roig  190   191 John R B Perry  192   193
Affiliations

Genetic insights into biological mechanisms governing human ovarian ageing

Katherine S Ruth et al. Nature. 2021 Aug.

Abstract

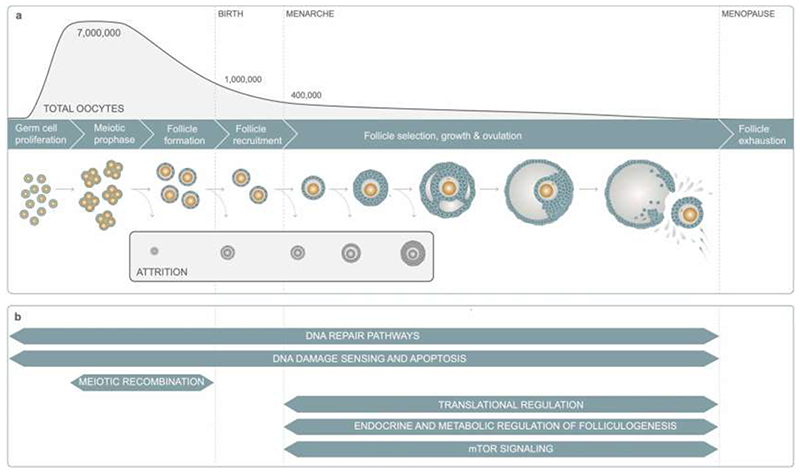
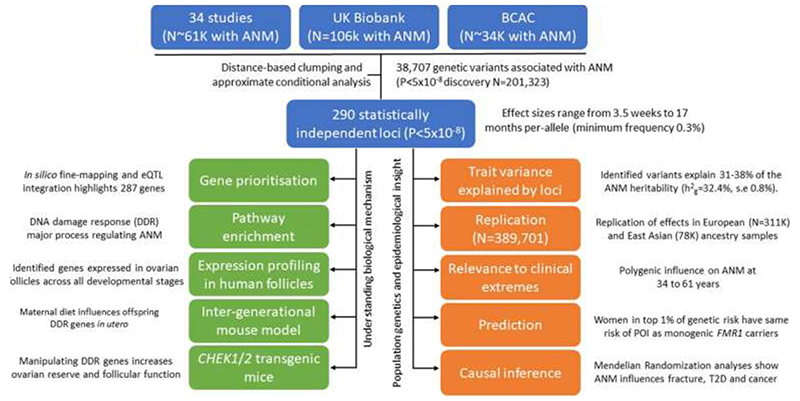
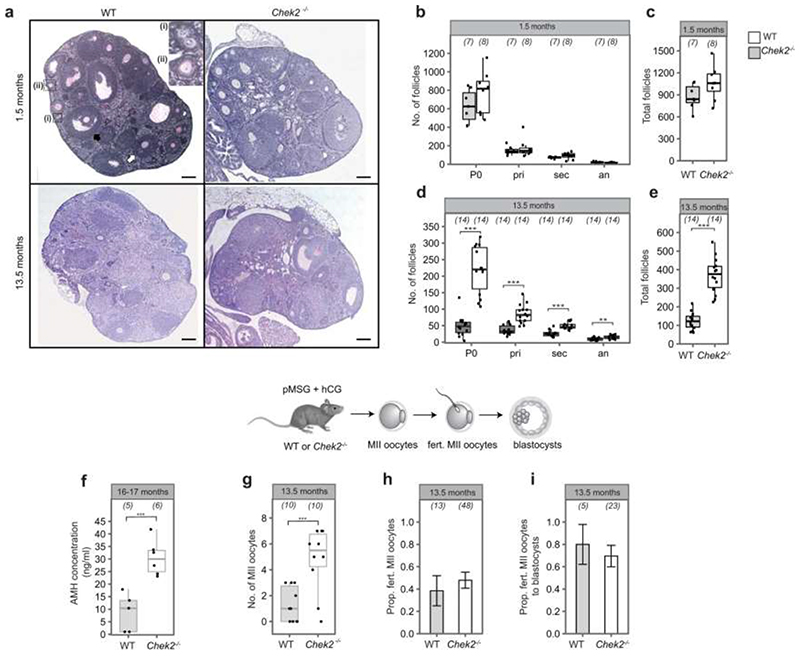
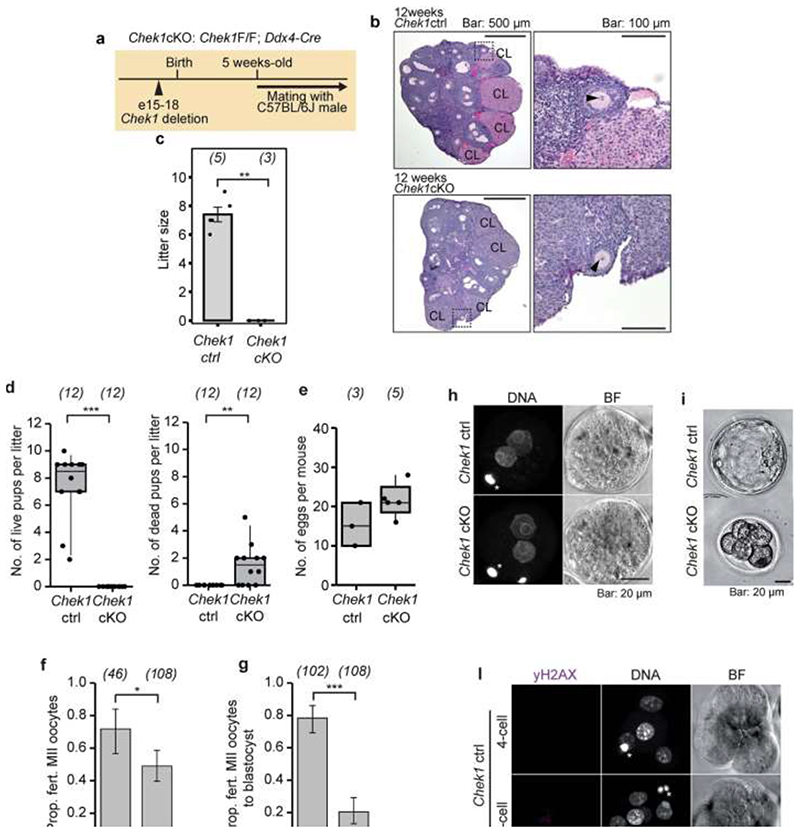
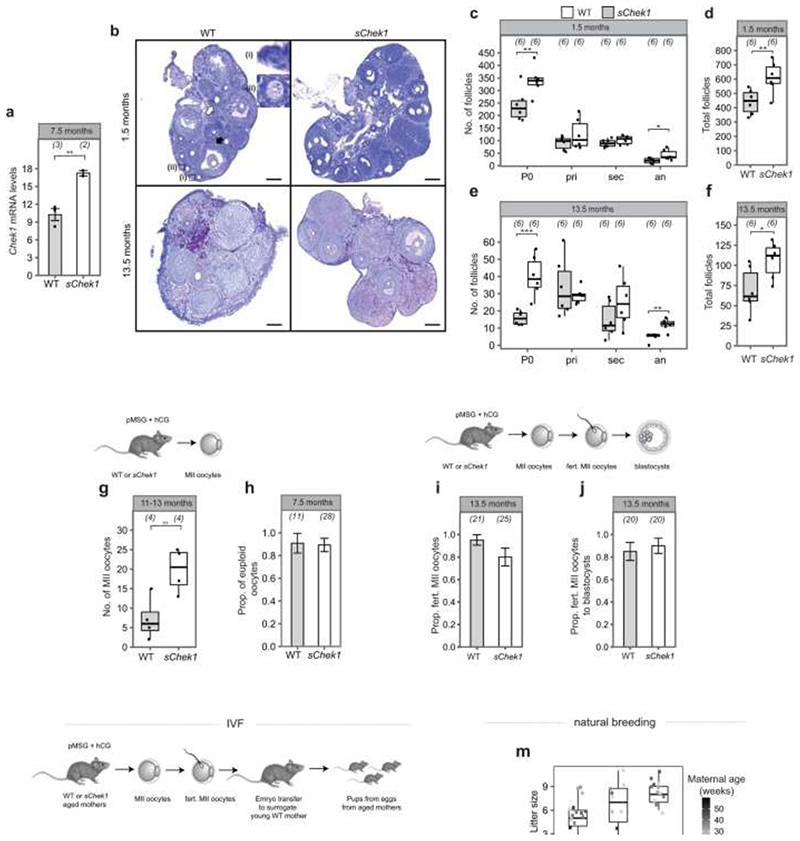
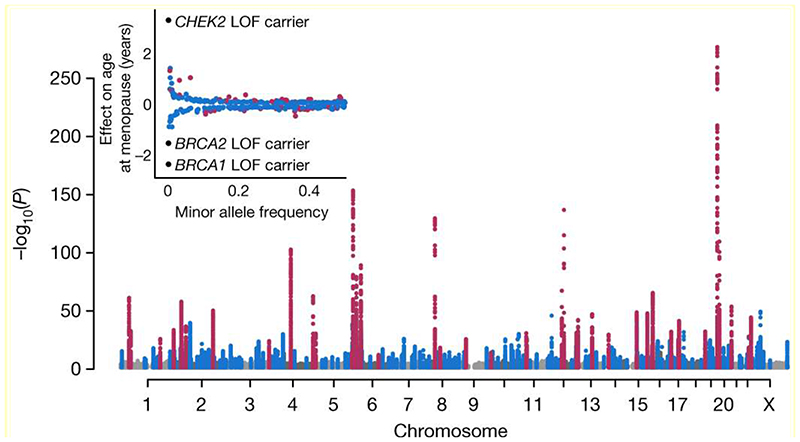
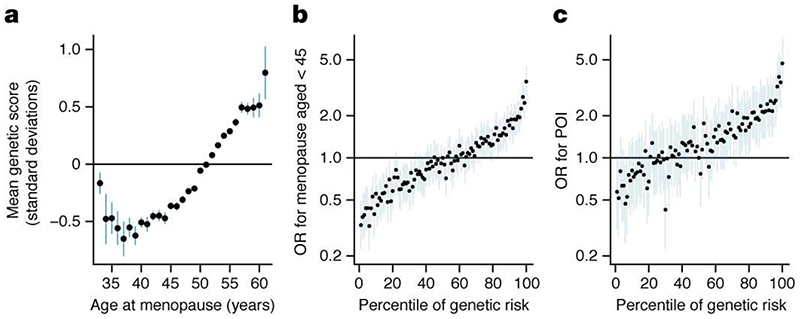
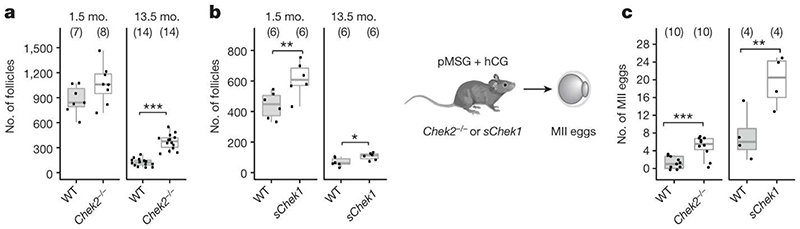
Reproductive longevity is essential for fertility and influences healthy ageing in women1,2, but insights into its underlying biological mechanisms and treatments to preserve it are limited. Here we identify 290 genetic determinants of ovarian ageing, assessed using normal variation in age at natural menopause (ANM) in about 200,000 women of European ancestry. These common alleles were associated with clinical extremes of ANM; women in the top 1% of genetic susceptibility have an equivalent risk of premature ovarian insufficiency to those carrying monogenic FMR1 premutations3. The identified loci implicate a broad range of DNA damage response (DDR) processes and include loss-of-function variants in key DDR-associated genes. Integration with experimental models demonstrates that these DDR processes act across the life-course to shape the ovarian reserve and its rate of depletion. Furthermore, we demonstrate that experimental manipulation of DDR pathways highlighted by human genetics increases fertility and extends reproductive life in mice. Causal inference analyses using the identified genetic variants indicate that extending reproductive life in women improves bone health and reduces risk of type 2 diabetes, but increases the risk of hormone-sensitive cancers. These findings provide insight into the mechanisms that govern ovarian ageing, when they act, and how they might be targeted by therapeutic approaches to extend fertility and prevent disease.


Conflict of interest statement

Competing interests

Full individual study and author disclosures can be found in the Supplementary Information.

Figures

Extended Data Figure 1
Extended Data Figure 1. Overview of ovarian reserve and follicular activity across reproductive life.
a, Key processes involved in follicular activity from fetal development to menopause showing the numbers of oocytes at each stage; b, Summary of key biological pathways involved in follicular activity and their relationship to stage of reproductive life. Follicles, consisting of oocytes and surrounding granulosa cells are formed in utero and maintained as resting primordial follicles in the cortex constituting the ovarian reserve. Follicles are sequentially recruited from the ovarian reserve at a rate of several hundred per month in childhood, peaking at around 900 per month at ~15 years of age. Following recruitment, follicles grow by mitotic division of granulosa cells and expansion of oocyte volume for almost 6 months until meiosis is reinitiated at ovulation and the mature oocyte is released into the oviduct. Waves of atresia (follicle death) accompany developmental transitions and growing follicles are continuously induced to undergo cell death such that, typically, only a single follicle matures to ovulate each month. As ovarian reserve declines the rate of follicle recruitment decreases, but the preovulatory follicles continue to produce substantial amounts of oestrogen, while other important hormones such as anti-Müllerian hormone and inhibin-B decline, leading to upregulation of the hypothalamus-pituitary gonadal axis.
Extended Data Figure 2
Extended Data Figure 2. Overview of performed analyses.
Extended Data Figure 3
Extended Data Figure 3. Consistency of effect estimates across analyses methods and strata.
Comparison of effect estimates from: a, Cox proportional hazards regression in UK Biobank with linear regression effect estimates from the overall meta-analysis (“Effect full metaanalysis”); b, Cox proportional hazards regression in UK Biobank with linear regression effect estimates from the meta-analysis excluding UK Biobank (“Effect 1KG+BCAC”); c, linear regression in UK Biobank with linear regression effect estimates from the meta-analysis excluding UK Biobank (“Effect 1KG+BCAC”). Comparison of linear regression effect estimates from: d, UK Biobank GWAS vs. the meta-analysis of 1000 Genomes imputed studies; e, UK Biobank GWAS vs. meta-analysis of samples from the Breast Cancer Association Consortium (BCAC); f, meta-analysis of BCAC samples vs. the meta-analysis of 1000 Genomes imputed studies; g, 23andMe replication analysis (rescaled) vs. overall meta-analysis. HR, hazard ratio from Cox proportional hazards model; r, Pearson correlation coefficient; blue line is y=x for reference. Note: P values < 1×10-300 are shown as 1×10-300.
Extended Data Figure 4
Extended Data Figure 4. Deviation from additive effects and distribution of estimated heritability across chromosomes.
a-d, Genome-wide significant signals showing departure from an additive model. We tested the identified signals for departure from an additive allelic model. a, rs11668344 shows no deviation from an additive allelic model; b, rs11670032 and c, rs28416520 show deviation from the additive allelic model and a recessive effect; and d, rs75770066 shows a heterozygote effect. The mean and 95% confidence interval around the mean estimate are shown for each genotype. The expected mean ANM for the heterozygotes is the average of the mean ANM in the homozygote groups. The dashed orange line shows the effect estimate by genotype from linear regression based on an additive allelic model. Estimated ANM for each genotype was calculated as constant from regression model + number alleles × effect estimate from regression model. The dashed grey line indicates the additive effect estimate by genotype from a model adjusting for the dominance deviation effect of the heterozygote group (solid grey line). All regression models were adjusted for centre, genotyping chip and genetic principal components. ANM, age at natural menopause; dom dev, dominance deviation. e, The percentage of the total heritability explained that was attributable to each chromosome (observed heritability) is compared with the expected proportion calculated on the basis of chromosome size. The heritability of ANM was not uniformly distributed across chromosomes in proportion to their size. The X-chromosome did not explain more heritability than expected given its size, however chromosome 19 explained 2.36% [1.98-2.75] of the trait variance – greater than the individual contributions of nearly all larger chromosomes (weighted average for chromosomes 1-18: 1.7%, s.e 0.2%) and ~2.5x more than expected given its size. This was partially attributable to a single locus at 19q13 which explained ~0.75% trait variance and where we mapped 6 independent signals (Supplementary Table 2). The dashed line shows the mean ratio of expected to observed heritability across all chromosomes. Chromosome size was estimated based on the number of genetic variants.
Extended Data Figure 5
Extended Data Figure 5. Gene co-regulation networks for age at menopause genes with those co-regulated with MCM8 highlighted.
a, Gene co-regulation network for genes relating to age at menopause. Nodes indicate genes that either in a cis region from the GWAS or have been prioritized by Downstreamer, edges indicate a co-regulation relationship with a Z-score >4. Co-regulation is defined as the Pearson correlation between genes in a scaled eigenvector matrix derived from a multi-tissue gene network. Cis genes are defined as genes that are within +/-300kb of a GWAS top hit for age at menopause. Trans genes are defined as having been prioritized by Downstreamer’s co-regulation analysis and are not within +/-300kb of a GWAS top hit. Downstreamer prioritizes genes by associating the gene p-value profile of the GWAS (calculated using PASCAL) to the co-regulation profile of each protein coding gene. Only genes where this association passes Bonferroni significance are shown as trans genes. Colours of nodes indicate the following: Teal indicates Cis genes, Dark Teal indicates Trans genes and Yellow indicates genes with a 1st degree relation to MCM8. b, Gene co-regulation network showing the genes that have a first degree relationship with MCM8 with a Z-score >4. Width of the edge indicates the Z-score of the co-regulation relationship. Colours indicate the same as in a, with the exception of Yellow, as all genes indicated have a 1st degree relation to MCM8.
Extended Data Figure 6
Extended Data Figure 6. DNA damage response and repair pathways implicated in reproductive ageing in humans.
a, Consequences of replication stress annotated with genes involved that were within 300kb of the age at natural menopause (ANM) signals; b, Genes involved in downstream DNA damage response and repair pathways with those within 300kb of an ANM signal shown in blue. A full list of genes involved in DNA damage response and apoptosis annotated with genome-wide signals for ANM is provided in Supplementary Table 19. MRN, MRN-MRE11-RAD50-NBS1 complex; RPA, Replication Protein A including a subunit encoded by RPA1; RFC, Replication Factor C including a subunit encoded by RFC1; 9-1-1, RAD9-HUS1-RAD1 complex.
Extended Data Figure 7
Extended Data Figure 7. Cluster plot of expression of consensus genes identified from the genome-wide analyses in germ cells across different developmental stages.
Genes were selected from the GWAS signals, based on in silico prioritisation (Supplementary Table 5). Of the 283 consensus genes highlighted by the GWAS, 258 passed QC and were available in the expression dataset. Gene expression was measured in human fetal primordial germ cells,, and oocytes and granulosa cells in adult follicles (dataset generated in this study). Plot shows Z-scores, calculated by subtracting the mean transcripts per million (TPM) in all samples for a gene and dividing by the standard deviation. GC, granulosa cell; MII, meiosis II; PGC, primordial germ cell; Wks, weeks.
Extended Data Figure 8
Extended Data Figure 8. Relationship between decreased ovarian reserve and gene expression.
Open bar/dot groups – control maternal diet, normal ovarian reserve. Grey bar/dot groups: obesogenic maternal diet, reduced ovarian reserve. a, Ovarian follicular reserve in young adulthood in wild-type mice. Total follicles/mm ovarian tissue at 12 weeks. Dots: individual observations. Bar heights and error bars: mean± SEM. n= 8 biologically independent animals from different litters in each group. P=0.0091 derived from 2-way ANOVA after correction for multiple hypothesis testing. b, Brsk1 expression in the same animals, measured using qrtPCR and expressed as average copy number. Dots: individual observations. Bar heights and error bars: mean± SEM. n= 8 biologically independent animals from different litters in each group. P=0.0001 derived from 2-way ANOVA after correction for multiple hypothesis testing. c, Wee1 expression in the same animals, measured using qrtPCR and expressed as average copy number. Dots: individual observations. Bar heights and error bars: mean± SEM. n= 8 biologically independent animals from different litters in each group. P=0.0256 derived from 2-way ANOVA after correction for multiple hypothesis testing. d, Dmc1 expression in the same animals, measured using qrtPCR and expressed as average copy number. Dots: individual observations. Bar heights and error bars: mean± SEM. n= 8 biologically independent animals from different litters in each group. P=0.00001 derived from 2-way ANOVA after correction for multiple hypothesis testing. e, Mapt expression in the same animals, measured using qrtPCR and expressed as average copy number. Dots: individual observations. Bar heights and error bars: mean± SEM. n= 8 biologically independent animals from different litters in each group. P=0.0378 derived from 2-way ANOVA after correction for multiple hypothesis testing. qrtPCR, quantitative reverse transcription polymerase chain reaction; SEM, standard error of mean. *, P<0.05; **, P<0.01; ***, P<0.001.
Extended Data Figure 9
Extended Data Figure 9. Chek2 deletion increases reproductive lifespan in mouse.
a, Representative images of ovarian sections of 1.5-and 13.5-month-old wild type (WT) and Chek2-/- mice stained with PAS-Hematoxylin. Primordial follicles (inset (i)), primary follicles (inset (ii)), secondary follicle (white arrow) and antral follicle (black arrow) are shown. Scale bar represents 200 μm. b-e, Quantification of the number of follicles (by class and total) present in WT and Chek2-/- mice ovaries: b, c, 1.5-month-old; d, e, 13.5-month-old. The numbers in parentheses correspond to the total number of ovaries analysed. f, Serum AMH (ng/ml) in 16-17 months old Chek2-/- mice. The numbers in parentheses correspond to the number of mice assessed. g-i, Diagram illustrates the gonadotrophin stimulation of 13.5-month old females. Numbers in parentheses show: g, the number of MII oocytes retrieved per female; h, the number of MII oocytes fertilized; and i, the number of fertilized oocytes assessed for blastocyst formation. j, Litter size of WT and Chek2-/- females throughout the reproductive life span. Litter sizes from 9 WT and 5 Chek2-/- females are shown. Breeding cages contained one male and one female. Generalized linear model analysis showed maternal age effect, but no effect on genotype on litter sizes. k, Image of healthy pups born to 13 month-old Chek2-/- females. b-i, Two sample t and Fisher’s exact tests were used to compare WT and Chek2-/- for statistical significance: *, P<0.05; **, P<0.025; ***, P<0.001. All P-values are two sided. Error bars indicate standard error of mean. Box-and-whisker plots show interquartile range and median (b-g). an, antral follicle; hCG, human chorionic gonadotrophin; pMSG, pregnant mare serum gonadotrophin; pri, primary follicle; P0, primordial follicle; sec, secondary follicle; WT=wildtype. Mouse strain: maintained on a mixed background, C57BL/6 129Sv, accession number BRC03481 at the RIKEN Bioresource Centre.
Extended Data Figure 10
Extended Data Figure 10. Conditional knockout Chek1 females are infertile due to requirement for Chek1 during preimplantation embryo development.
a, Schematic of the conditional-knockout mouse model of Chek1 (Chek1 cKO) in the female germline using the Ddx4-Cre. A similar approach was used for Zp3-Cre. b, In the ovarian sections stained with haematoxylin and eosin, we found follicles, corpora lutea (CL) and oocytes which contain nuclear structures (indicated with arrowheads in the magnified right hand panel). These findings suggest that estrus cycles and ovulation followed by corpus luteum formation are independent from Chek1 disruption in oocytes in vivo. c, Litter size of Chek1 cKO females. Three females older than 5 weeks age were mated with C57BL/6J males. Five independent littermate females (F/+, Tg-/Tg-; F/F, Tg-/Tg-; or F/+, Tg+/Tg-) were used as Chek1 controls (ctrl). While Chek1 ctrl females delivered normally, Chek1 cKO females delivered no litters (**, Mann Whitney test P=0.0179). Thus, these results indicate that CHEK1 is essential in the female germline. d, Litter size of Chek1-cKO and controls using the Zp3-Cre during follicular growth. 3 months old control (Chek1 F/F; Chek1 ctrl, n=4) and conditional knockout (Chek1 F/F; Chek1 cKO with Zp3-Cre, n=4) were three-times consecutively mated with wild-type (Chek1+/+) males, and the number of live (left) and dead (right) pups was monitored. While Chek1 ctrl delivered a normal amount of live pups, Chek1 cKO had only a reduced amount of perinatally dead pups (Mann-Whitney U Test: ***, P<0.001; **, P<0.01). Numbers in parentheses show the number of litters. e, The mean number of all ovulated eggs (the sum of MII oocytes and fertilized MII oocytes) per mouse with SEM (Mann Whitney U Test, P=0.126). Each data point presents the no. of eggs per mouse. 3-5 months old Chek1 ctrl (n=3) and Chek1 cKO (n=5) females were mated with wild-type (Chek1+/+) males after pMSG + hCG stimulation. The number of ovulated eggs isolated 18 h post hCG stimulation and additional 10 h cultured in vitro was scored. The number of mice is shown in brackets. f, The proportion of fertilized MII oocytes to all ovulated eggs with a binomial confidence interval (*, Fisher’s Exact Test, P=0.012; 95% CI 1.9–6.0; OR: 2.62). Numbers in parentheses show the total number of analysed eggs. g, The proportion of embryos that developed to blastocysts with binomial confidence interval (***, Fisher’s Exact Test, P<0.0001). Fertilized MII oocytes (zygotes) were isolated from pMSG + hCG stimulated females 18h post hCG administration and cultured in vitro for 96 hours (~ E3.5) when development to blastocyst was scored. Data are pooled from four independent experiments. The number of embryos is shown in brackets. h, Fertilized eggs from Chek1 ctrl (n=18) and Chek1 cKO (n=13) females were fixed and stained for DNA (DAPI). All fertilized eggs from both genotypes showed normal pronuclei formation. The data were pooled from two independent experiments. Asterisks mark polar bodies. i, The majority of Chek1 ctrl embryos formed blastocyst (g), but Chek1 cKO embryos were arrested mainly in 3-8 cell stages. Representative bright-field images are shown. j, Proportion of developmental stages 2 cell, 3-4 cell and 5-8 cell (**, Cochran-Armitage Trend Test, P=0.0073). Chek1 ctrl and Chek1 cKO zygotes were isolated from 13 Chek1 ctrl and 6 Chek1 cKO pMSG + hCG stimulated females 18h post hCG administration and cultured in vitro for 49 hours. Embryos were fixed and stained for ƔH2AX by immunofluorescence. DNA was visualized by DAPI (l). k, Proportion of embryos with genome fragmentation with binomial confidence interval (***, Fisher’s Exact Test, P<0.0001). Data are pooled from two independent experiments. The number of embryos is shown in brackets. l, Chek1 ctrl and Chek1 cKO zygotes (j,k) were fixed and stained for ƔH2AX (magenta) by immunofluorescence. DNA (gray) was visualized by DAPI. Arrows indicate genome fragments. Asterisks indicate polar bodies. These findings suggest that maternally expressed Chek1 is critical for genome integrity protection during first divisions of preimplantation embryos in mice. All P-values are two sided. Box-and-whisker plots show interquartile range and median. Strains: C57BL/6-FVB mixed background for a-c (Chek1 cKO, Ddx4-Cre); C57BL6-CD1 mixed background (Chek1 cKO, Zp3-Cre) for panels d-l.
Extended Data Figure 11
Extended Data Figure 11. Extended reproductive lifespan in females carrying an extra copy of Chek1 (sChek1).
a, mRNA expression levels of Chek1 in oocytes, numbers in parentheses show the number of mice stimulated for retrieving the oocytes. b, Representative images of ovarian sections of 1.5 and 13.5-month-old wild type (WT) and sChek1 mice stained with PAS-hematoxylin. Primordial follicles (inset (i)), primary follicles (inset (ii)), secondary follicle (white arrow) and antral follicle (black arrow) are shown. Scale bar: 200 μm. c-f, Quantification of the number of follicles (by class and total) present in WT and sChek1 littermates: c, d, 1.5-month-old; e, f, 13.5-month-old. The numbers in parentheses correspond to the total number of ovaries analysed. g-j, MII oocytes retrieved in response to pMSG and hCG, proportion of euploid oocytes, proportion fertilized and proportion developed to blastocysts at different ages of WT and sChek1 mice. Numbers in parentheses show: g, the number of MII oocytes retrieved per female; h, the number of oocytes assessed for aneuploidy; i, the number of MII oocytes fertilized; and j, the number of fertilized oocytes assessed for blastocyst development. k, Proportion of live births relative to transferred embryos from in vitro fertilized oocytes from aged mice (16 months), the numbers in parenthesis show the embryos transferred. l, Photo of healthy pups born to 16-month old sChek1 females after IVF. m, Litter sizes from F2 females or males from aged sChek1 females after IVF treatment in k, compared to females of equivalent ages that were naturally breeding. Note that for natural breeding there were two females and one male per breeding cage, whereas F2 cages contained a single male and one female. Therefore, litter sizes are an underestimate for the IVF-conceived pups. n, Litter sizes of WT and sChek1 females throughout their reproductive life span. Data are from six breeding cages, three for each genotype. Each breeding cage contained one WT male and two females that were either WT or sChek1. Generalized linear model analysis showed maternal age effect, but no effect on genotype on litter sizes. a-k, Two sample t and Fisher’s exact tests were used to compare WT and sChek1 for statistical significance: *, P<0.05; **, P<0.025; ***, P<0.001. All P-values are two sided. Error bars indicate standard error of mean. Box-and-whisker plots show interquartile range and median (c-g, m). an=antral follicle; hCG= human chorionic gonadotrophin; IVF=in vitro fertilization; NB=natural breeding; F2-f= F2 female; F2-m= F2 male; pMSG=pregnant mare serum gonadotrophin; pri=primary follicle; P0=primordial follicle; sec=secondary follicle; WT=wild type. Mouse strain: inbred from mixed background C57BL/6 129Sv.
Figure 1
Figure 1. Manhattan plot representing GWAS discovery analysis.
Previously identified loci in purple, novel loci in blue. Plotted variants have P<0.01 with P<1x10-300 truncated. Insert: Effect sizes and minor allele frequencies of the loci. LOF, loss of function
Figure 2
Figure 2. Polygenic prediction of age at menopause.
a, Mean polygenic score (PGS; scaled to have mean=0, SD=1) for a given age at natural menopause (ANM). Higher PGS indicates later ANM. b, c, Association of each centile of PGS vs the 50th with, b, early menopause and, c, premature ovarian insufficiency. Higher PGS indicates earlier ANM.
Figure 3
Figure 3. Genetic manipulation of Chek1 or Chek2 extends reproductive lifespan in mouse models.
Numbers of follicles in young and aged, a, Chek2-/- or, b, sChek1 females. Numbers of ovaries analysed in parentheses. c, Response to gonadotrophin stimulation of 13.5-month-old Chek2-/- and sChek1 females assessed by the number of MII oocytes retrieved. Numbers of stimulated females in parentheses. Box-and-whisker plots show interquartile range and median. Two-sample t and Fisher’s exact tests used for comparisons: *, P<0.05; **, P<0.025; ***, P<0.001.

Comment in

Similar articles

Cited by

References

    1. Lambalk CB, van Disseldorp J, de Koning CH, Broekmans FJ. Testing ovarian reserve to predict age at menopause. Maturitas. 2009;63:280–91. - PubMed
    1. Collaborative Group on Hormonal Factors in Breast Cancer. Type and timing of menopausal hormone therapy and breast cancer risk: individual participant meta-analysis of the worldwide epidemiological evidence. Lancet (London, England) 2019;394:1159–1168. - PMC - PubMed
    1. Murray A, et al. Population-based estimates of the prevalence of FMR1 expansion mutations in women with early menopause and primary ovarian insufficiency. Genet Med. 2014;16:19–24. - PMC - PubMed
    1. Christensen K, Doblhammer G, Rau R, Vaupel JW. Ageing populations: the challenges ahead. Lancet (London, England) 2009;374:1196–208. - PMC - PubMed
    1. InterLACE Study Team. Variations in reproductive events across life: a pooled analysis of data from 505 147 women across 10 countries. Hum Reprod. 2019;34:881–893. - PMC - PubMed

MeSH terms

Grants and funding