. 2021 Sep;16(9):4109-4143.
doi: 10.1038/s41596-021-00560-y. Epub 2021 Aug 4.

Generation of insulin-producing pancreatic β cells from multiple human stem cell lines

Affiliations

Generation of insulin-producing pancreatic β cells from multiple human stem cell lines

Nathaniel J Hogrebe et al. Nat Protoc. 2021 Sep.

Abstract

We detail a six-stage planar differentiation methodology for generating human pluripotent stem cell-derived pancreatic β cells (SC-β cells) that secrete high amounts of insulin in response to glucose stimulation. This protocol first induces definitive endoderm by treatment with Activin A and CHIR99021, then generates PDX1+/NKX6-1+ pancreatic progenitors through the timed application of keratinocyte growth factor, SANT1, TPPB, LDN193189 and retinoic acid. Endocrine induction and subsequent SC-β-cell specification is achieved with a cocktail consisting of the cytoskeletal depolymerizing compound latrunculin A combined with XXI, T3, ALK5 inhibitor II, SANT1 and retinoic acid. The resulting SC-β cells and other endocrine cell types can then be aggregated into islet-like clusters for analysis and transplantation. This differentiation methodology takes ~34 d to generate functional SC-β cells, plus an additional 1-2 weeks for initial stem cell expansion and final cell assessment. This protocol builds upon a large body of previous work for generating β-like cells. In this iteration, we have eliminated the need for 3D culture during endocrine induction, allowing for the generation of highly functional SC-β cells to be done entirely on tissue culture polystyrene. This change simplifies the differentiation methodology, requiring only basic stem cell culture experience as well as familiarity with assessment techniques common in biology laboratories. In addition to expanding protocol accessibility and simplifying SC-β-cell generation, we demonstrate that this planar methodology is amenable for differentiating SC-β cells from a wide variety of cell lines from various sources, broadening its applicability.


Conflict of interest statement

COMPETING INTERESTS

N.J.H. and J.R.M. are inventors on patents and patent applications related to the SC-β cell differentiation protocol described in this manuscript.

Figures
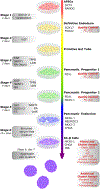
Figure 1)
Figure 1). Overview of the 6-stage SC-β cell differentiation protocol.
HPSCs are first seeded onto Matrigel-coated plates. Over the next 5 weeks, these stem cells are driven through intermediate cell types toward a β cell fate by progressive stages of specific growth factor and small molecule combinations in serum-free media. This stepwise approach attempts to recreate stages of embryonic development in order to achieve high differentiation efficiency and SC-β cell maturity. At the end of stages 1, 3, and 4, the current quality of the differentiation can be assessed by flow cytometry (FC) and immunocytochemistry (ICC) of the indicated markers. After two weeks into stage 6, the presence of SC-β cells can be determined by measuring marker expression with FC, ICC, and qRT-PCR. Furthermore, the functionality of these cells can be assessed by a static glucose-stimulated insulin secretion (GSIS) assay as well as measuring both insulin content and the ratio of proinsulin/insulin content. These assays can be completed on SC-β cells still attached to the plate or after they have been aggregated into islet-like clusters during stage 6. Additional assays can be performed on these clusters, including a dynamic GSIS assay to further profile their functional characteristics and transplantation into diabetic mice to assess the cell clusters’ in vivo performance.
Figure 2)
Figure 2). Morphology of differentiating cells.
Representative brightfield images at each stage of the protocol for the HUES8 cell line at both low (a-e, k-o, scale bar = 500 μm) and high (f-j, p-t, scale bar = 100 μm) magnification. The specific morphology at each stage can be indicative of the quality of the differentiation.
Figure 3)
Figure 3). Quality control during differentiation.
To quantitatively assess differentiation status, flow cytometry can be used to look for key markers at (a) the end of stage 1 (FOXA2+/ SOX17+, >90%), (b) the end of stage 3 (PDX1+, >80%), and (c) the end of stage 4 (PDX1+/NKX6–1+, >40%). (d-e) These markers can also be quickly assessed qualitatively with ICC. The HUES8 line was stained (d) at the end of stage 1 for FOXA2/SOX17 and (e) at the end of stage 4 for PDX1/NKX6–1. Scale bars = 100 μm.
Figure 4)
Figure 4). Setup for the dynamic GSIS assay.
(a) Schematic of the chambers used to immobilize the SC-β cell clusters as fluid flows across the cells. (b-c) The SC-β cell clusters are sandwiched between two layers of hydrated polyacrylamide microbeads. (d) This chamber containing the SC-β cell clusters is attached to a perfusion pump and placed in a water bath at 37°C. 2 mM and 20 mM glucose solutions are pumped through the chambers at a flow rate of 100 μL/min, and the effluent is collected in a 96-well plate that is manually moved every 2 minutes. Up to 8 chambers can be run at once with the specified pump.
Figure 5)
Figure 5). SC-β cells differentiated from a wide range of cell lines.
(a) SC-β cells, indicated by the co-expression of NKX6–1 and C-peptide as assessed by flow cytometry, can be robustly differentiated from a variety of cell lines with this protocol (n = 6 for HUES8, 1013–4FA, and 1016SeVA; n = 4 for human islets, H1, AN1.1, 1031SeVA, and WS4corr; n = 3 for 1026–3FC and WS4unedit; n = 2 for T2D001A). (b) While all these SC-β cells secrete insulin, their glucose responsiveness in a static GSIS assay is dependent upon their genetic background and disease state (n = 7 for WS4corr and WS4unedit; n = 5 for HUES8; n = 4 for donor #1, H1, 1013–4FA, 1016SeVA, AN1.1, and 1031SeVA; n = 3 for donor #2, donor #3, 1026–3FC, and T2D001A). A paired, two-way t-test was performed between low and high glucose for each cell line. (c) Representative brightfield images of human islets and the SC-β cells derived from each cell line after stage 6 aggregation into islet-like clusters. All data presented in this figure are from stage 6 cells after aggregation into clusters. All data are represented as the mean, and all error bars represent SEM. Individual data points are shown for all bar graphs, where n = number of separate wells from one or more independent differentiations. n.s. = not significant; * = P < 0.05, ** = P < 0.01, *** = P < 0.001.
Figure 6)
Figure 6). In-depth characterization of SC-β cells.
(a) Immunostaining of histological sections of SC-β cell clusters demonstrates that a majority of cells are co-positive for C-peptide and NKX6–1, while there are also a few glucagon (GCG) and somatostatin (SST) positive cells. (b) This ratio of C-peptide, GCG, and SST is confirmed quantitatively by flow cytometry (n = 4). (c) SC-β cell clusters demonstrate both first and second phase insulin secretion in a dynamic GSIS assay (n = 4). (d-e) SC-β cells generated with this protocol have high insulin content and a favorable proinsulin/insulin content ratio (< 0.1) (n = 4 for HUES8 and 1026–3FC; n = 3 for WS4corr and human islets). (f) They also express similar levels of a number of islet genes compared with primary human islets, though some gene expression differences persist (n = 5 for human islets and 1026–3FC; n = 4 for 1031SeVA; n = 3 for stem cells and HUES8). The ΔΔCt method was used to calculate relative mRNA expression. For the assays shown here, data is given for HUES8 and 2 iPSC lines compared with primary human islets. The original protocol was developed with the HUES8 cell line, and thus it can serve as a good baseline to compare SC-β cells generated from new cell lines. All data presented in this figure are from stage 6 cells after aggregation into clusters. All data are represented as the mean, and all error bars represent SEM. Individual data points are shown for all bar graphs, where n = number of separate wells from one or more independent differentiations.

References

    1. Brennan DC, Kopetskie HA & Sayre PH Long-term follow-up of the Edmonton protocol of islet transplantation in the United States. Am. J. Transplant 16, 509–17 (2016). - PubMed
    1. Shapiro J et al. Islet transplantation in seven patients with type 1 diabetes mellitus using a glucocorticoid-free immunosuppressive regimen. New. Engl. J. Med 343, 230–38 (2000). - PubMed
    1. D’Amour KA et al. Efficient differentiation of human embryonic stem cells to definitive endoderm. Nat. Biotechnol 23, 1534–41 (2005). - PubMed
    1. D’Amour KA et al. Production of pancreatic hormone-expressing endocrine cells from human embryonic stem cells. Nat. Biotechnol 24, 1392–1401 (2006). - PubMed
    1. Nostro MC et al. Stage-specific signaling through TGFβ family members and WNT regulates patterning and pancreatic specification of human pluripotent stem cells. Development 138, 861–71 (2011). - PMC - PubMed

Key references using this protocol

    1. Hogrebe N et al. Nat Biotechnol 38, 460–470 (2020): 10.1038/s41587-020-0430-6 - DOI - PMC - PubMed
    1. Maxwell KG et al. Sci. Transl. Med 12, eaax9106 (2020): 10.1126/scitranslmed.aax9106 - DOI - PMC - PubMed
    1. Augsornworawat P et al. Cell Reports 32, 108067 (2020): 10.1016/j.celrep.2020.108067 - DOI - PMC - PubMed

Publication types